Community Profiles
Mesa County is a unique community.
Located on the western border of Colorado, Mesa County spans 3,313 square miles, about 70% of which is public land including the Colorado National Monument and Grand Mesa National Forest. Spanning the region is the Grand Valley, the most densely populated area on Colorado’s Western Slope, covering more than 38 square miles at an elevation of 4,586 feet.
Mesa County’s most populous city, Grand Junction, lies in the central region of the Grand Valley and makes up about 42% of the county population. The county also includes smaller communities, such as Fruita, Clifton, Palisade, and many others.
Grand Junction is a regional hub for healthcare, the largest between Denver and Salt Lake City, serving a population of over 500,000 people in western Colorado and eastern Utah.
Innovative business and career-building opportunities, big-city amenities with a small-town atmosphere, and abundant outdoor recreation all contribute to making this a great place to live, work, and play.
In this section, we provide a picture of the population demographics and economic characteristics of the county as a whole, as well as for each community individually. This overview gives community leaders a better understanding of those they serve.
Mesa County Profile
Quality of Life.
An exceptional quality of life is a priority for the community in Mesa County. Quality of life is the measure of well-being for a population or an individual in the context of their health, environment, and opportunities.
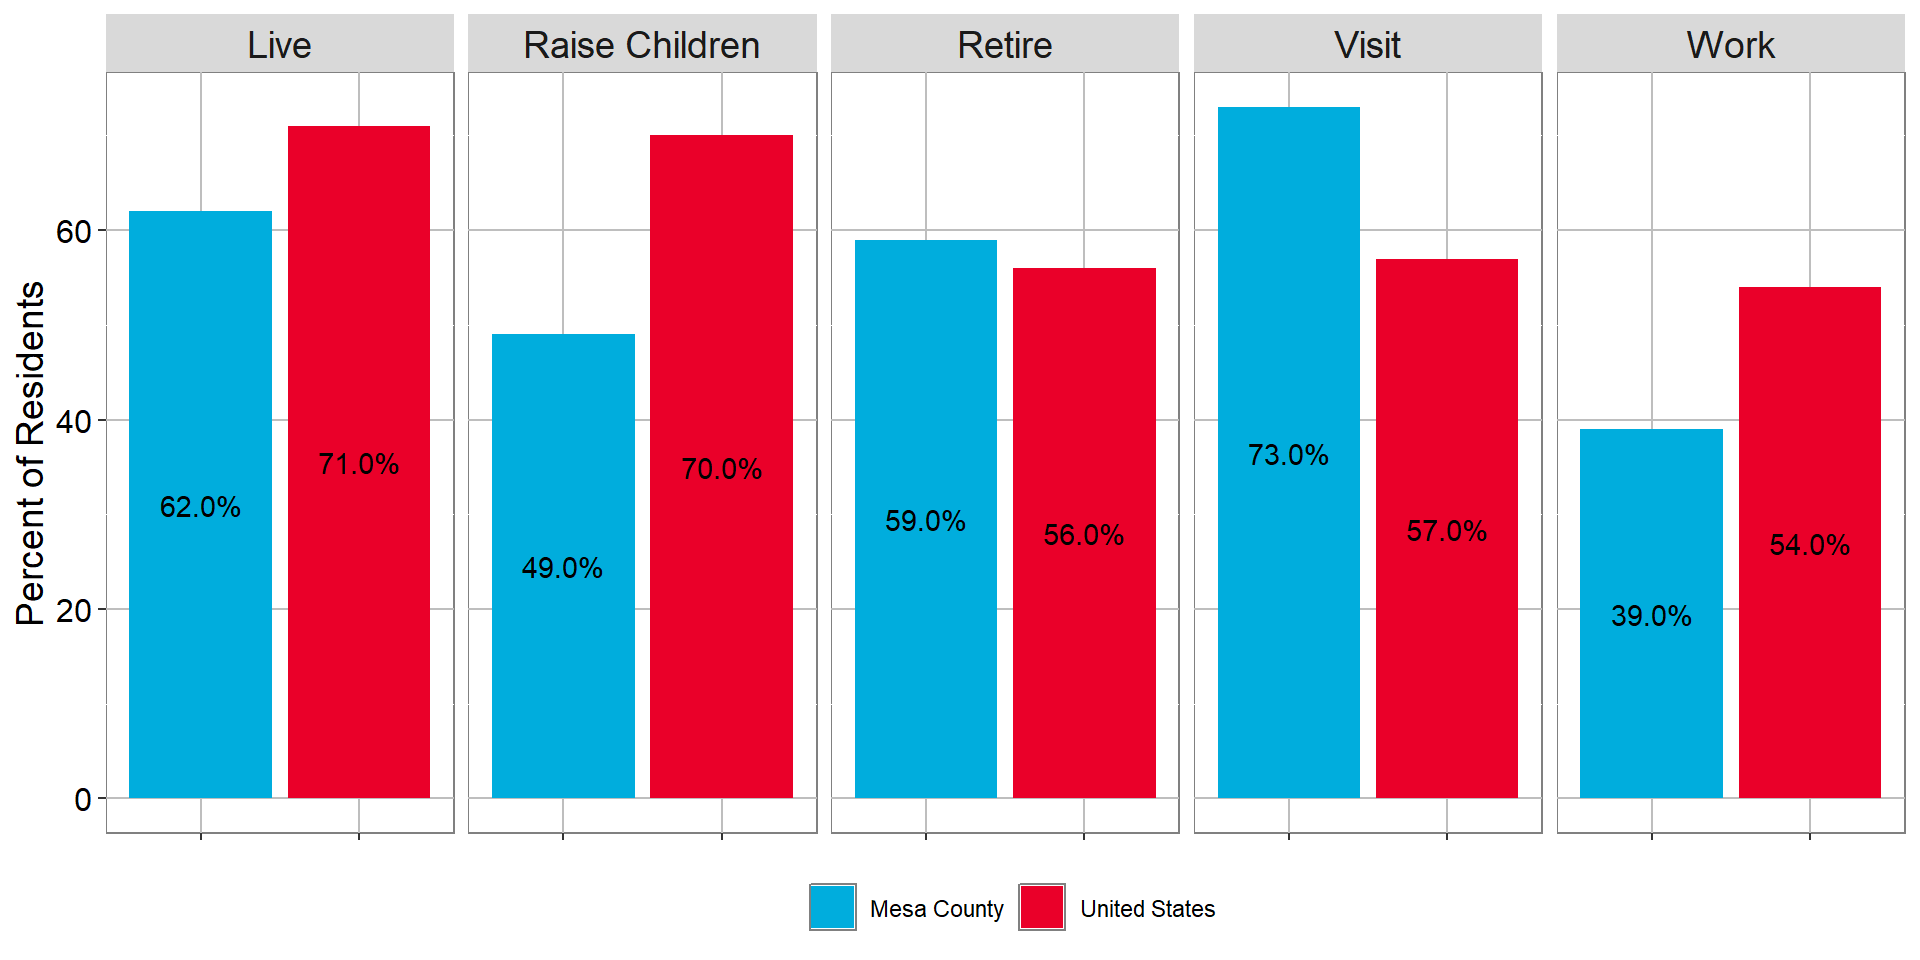
In the 2022 Tell Us Community Survey, residents provided their perspective on quality of life in Mesa County, including evaluations of Mesa County as a good place to visit, live, work, raise children, and retire. The ultimate aim of these quality of life metrics is a community where all residents have the opportunity to thrive.
QUALITY OF LIFE (2020 & 2022)
MY COMMUNITY IS A GOOD PLACE TO …
QUALITY OF LIFE (2020 & 2022)
MY COMMUNITY IS A GOOD PLACE TO …
| Region | Live | Raise Children | Retire | Visit | Work |
|---|---|---|---|---|---|
| Mesa County | 62.0% | 49.0% | 59.0% | 73.0% | 39.0% |
| United States | 71.0% | 70.0% | 56.0% | 57.0% | 54.0% |
Sources: Mesa County Tell Us Community Survey, 2022
 Tellus Community Survey 2022
Overall, 58% of residents agreed that Mesa County provides a good quality of life.
Population Growth and Age Distribution
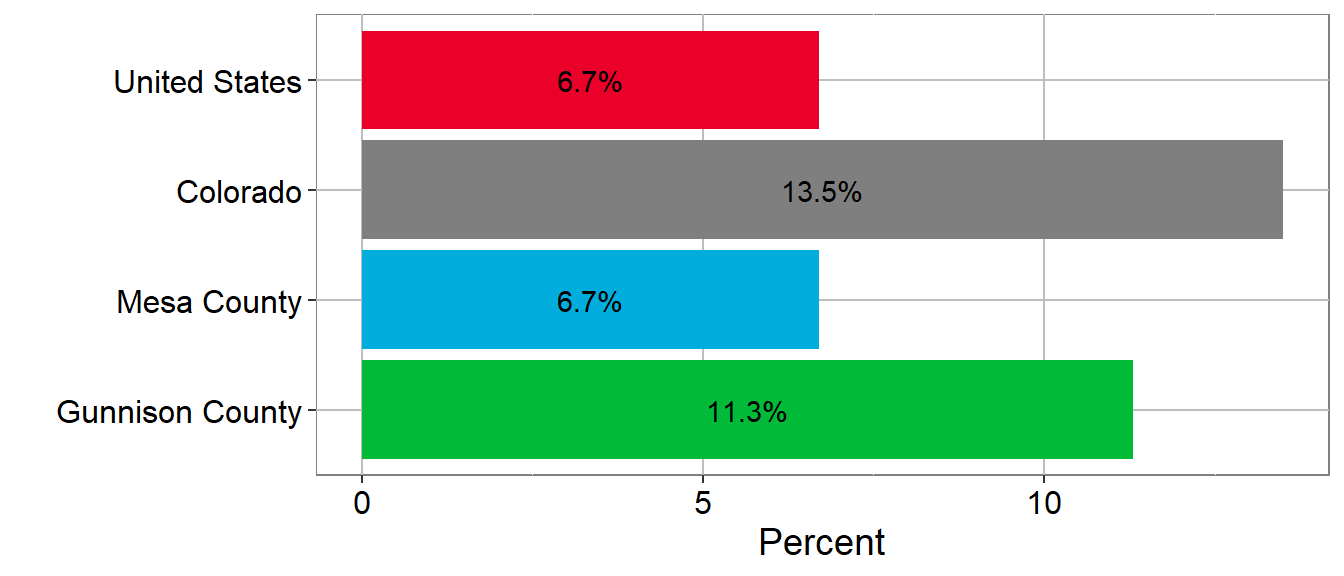
Population Growth - Growing Population
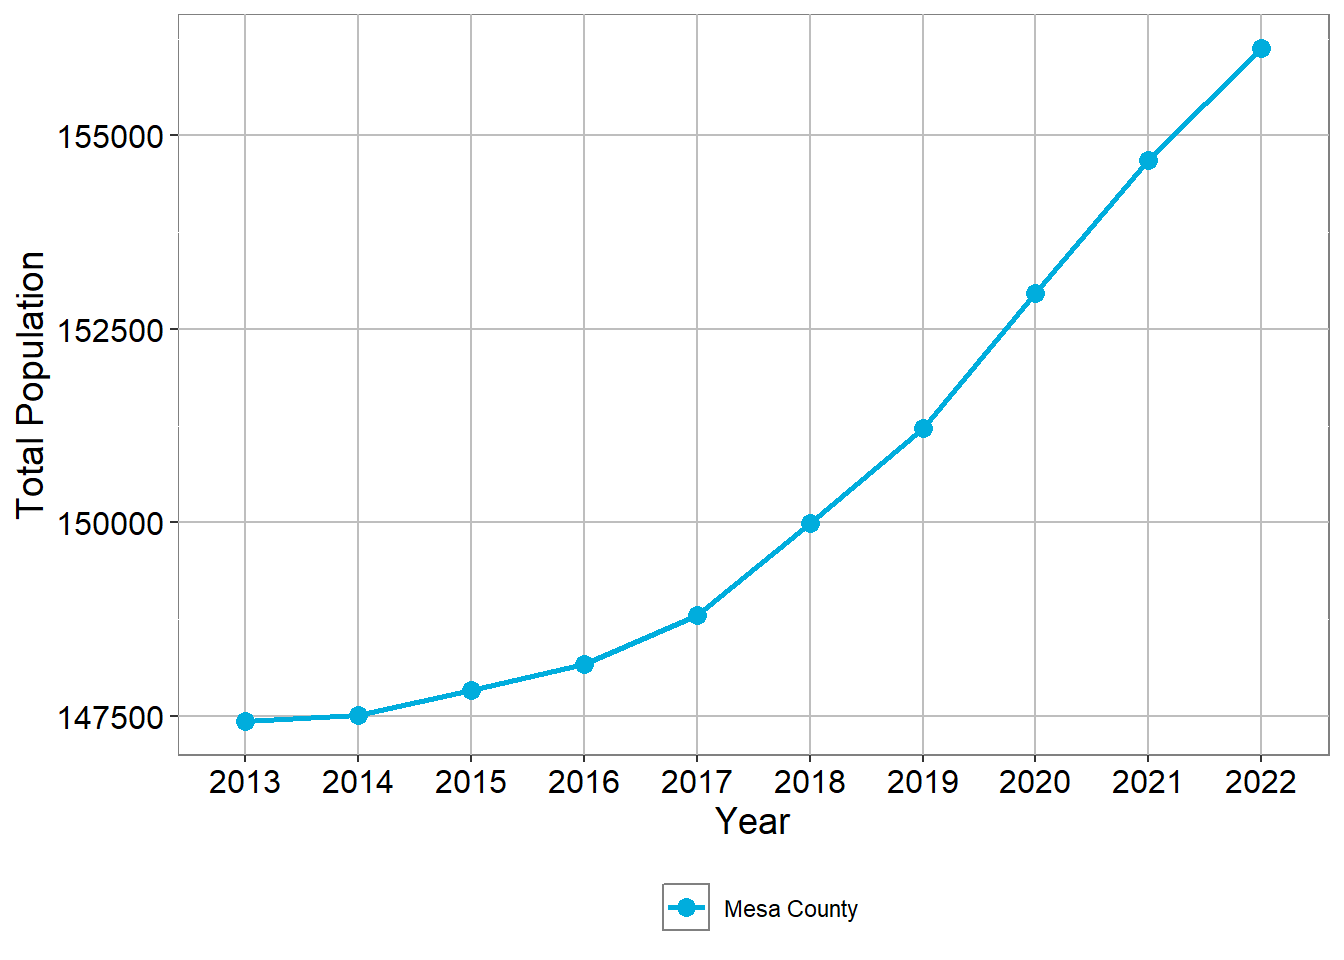
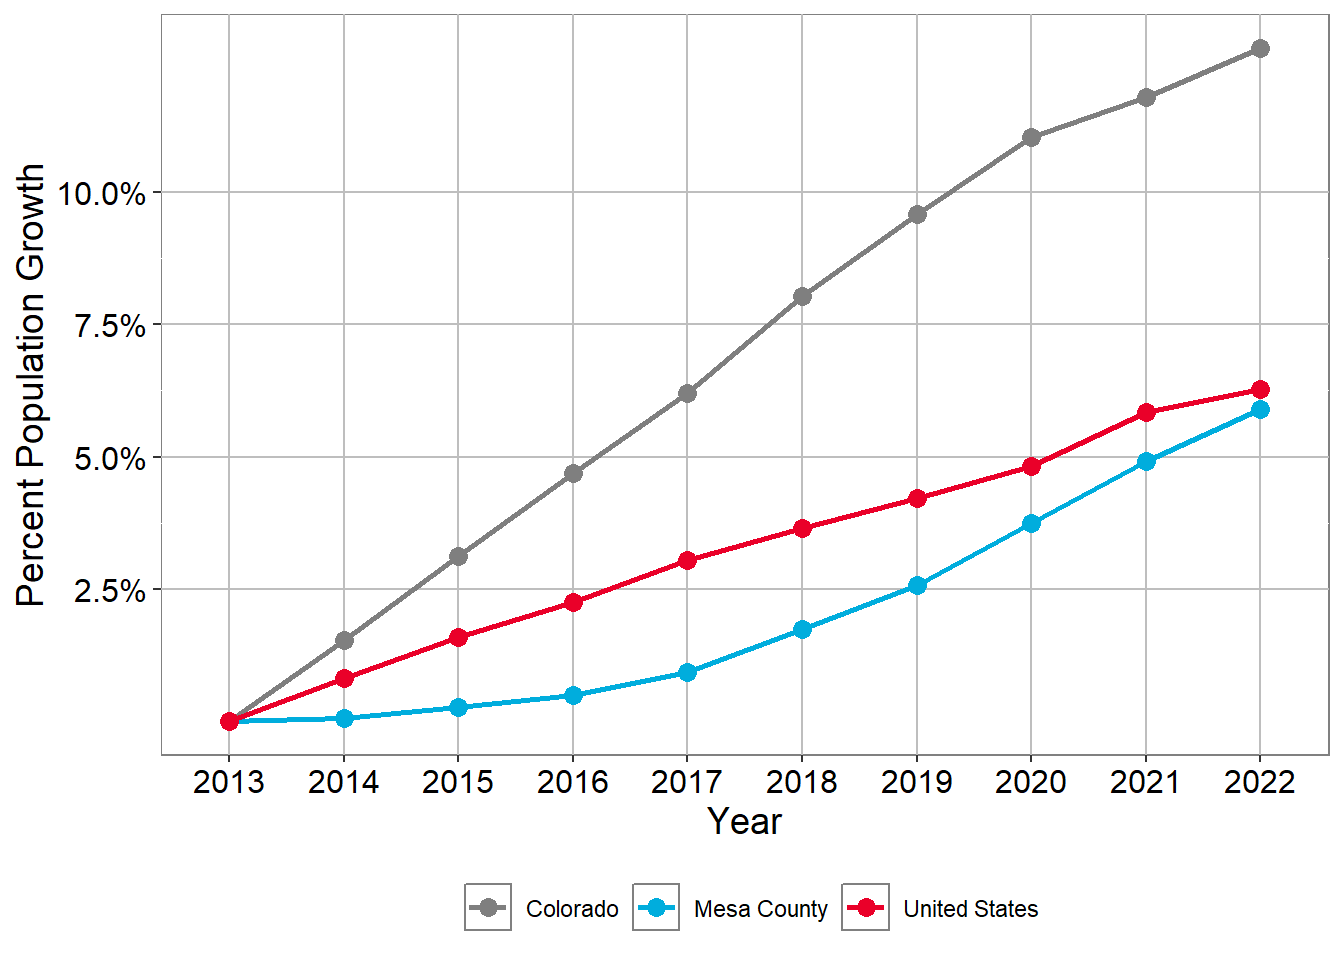
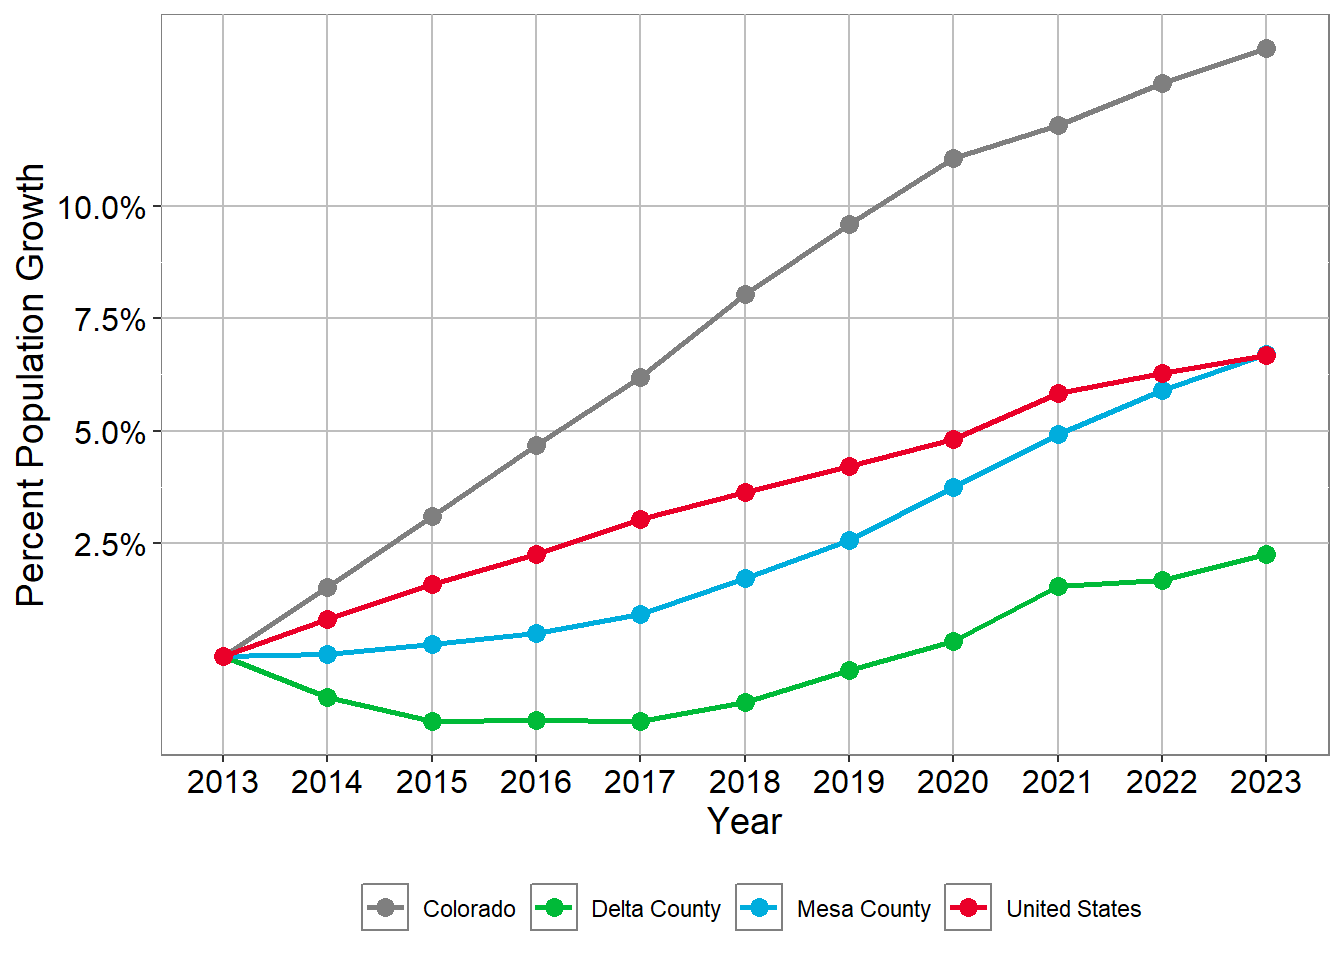
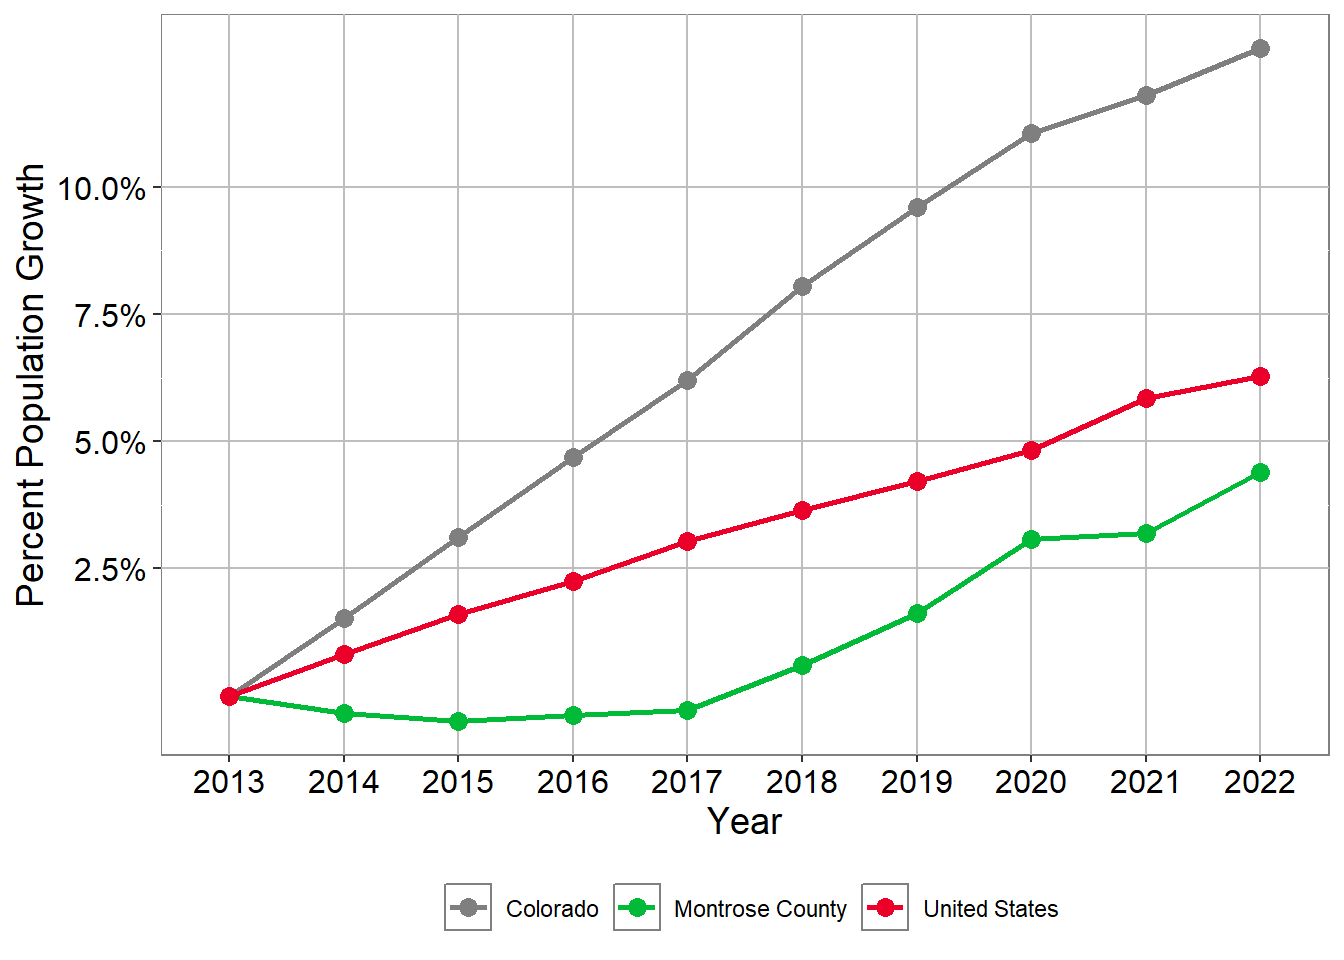
Mesa County is a growing community. Over the last decade, Mesa County’s total population has increased by about 10,000 people. The increase was slow from 2013 to 2017, and accelerated starting in 2018. From 2018 to 2022, Mesa County had a population growth rate similar to the statewide rate, about 1% each year.
Mesa County Population growth since 2013
Population growth comparison 2014
Mesa County Population
| 2013 | 2014 | 2015 | 2016 | 2017 | 2018 | 2019 | 2020 | 2021 | 2022 | 2023 |
|---|---|---|---|---|---|---|---|---|---|---|
| 147,432 | 147,509 | 147,834 | 148,166 | 148,798 | 149,998 | 151,218 | 152,962 | 154,685 | 156,131 | 157,316 |
Population growth comparison since
| Region | 2013 | 2014 | 2015 | 2016 | 2017 | 2018 | 2019 | 2020 | 2021 | 2022 | 2023 |
|---|---|---|---|---|---|---|---|---|---|---|---|
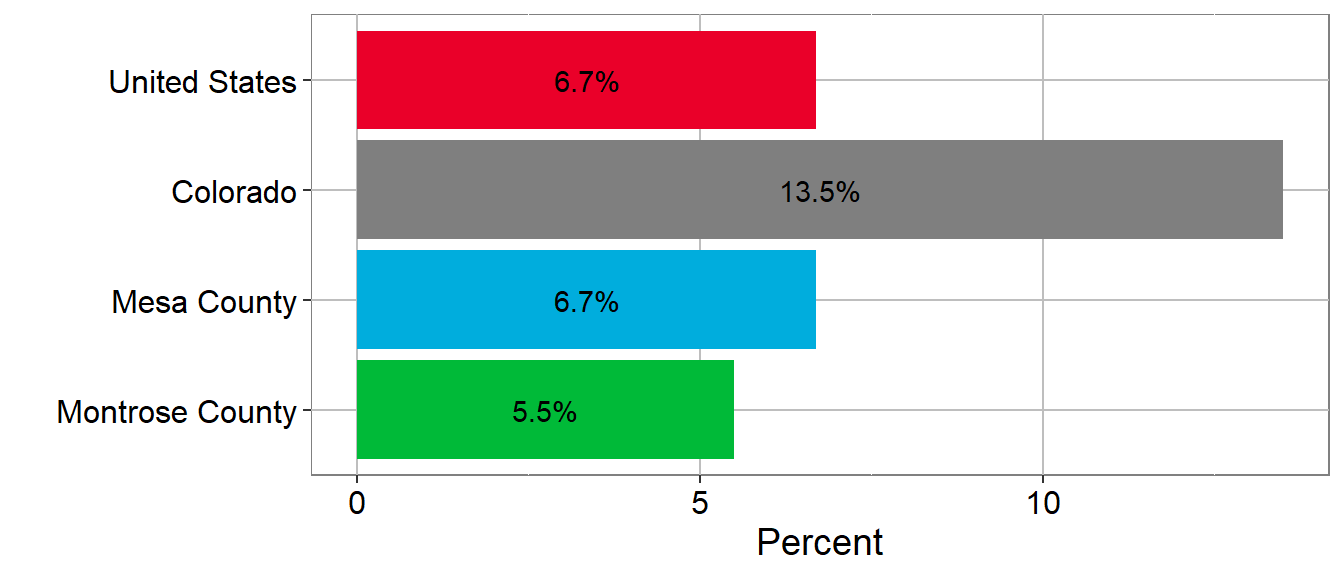
| Colorado | 0.0% | 1.5% | 3.1% | 4.7% | 6.2% | 8.0% | 9.6% | 11.0% | 11.8% | 12.7% | 13.5% |
| Mesa County | 0.0% | 0.1% | 0.3% | 0.5% | 0.9% | 1.7% | 2.6% | 3.8% | 4.9% | 5.9% | 6.7% |
| United States | 0.0% | 0.8% | 1.6% | 2.3% | 3.0% | 3.6% | 4.2% | 4.8% | 5.8% | 6.3% | 6.7% |
Source: U.S. Census Bureau, American Community Survey 5-year estimates, Table: S0101; AGE AND SEX 2023
Components of Population Change
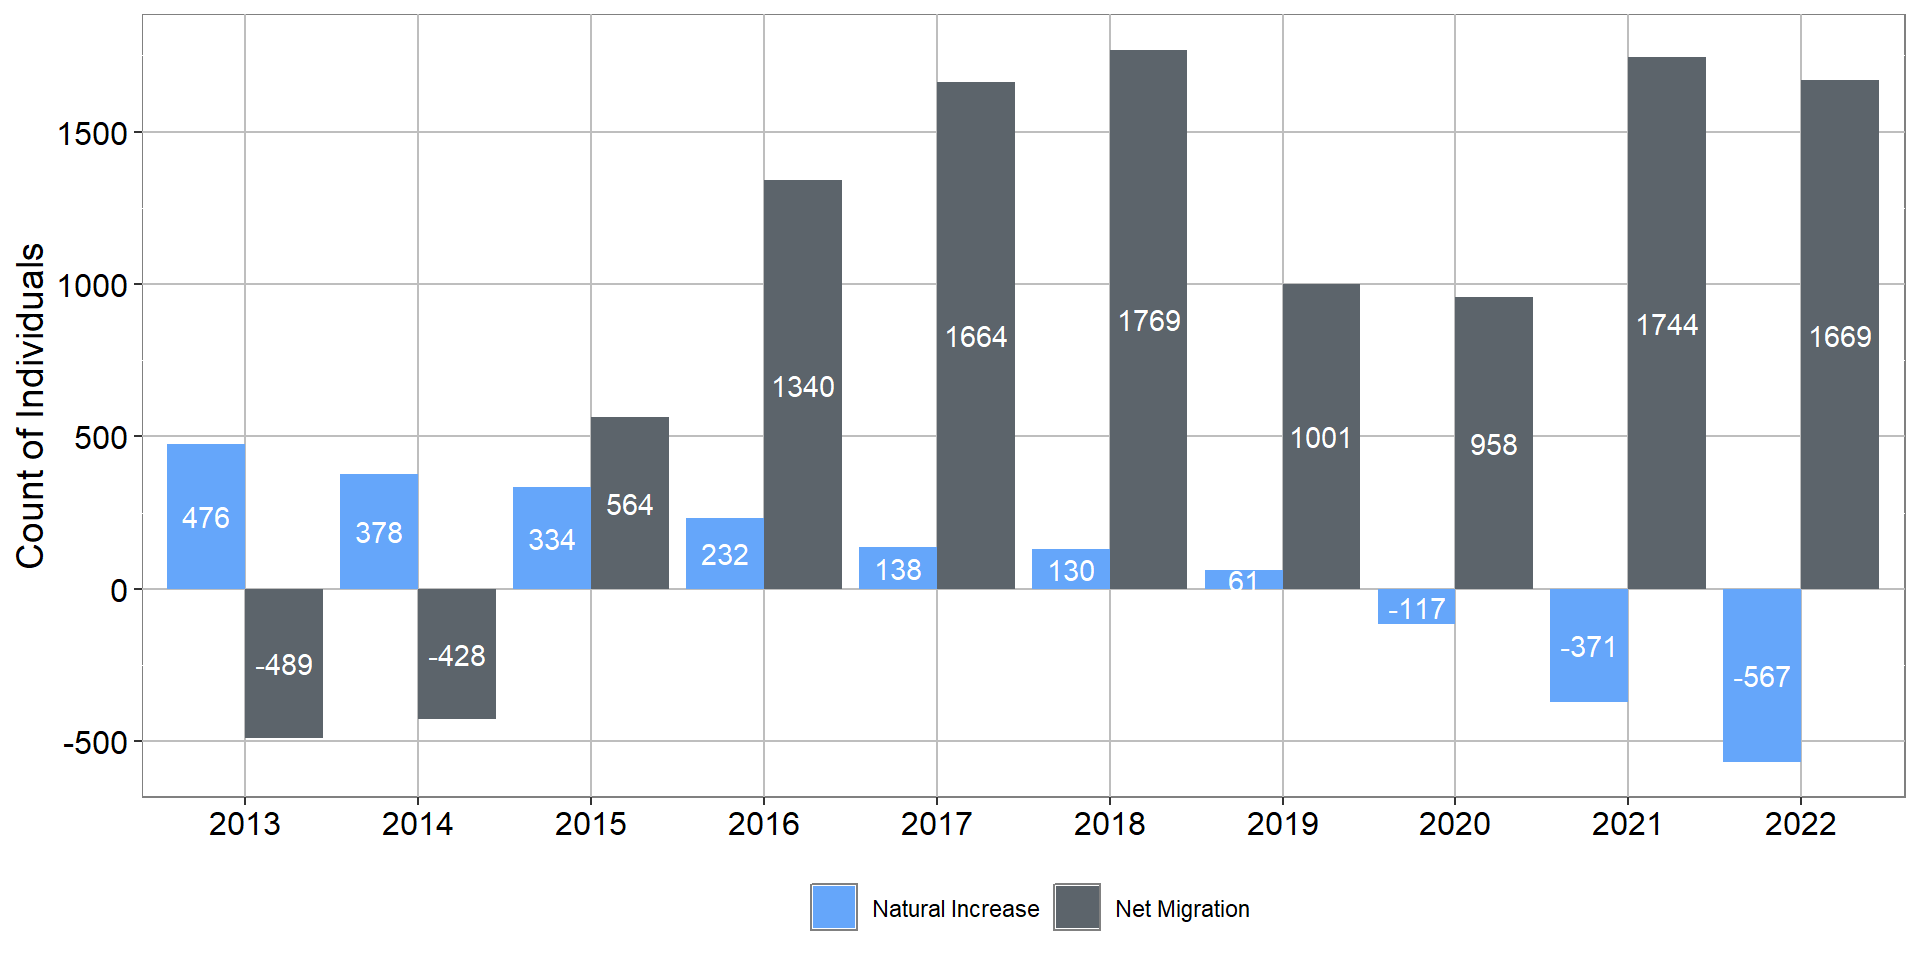
Population growth consists of both natural increase and net migration. Natural increase is the number of births minus deaths, and net migration is the number of people moving in minus those moving out.
Over the last decade, natural increase has been trending downward as both annual births have decreased and annual deaths have increased. With natural increase dropping, net migration has accounted for an increasing share of population growth. In recent years, net migration has accounted for the entirety of population growth in Mesa County, without which the county population would be shrinking.
NATURAL INCREASE AND NET MIGRATION, Mesa County
NATURAL INCREASE AND NET MIGRATION, Mesa County
| 2013 | 2014 | 2015 | 2016 | 2017 | 2018 | 2019 | 2020 | 2021 | 2022 | |
|---|---|---|---|---|---|---|---|---|---|---|
| Natural Increase | 476 | 378 | 334 | 232 | 138 | 130 | 61 | -117 | -371 | -567 |
| Net Migration | -489 | -428 | 564 | 1340 | 1664 | 1769 | 1001 | 958 | 1744 | 1669 |
Source: Colorado Department of Local Affairs, State Demography Office Vintage 2023
Though the county has had consistently higher inward migration since about 2015, there has not been a corresponding increase in annual births. The two primary factors contributing to these trends are:
- A heavy prevalence of older adults moving to the county and
- A statewide increase in access to birth control.
From 2010 to 2020, the age distribution of those moving to Mesa County has heavily consisted of older adults beyond child-bearing years. This trend is significantly different from the statewide distribution.
Net Migration by Age Group From 2010 to 2020, Contribution to population increase
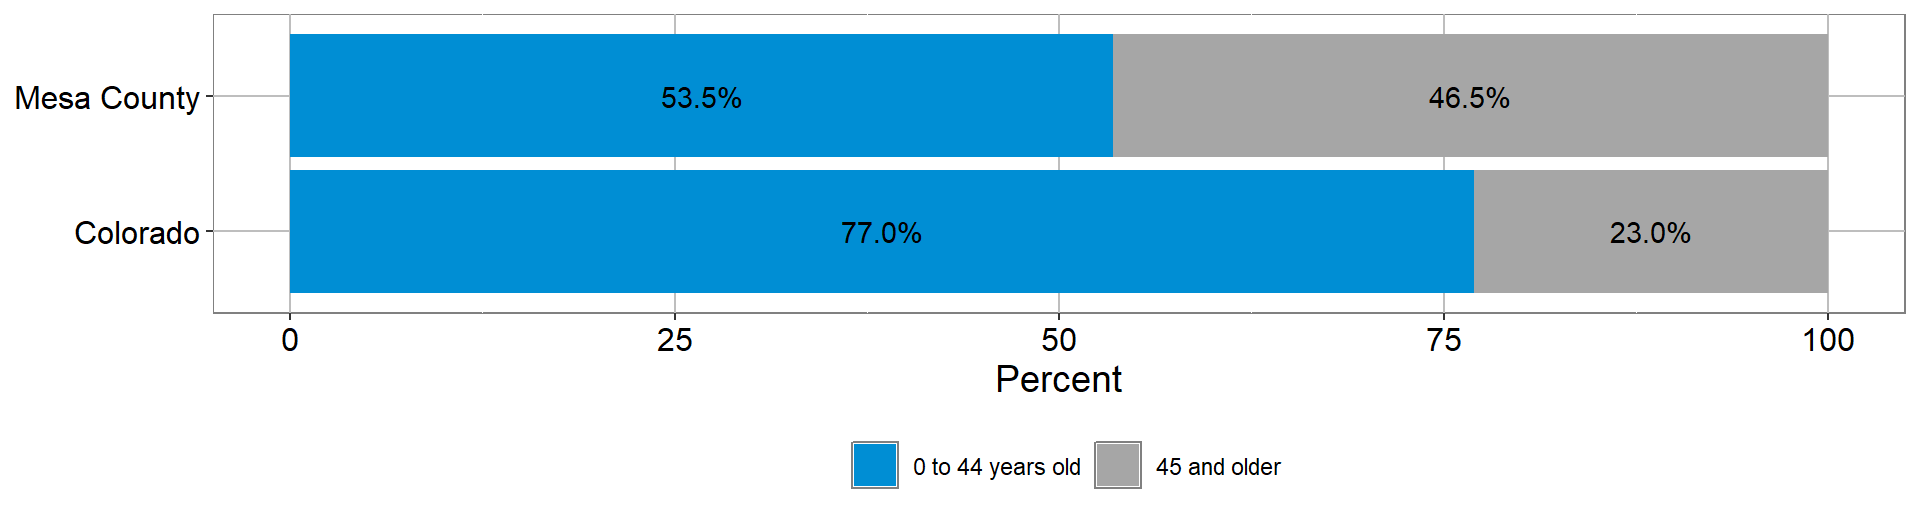
Net Migration by Age Group From 2010 to 2020, Contribution to population increase
| Region | 0 to 44 years old | 45 and older |
|---|---|---|
| Colorado | 77.0% | 23.0% |
| Mesa County | 53.5% | 46.5% |
Source: Colorado Department of Local Affairs, State Demography Office Vintage 2023
The annual birth count has been decreasing since about 2008, the same year the state began expanding access to long-acting reversible contraception (LARC). Across the state, this has had a profound impact on decreasing the number of unintended pregnancies, and this impact has been equally significant in Mesa County.
The impact to the birth rate has been primarily concentrated among young women with low income. From 2008 to 2022, births among women under 25 with less than $35,000 in annual household income dropped by over half, compared to only a 12% decrease among all other women.
Alongside the decreasing number of annual births, the death count in Mesa County has been steadily increasing since about 2015. This increase likely has been impacted by the influx of older adults moving to the area. From 2020 to 2022, the death rate was notably higher than previous years, likely related to the impact of the COVID-19 pandemic.
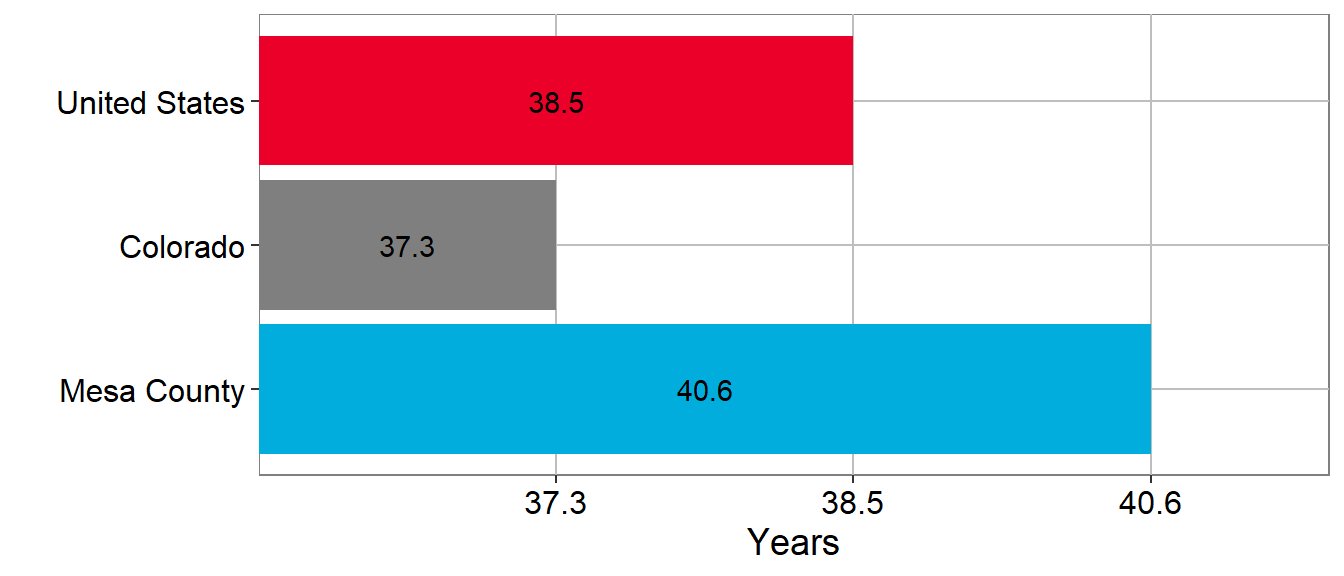
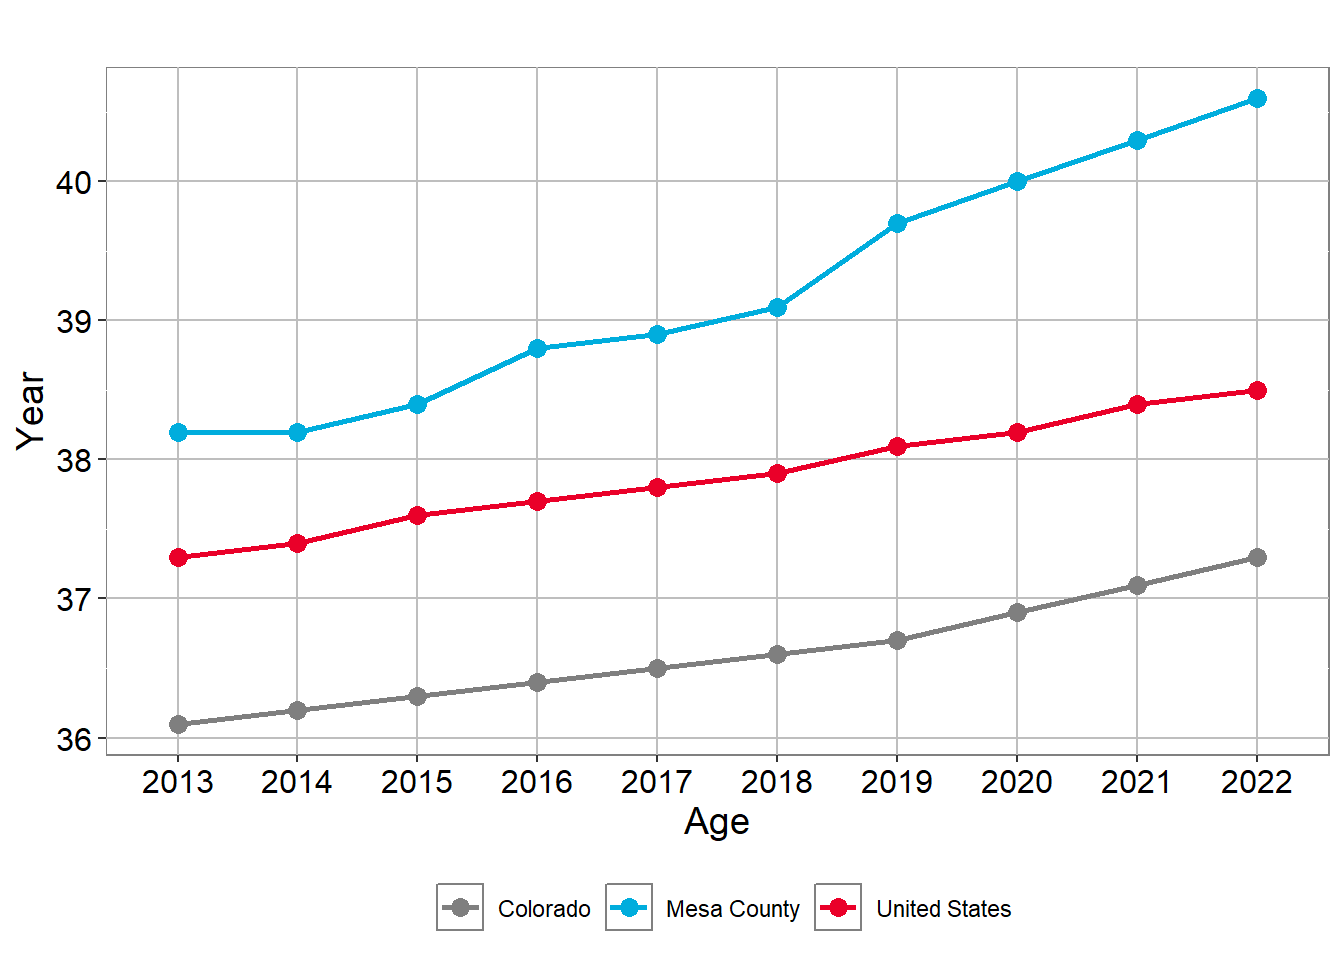
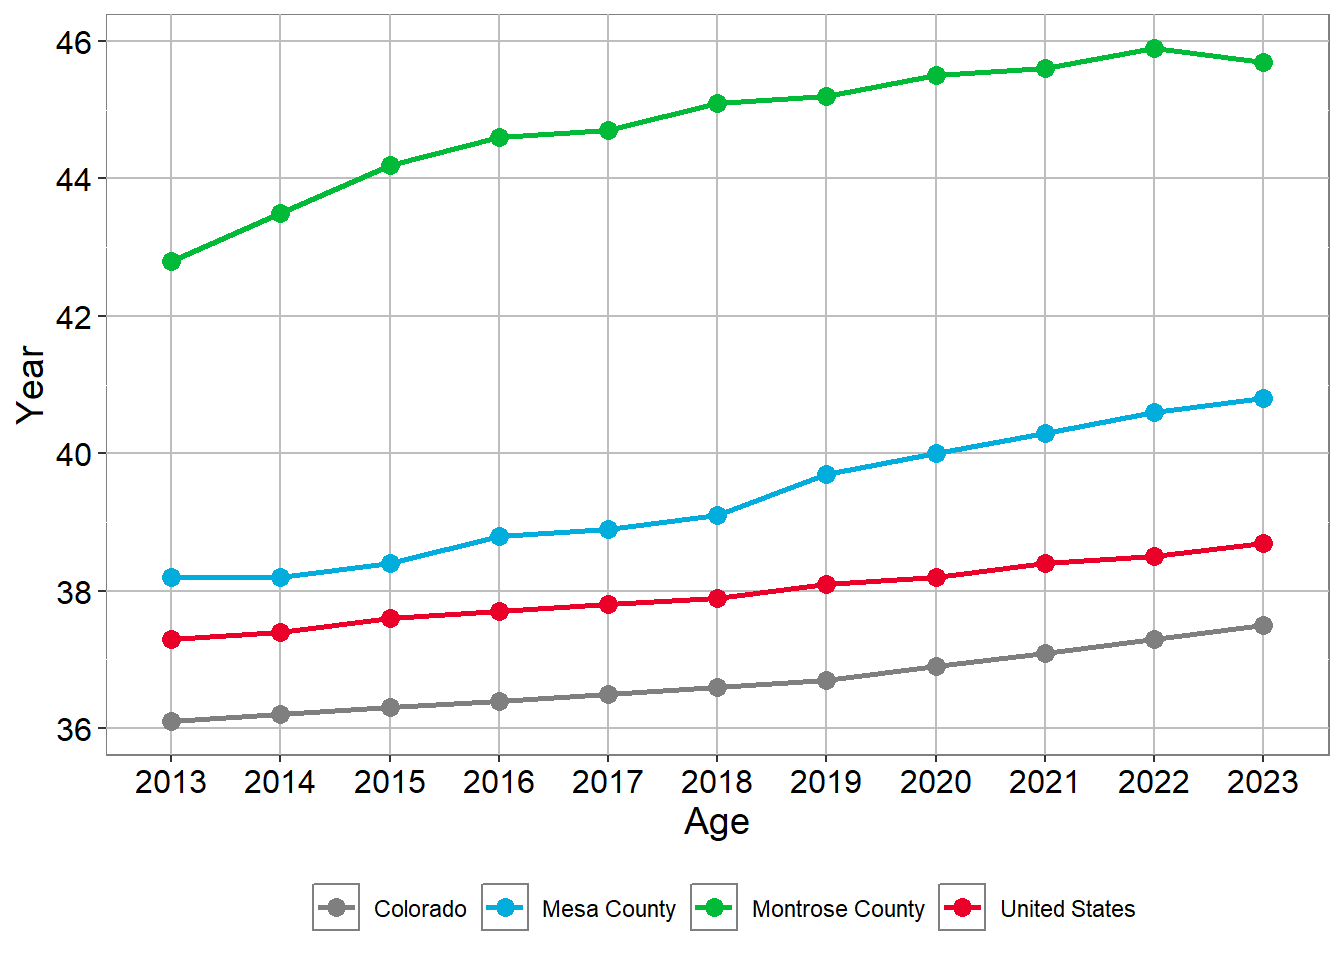
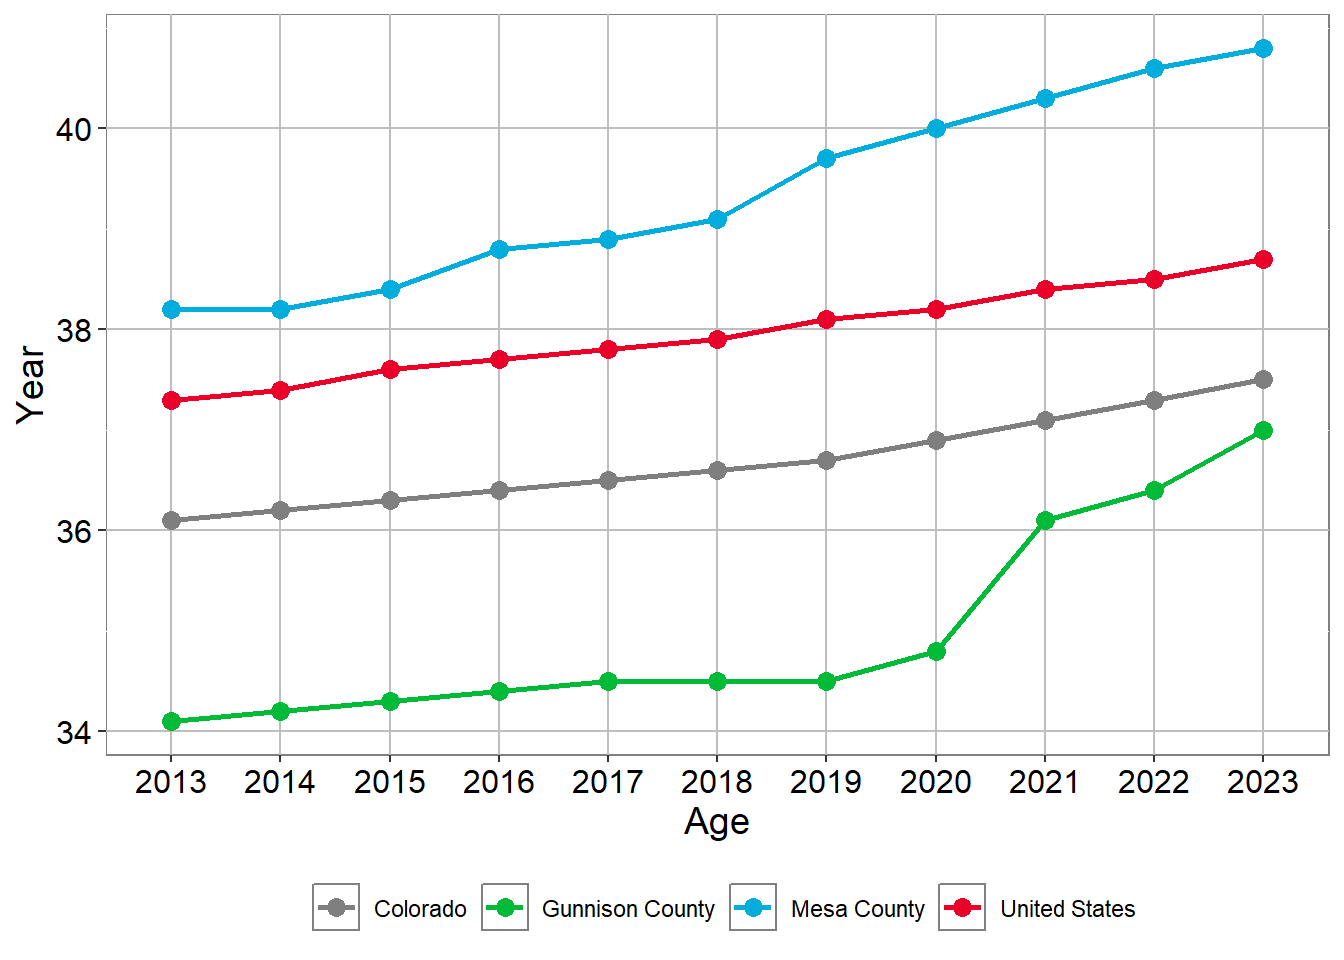
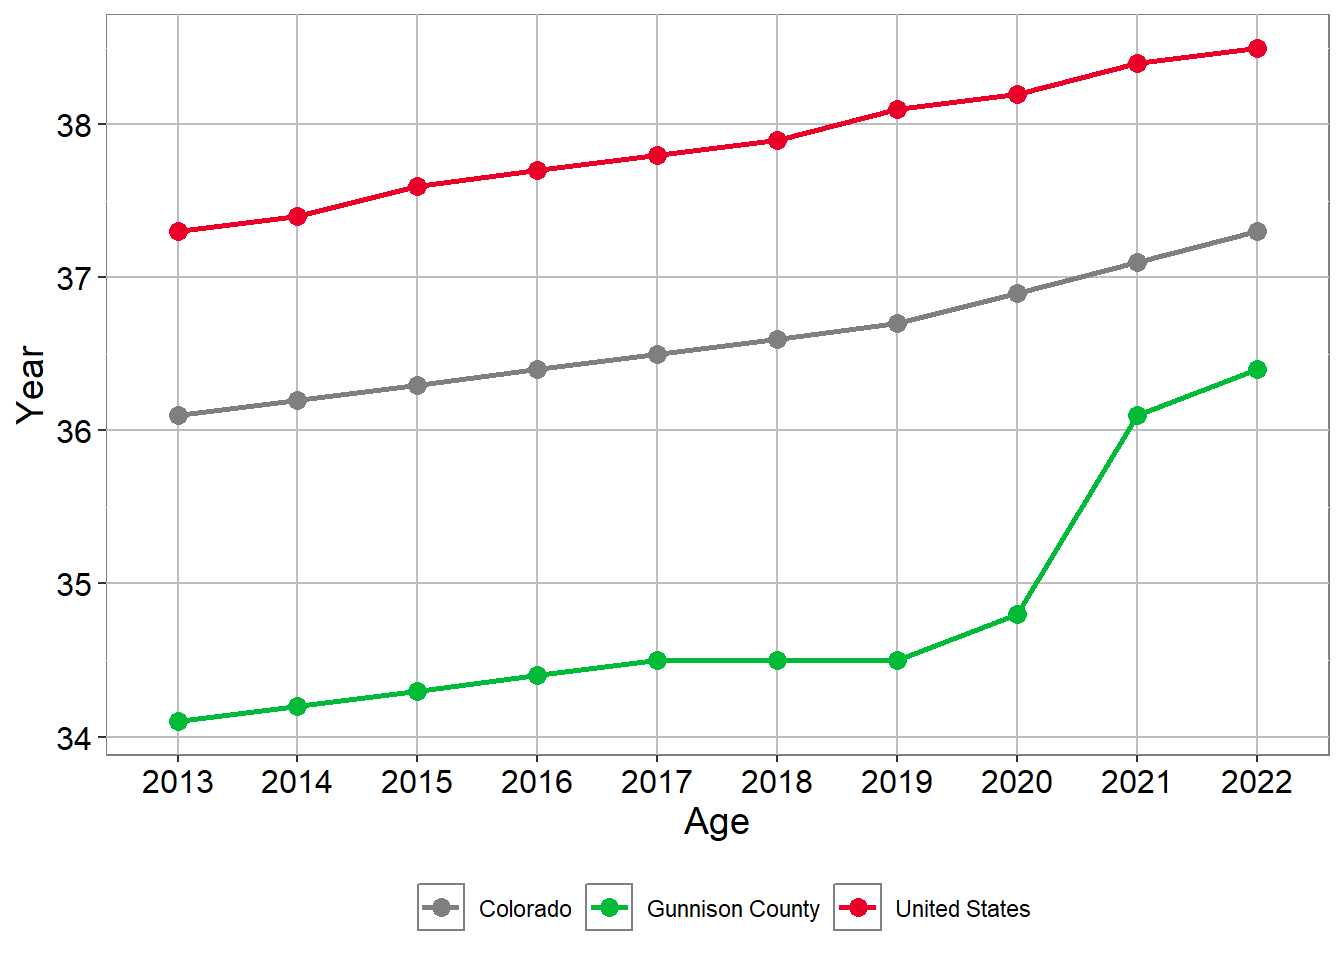
Median Age
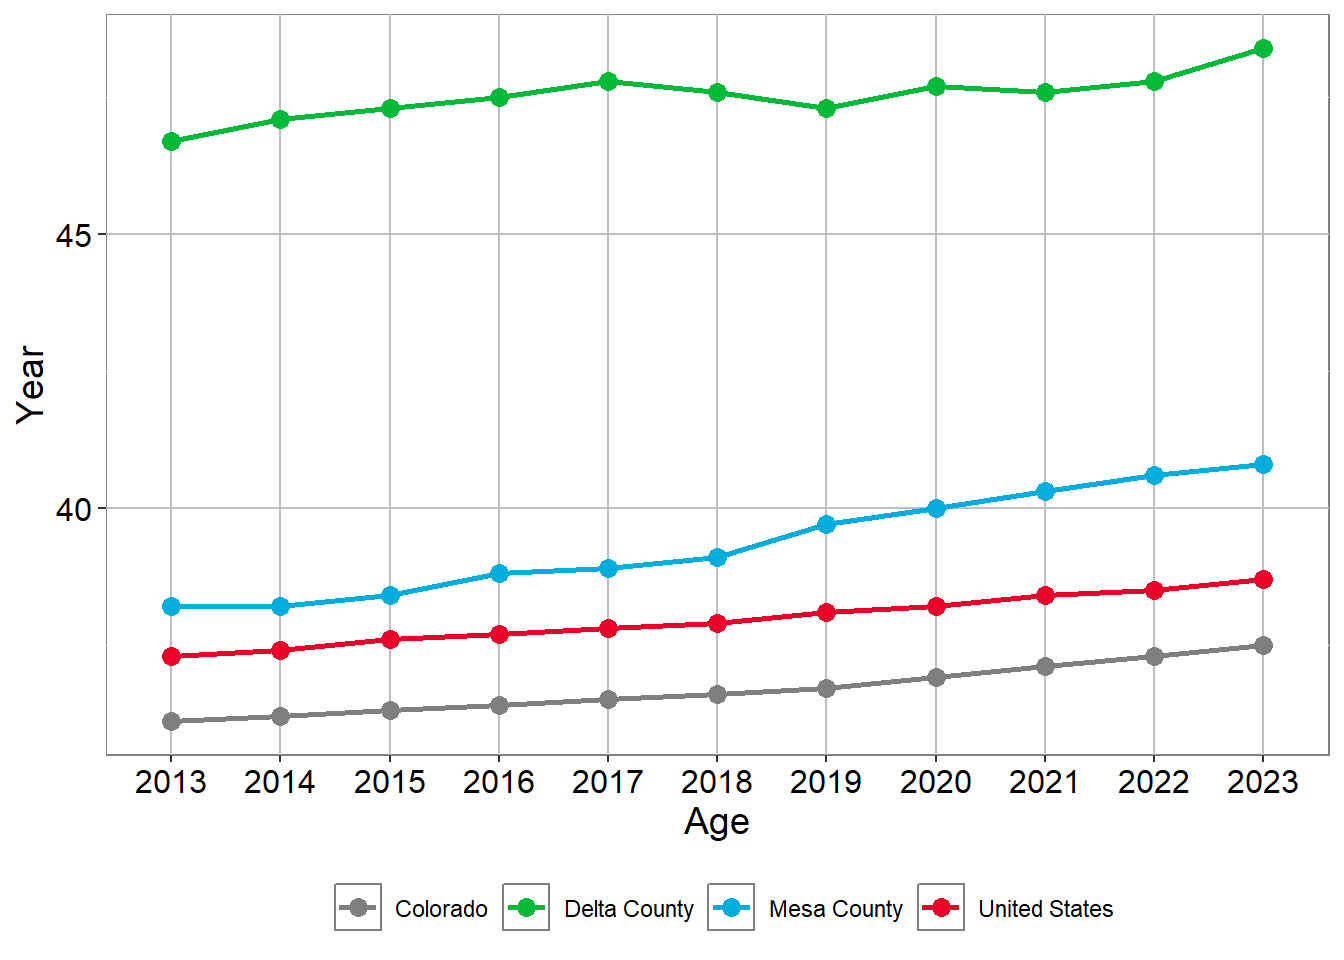
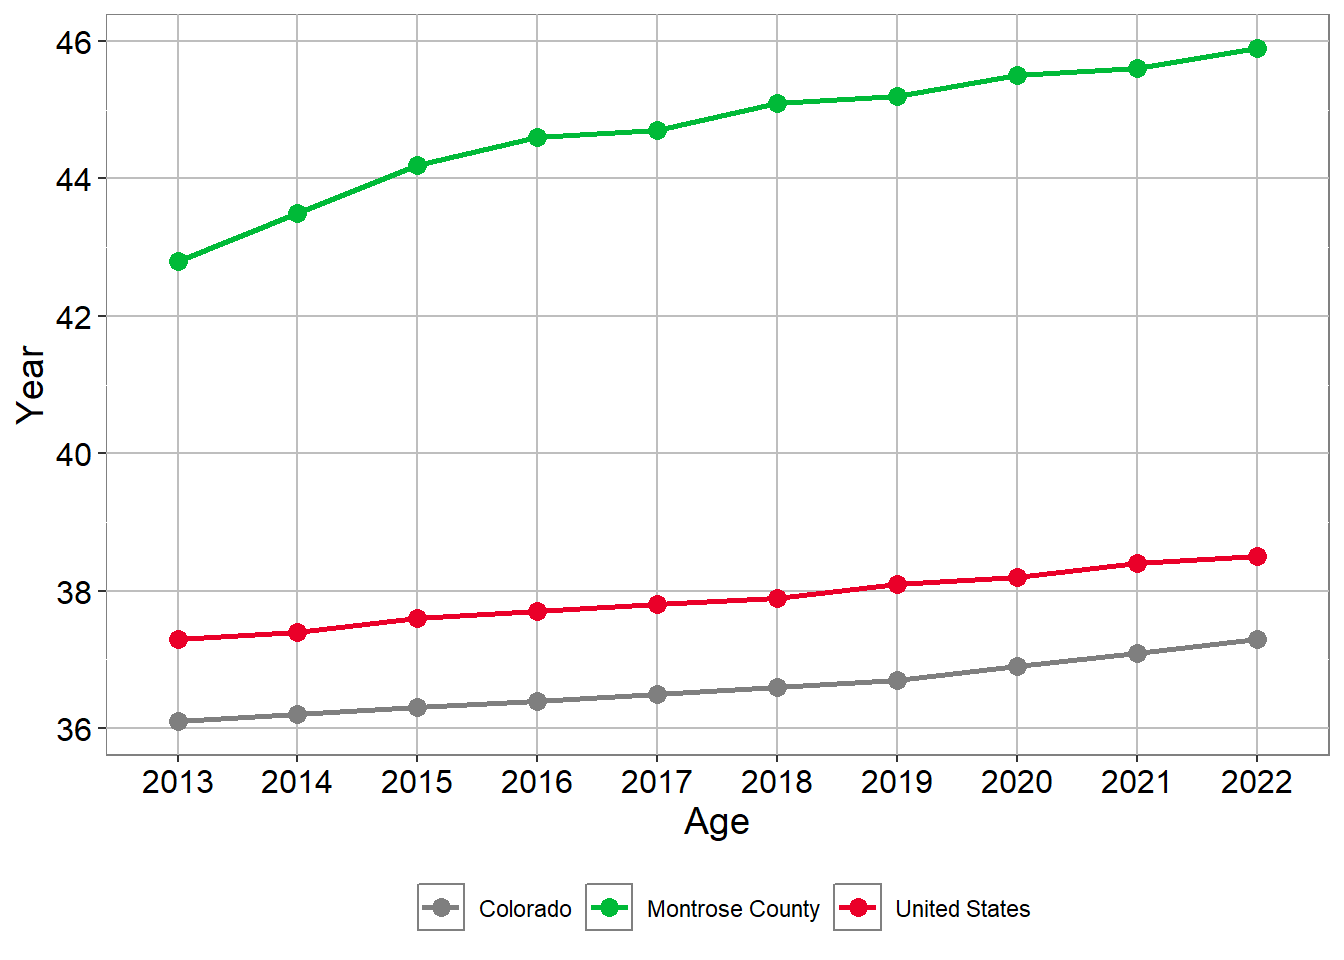
Mesa County has an aging population. The median age has been steadily increasing over the past decade, which is usually a result of longer life expectancies and lower birth rates. In Mesa County, this is also affected by the inward migration of older adults.
Median age is increasing both statewide and nationally, but it is increasing at a faster rate in Mesa County.
Median Age
Median Age
Median Age
| Region | 2013 | 2014 | 2015 | 2016 | 2017 | 2018 | 2019 | 2020 | 2021 | 2022 | 2023 |
|---|---|---|---|---|---|---|---|---|---|---|---|
| Colorado | 36.1 | 36.2 | 36.3 | 36.4 | 36.5 | 36.6 | 36.7 | 36.9 | 37.1 | 37.3 | 37.5 |
| Mesa County | 38.2 | 38.2 | 38.4 | 38.8 | 38.9 | 39.1 | 39.7 | 40.0 | 40.3 | 40.6 | 40.8 |
| United States | 37.3 | 37.4 | 37.6 | 37.7 | 37.8 | 37.9 | 38.1 | 38.2 | 38.4 | 38.5 | 38.7 |
Source: U.S. Census Bureau, American Community Survey 5-year estimates, Table: B01002; MEDIAN AGE BY SEX 2023
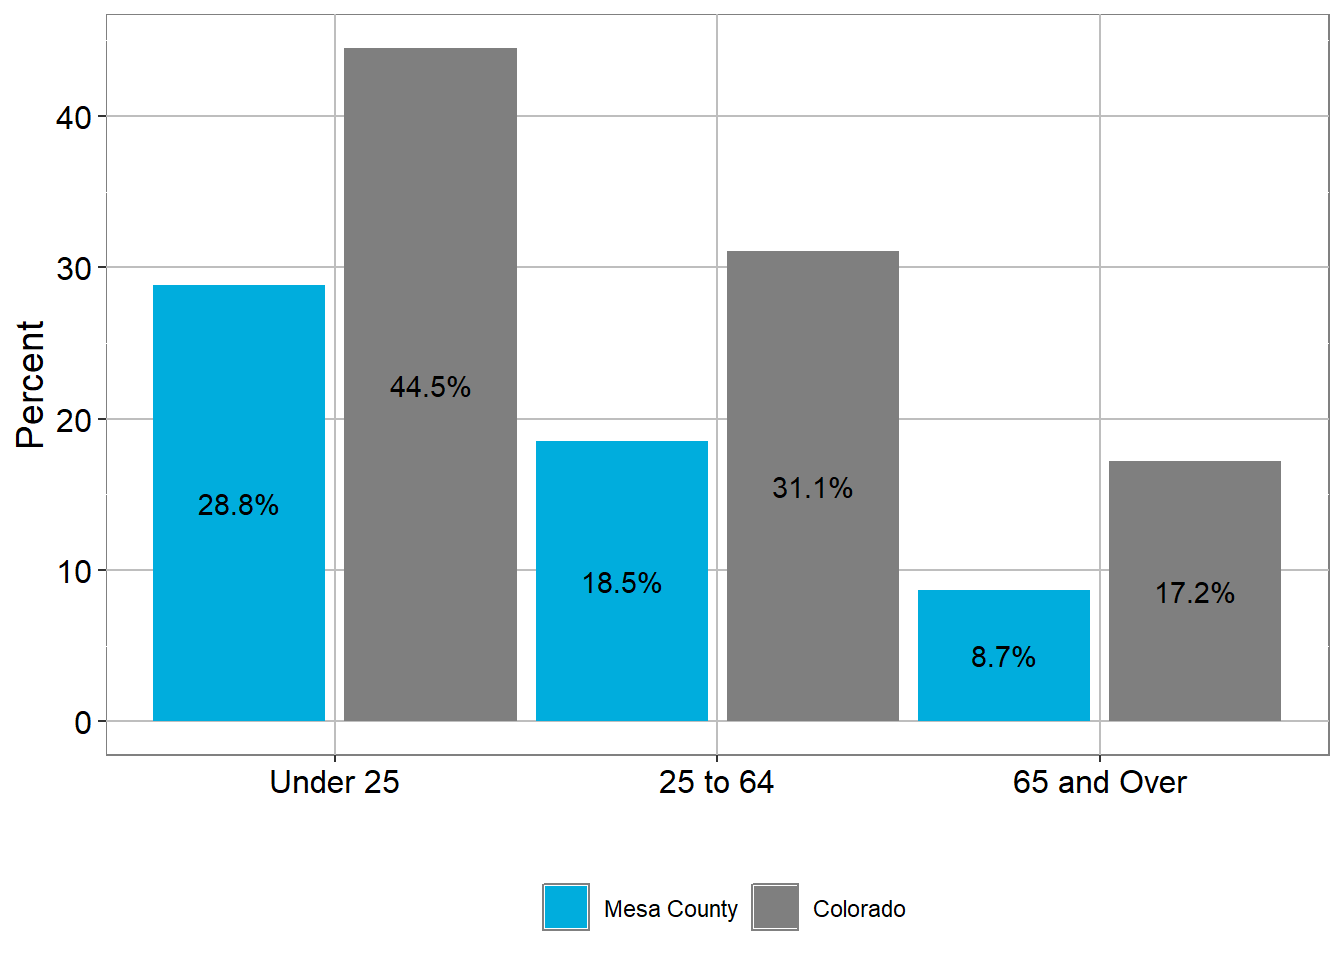
As the median age increases, older adults are making up a larger share of the population. As this trend continues, a greater number of adults will likely retire out of the workforce than new workers will enter the workforce to replace them. This shift in the age distribution will have lasting implications for the community in a variety of sectors including:
- housing,
- the local economy,
- education, and
- older adults care services.
SHARE OF THE POPULATION BY AGE GROUP, MESA COUNTY
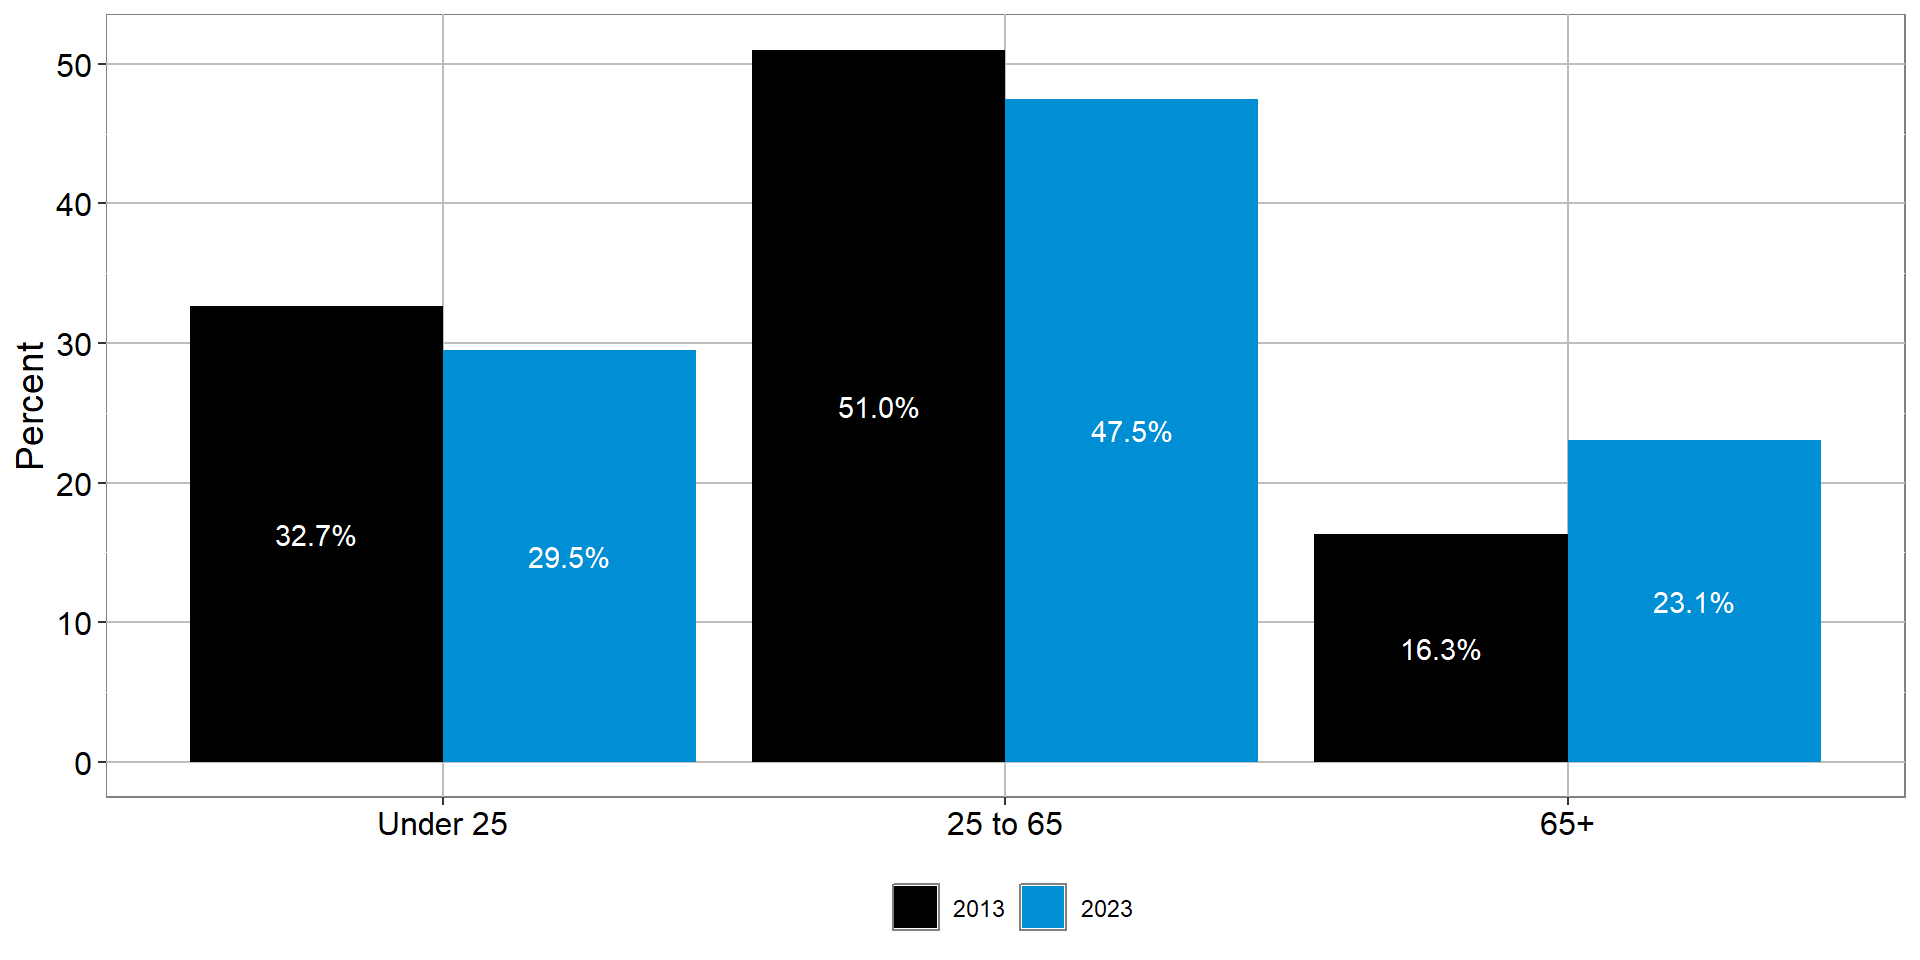
SHARE OF THE POPULATION BY AGE GROUP, MESA COUNTY
| Year | 25 to 65 | 65+ | Under 25 |
|---|---|---|---|
| 2013 | 51.0% | 16.3% | 32.7% |
| 2023 | 47.5% | 23.1% | 29.5% |
Source: U.S. Census Bureau, American Community Survey 5-year estimates, Table: B01002; MEDIAN AGE BY SEX 2013 and 2023
Race and Ethnicity
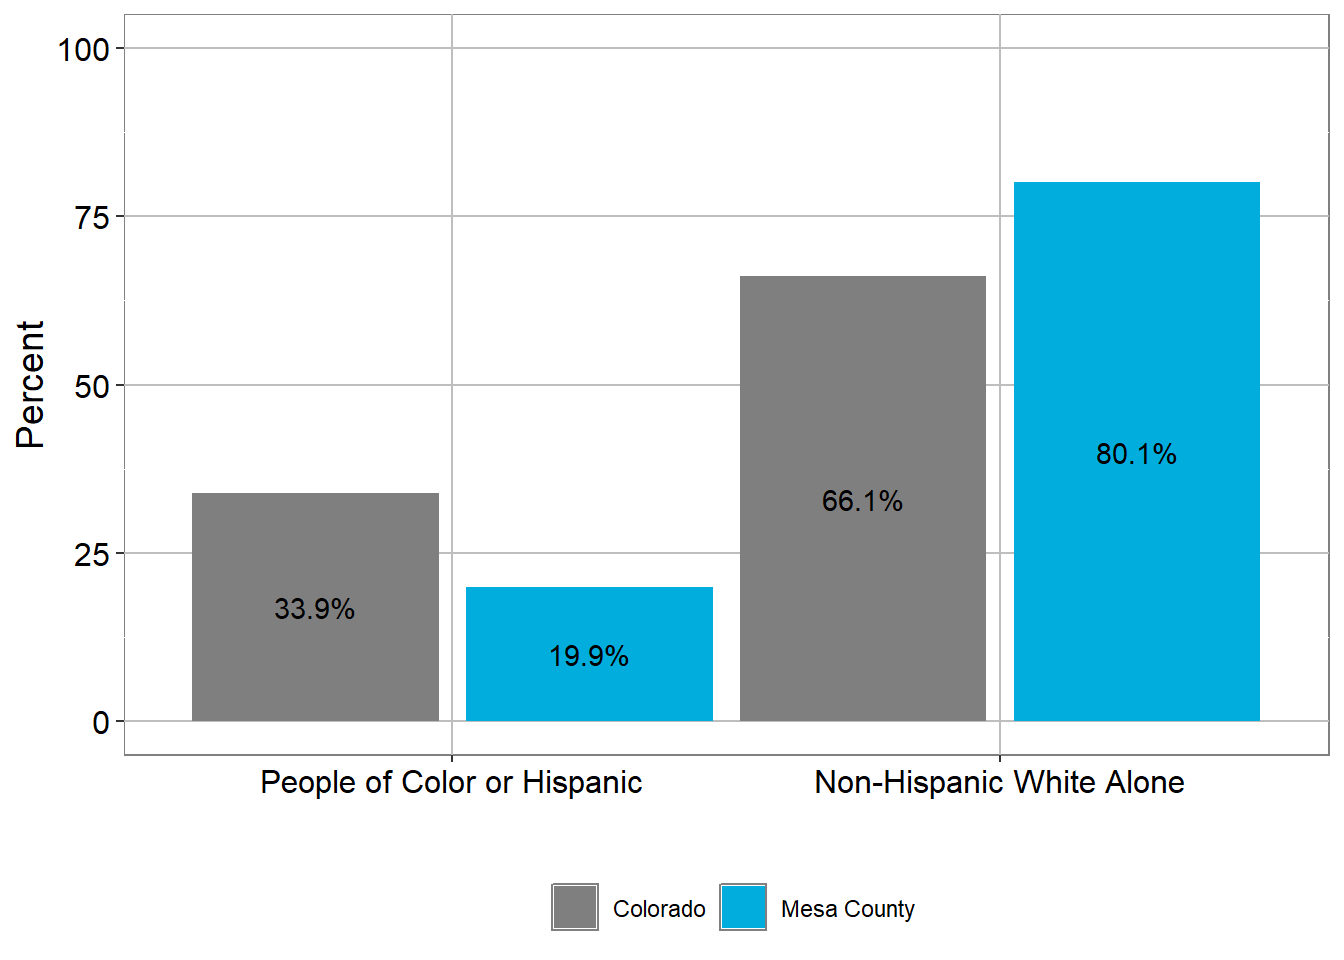
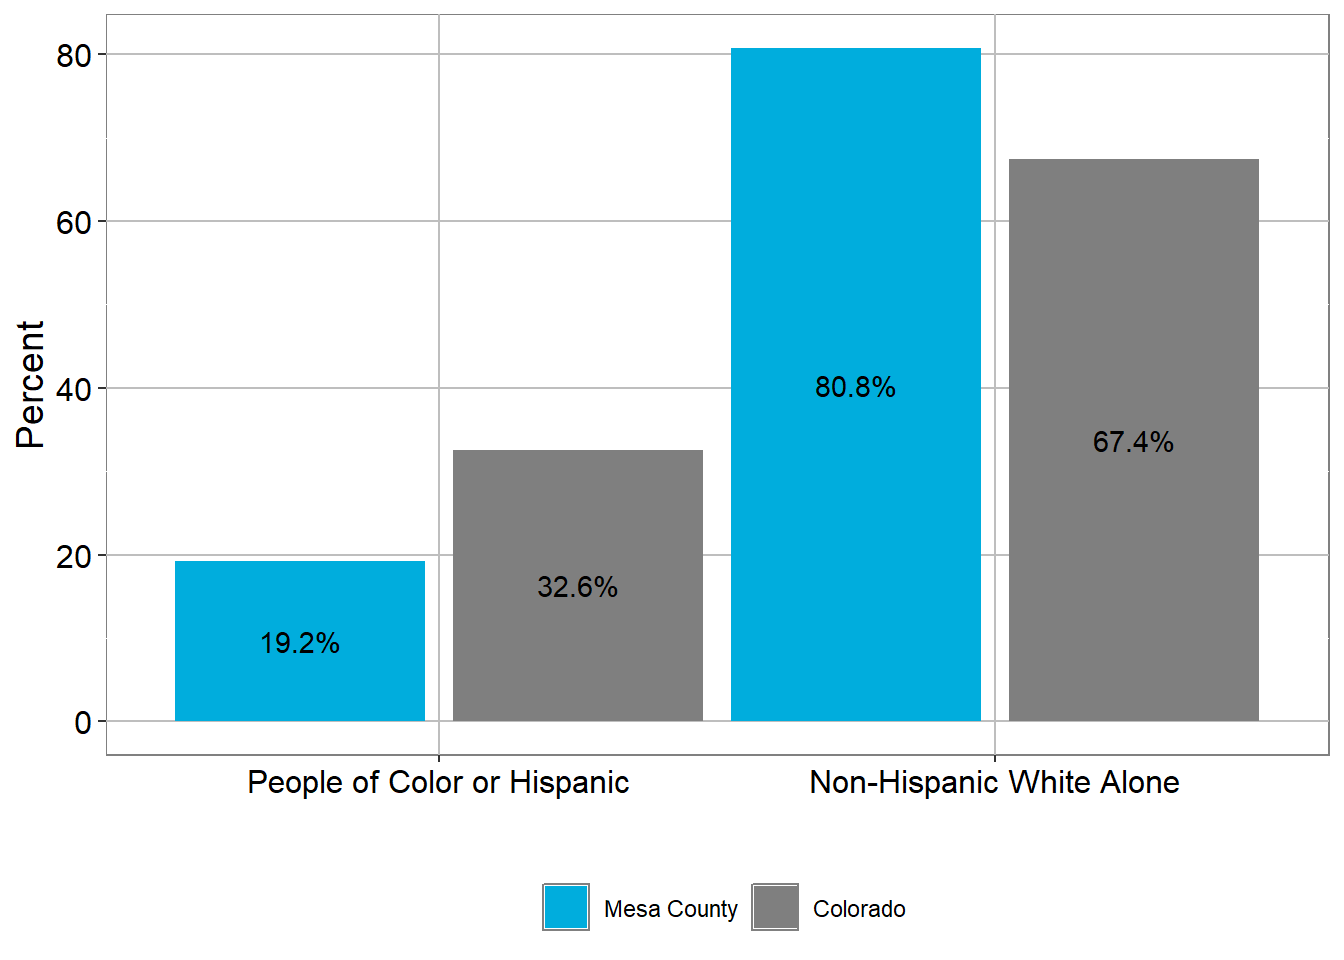
The majority of people in Mesa County identify as non-Hispanic white, 80% in 2022. The next most prevalent group are those identifying as Hispanic or Latino of any race, 15% in 2022. The additional 5% includes people from a variety of race categories.
For the purposes of statistical trends and actionable insights, this report includes insights on “People of Color,” a composite group including both Hispanic or Latino people of any race and non-Hispanic people of color, including but not limited to American Indian or Alaska Native, Asian, Black or African American, and Multiracial people.
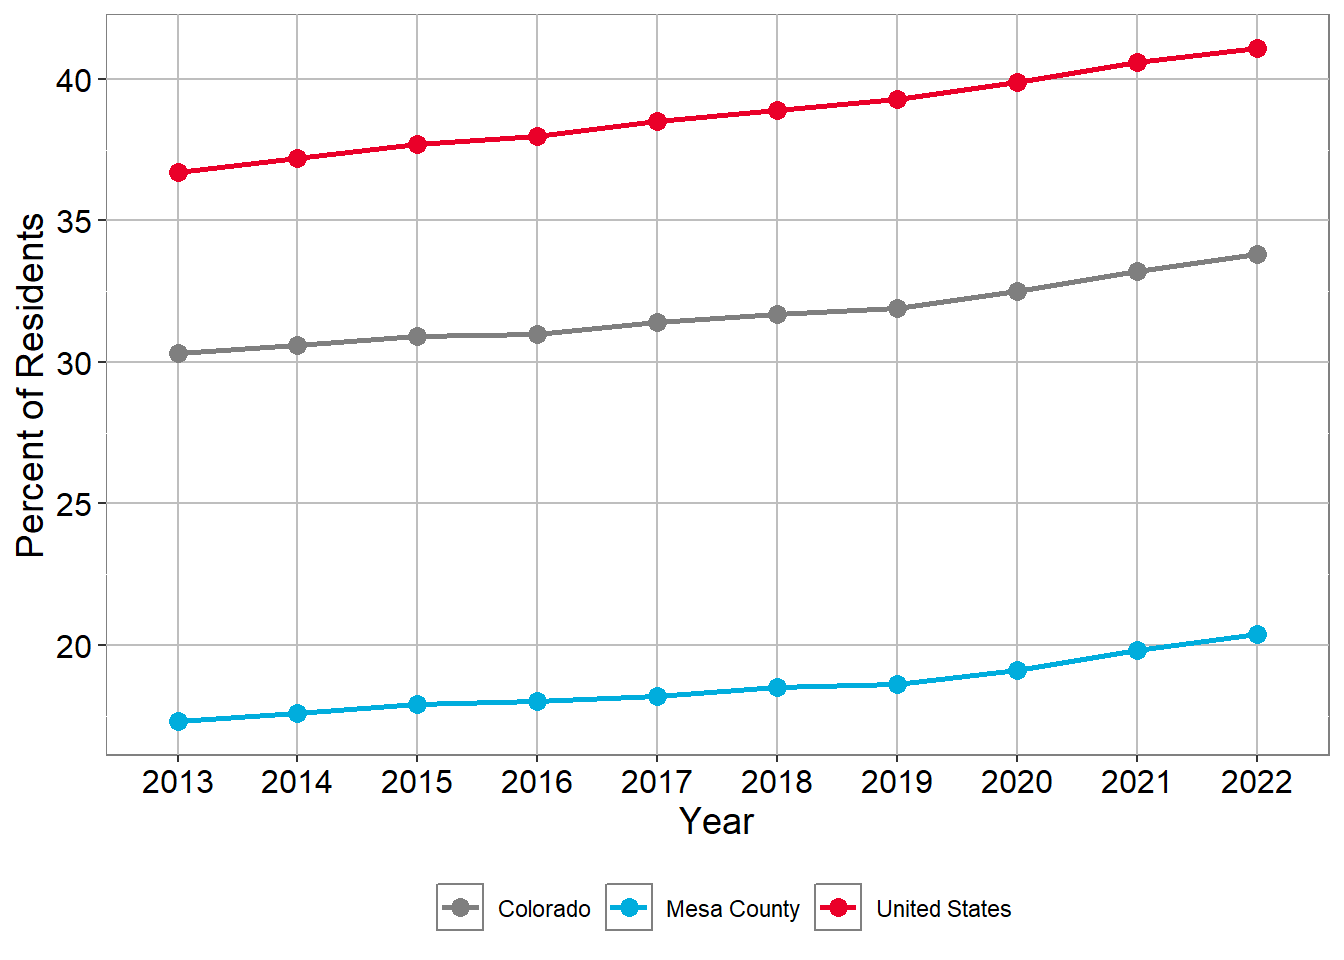
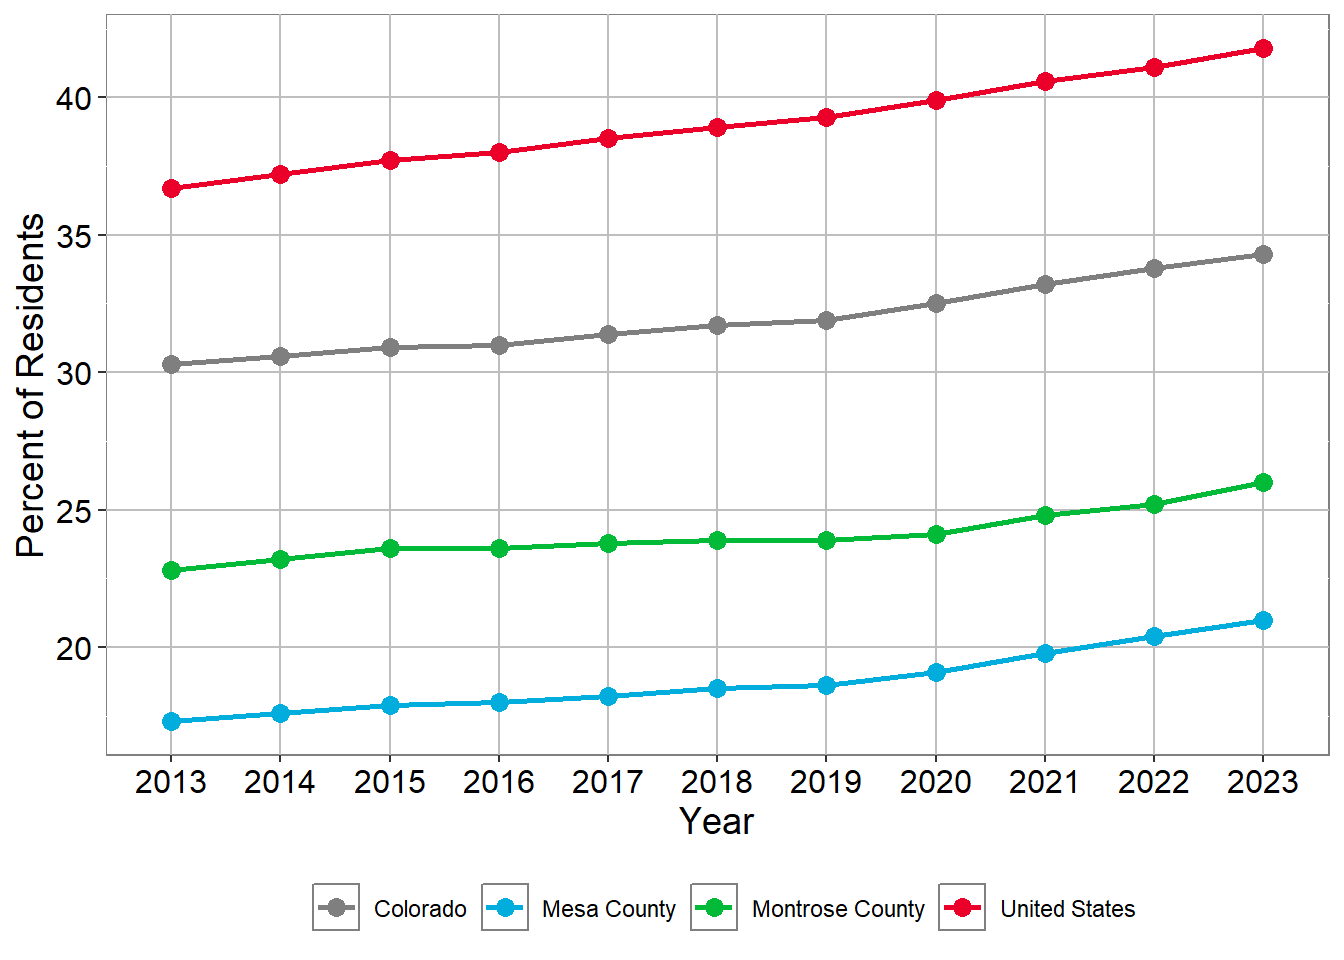
Over the past decade, People of Color have made up a steadily increasing share of the population, from 17% in 2013 to 20% in 2022. This change is being driven primarily by increasing diversity in the younger population. People of Color make up nearly a third of those under age 25, compared to only about 10% among those age 65 and older.
Racial and Ethnic Representation Mesa County
2023
| Race | Non Hispanic | Hispanic |
|---|---|---|
| American Indian and Alaska Native alone | 0.6% | 0.9% |
| Asian alone | 1.0% | 0.1% |
| Black or African American alone | 0.7% | 0.3% |
| Native Hawaiian or Other Pacific Islander alone | 0.1% | 0.0% |
| White alone | 80.1% | 13.5% |
| Two or more | 1.9% | 0.7% |
| Ethnicity | Percent |
|---|---|
| Hispanic | 15.5% |
| Non-Hispanic White Alone | 80.1% |
| People of Color or Hispanic | 19.9% |
| People of color, Non-Hispanic | 4.4% |
Source: Colorado Department of Local Affairs, State Demography Office
Racial and Ethnic Representation Mesa County
2022
| Race | Non Hispanic | Hispanic |
|---|---|---|
| American Indian and Alaska Native alone | 0.6% | 0.9% |
| Asian alone | 1.0% | 0.1% |
| Black or African American alone | 0.7% | 0.3% |
| Native Hawaiian or Other Pacific Islander alone | 0.1% | 0.0% |
| White alone | 80.5% | 13.2% |
| Two or more | 1.8% | 0.7% |
| Ethnicity | Percent |
|---|---|
| Hispanic | 15.3% |
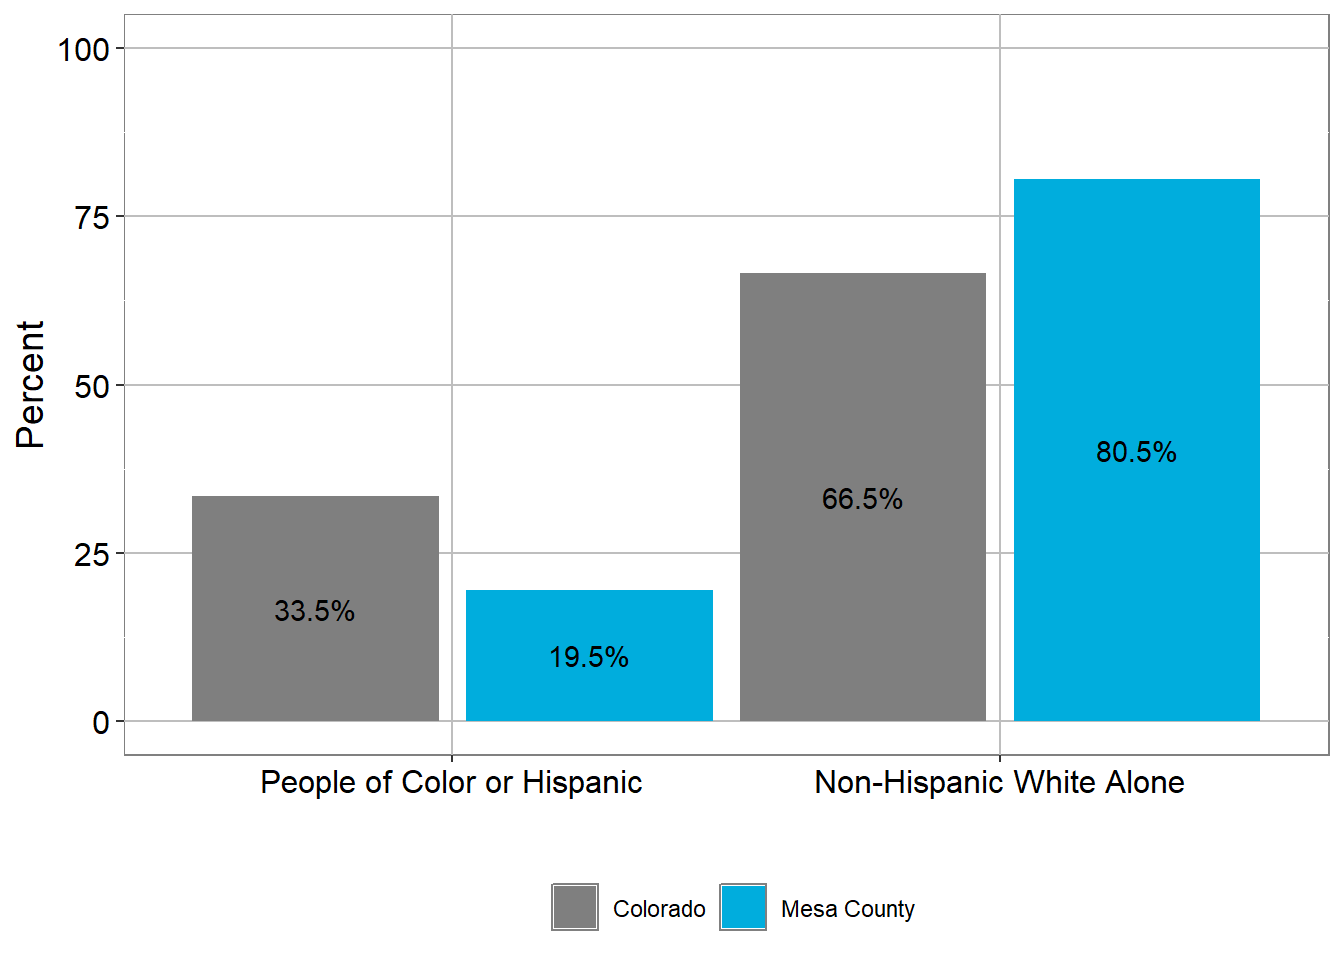
| Non-Hispanic White Alone | 80.5% |
| People of Color or Hispanic | 19.5% |
| People of color, Non-Hispanic | 4.3% |
Source: Colorado Department of Local Affairs, State Demography Office
Racial and Ethnic Representation Mesa County
2021
| Race | Non Hispanic | Hispanic |
|---|---|---|
| American Indian and Alaska Native alone | 0.7% | 0.9% |
| Asian alone | 0.9% | 0.1% |
| Black or African American alone | 0.7% | 0.3% |
| Native Hawaiian or Other Pacific Islander alone | 0.1% | 0.0% |
| White alone | 80.6% | 13.1% |
| Two or more | 1.8% | 0.7% |
| Ethnicity | Percent |
|---|---|
| Hispanic | 15.2% |
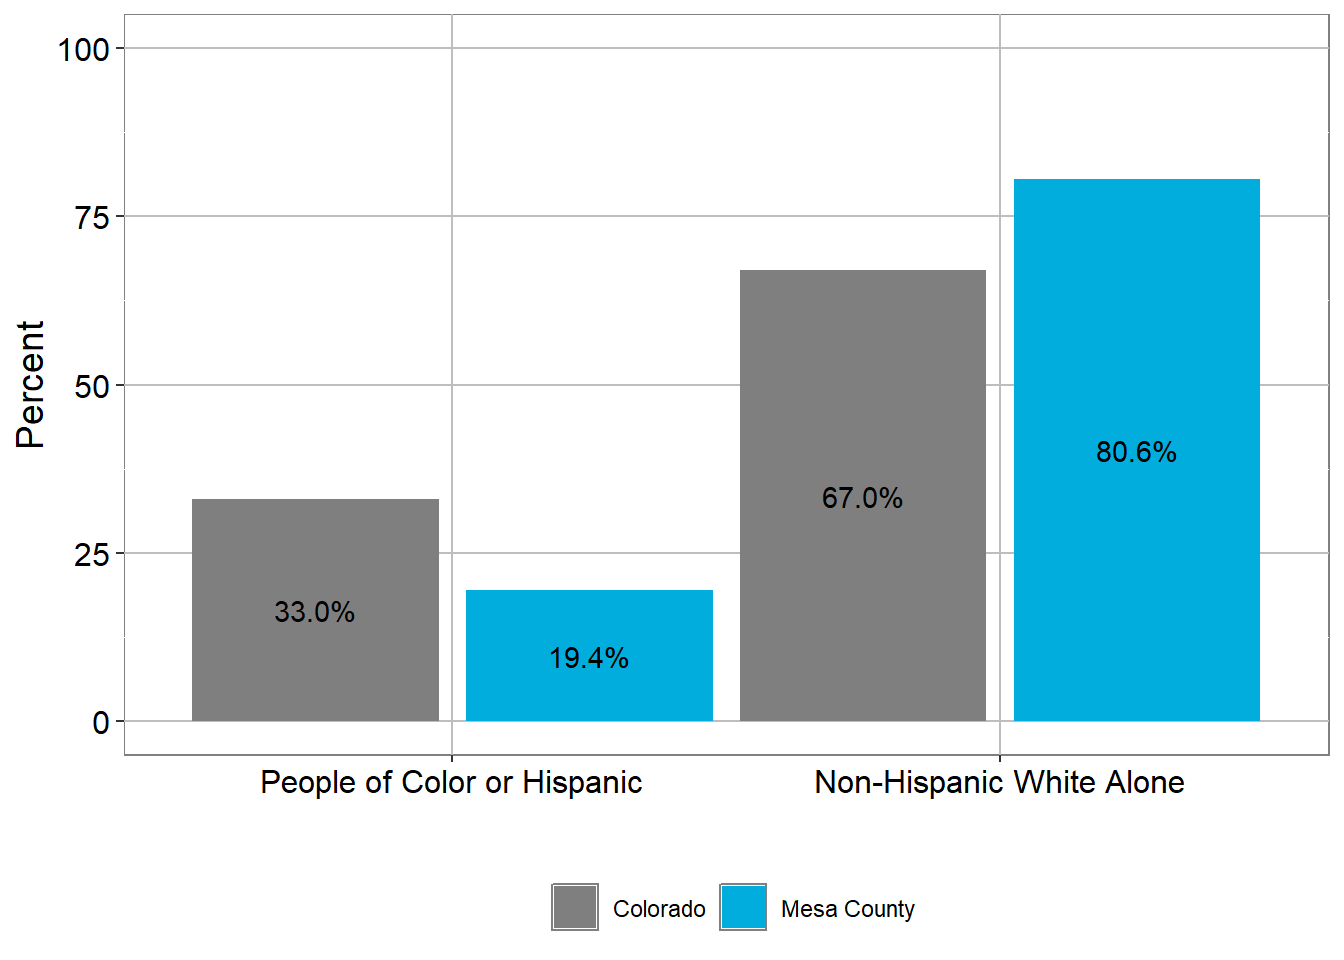
| Non-Hispanic White Alone | 80.6% |
| People of Color or Hispanic | 19.4% |
| People of color, Non-Hispanic | 4.3% |
Source: Colorado Department of Local Affairs, State Demography Office
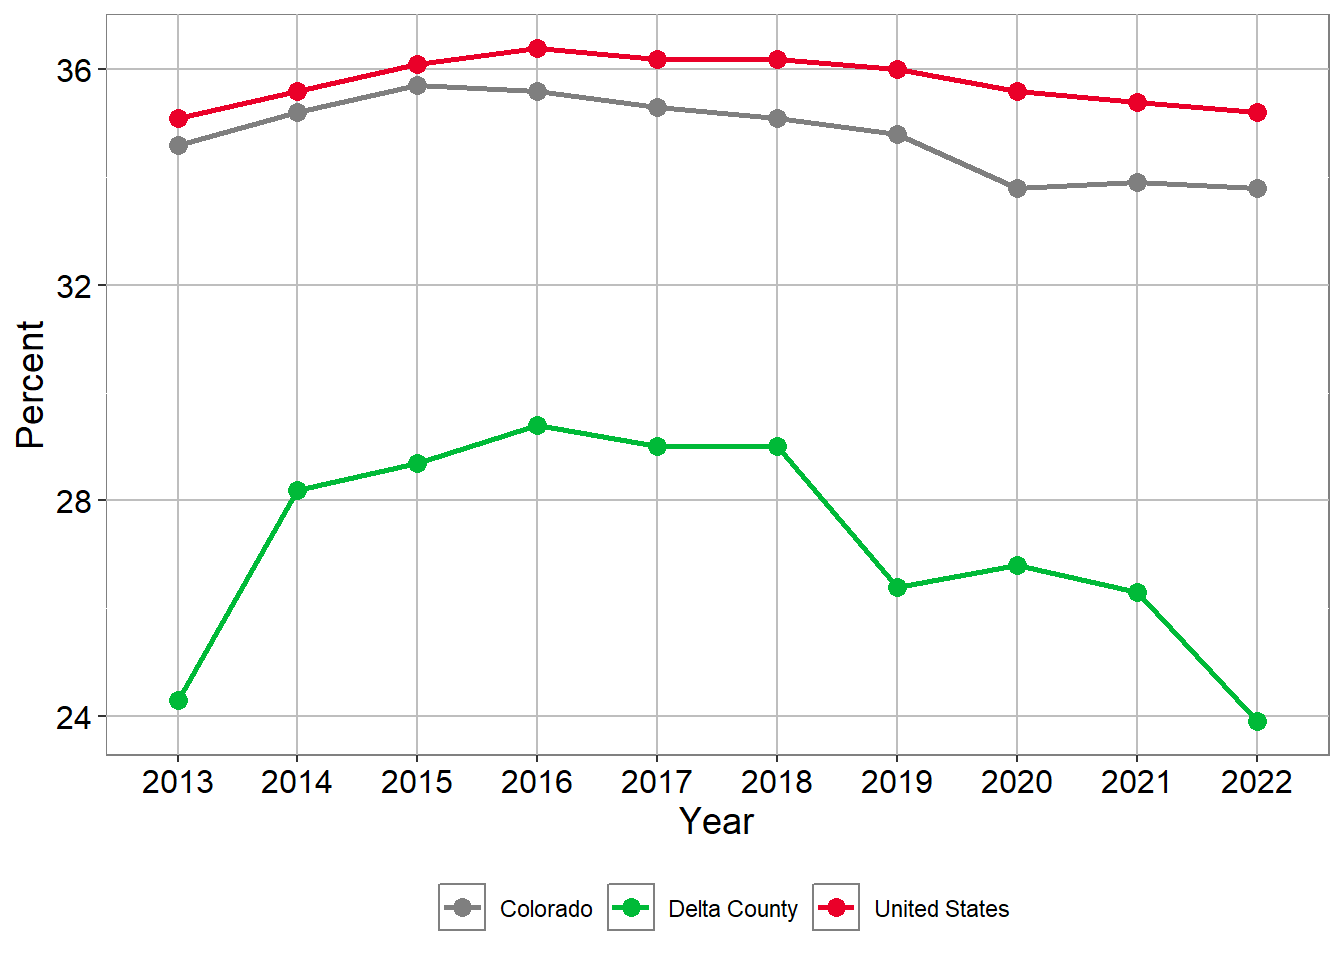
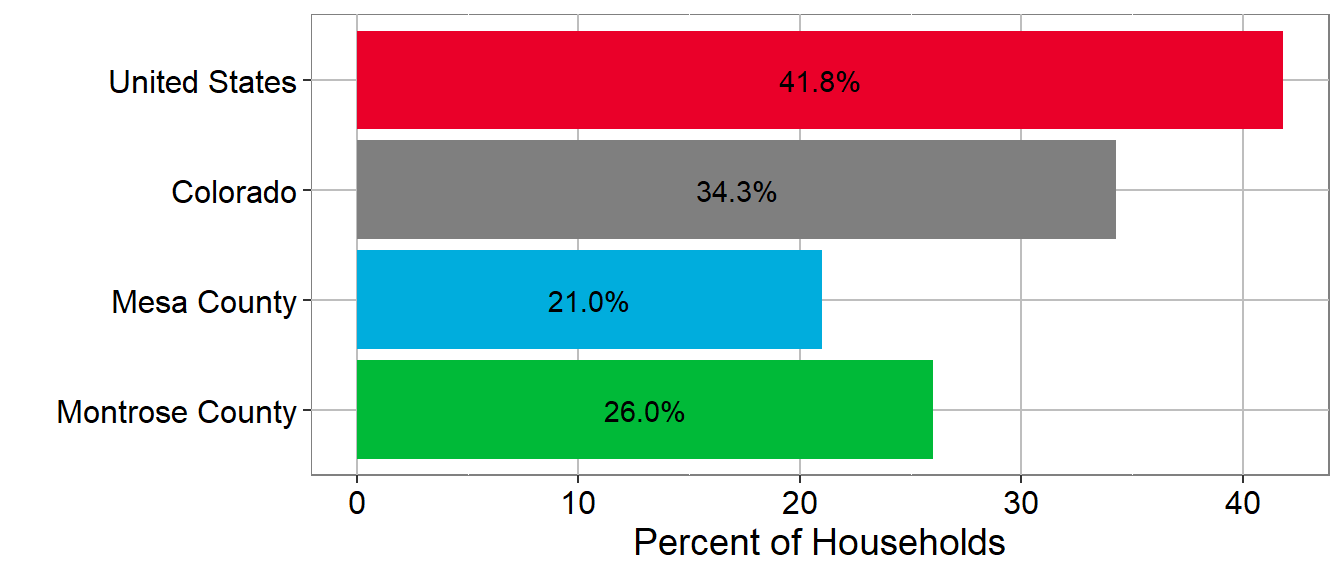
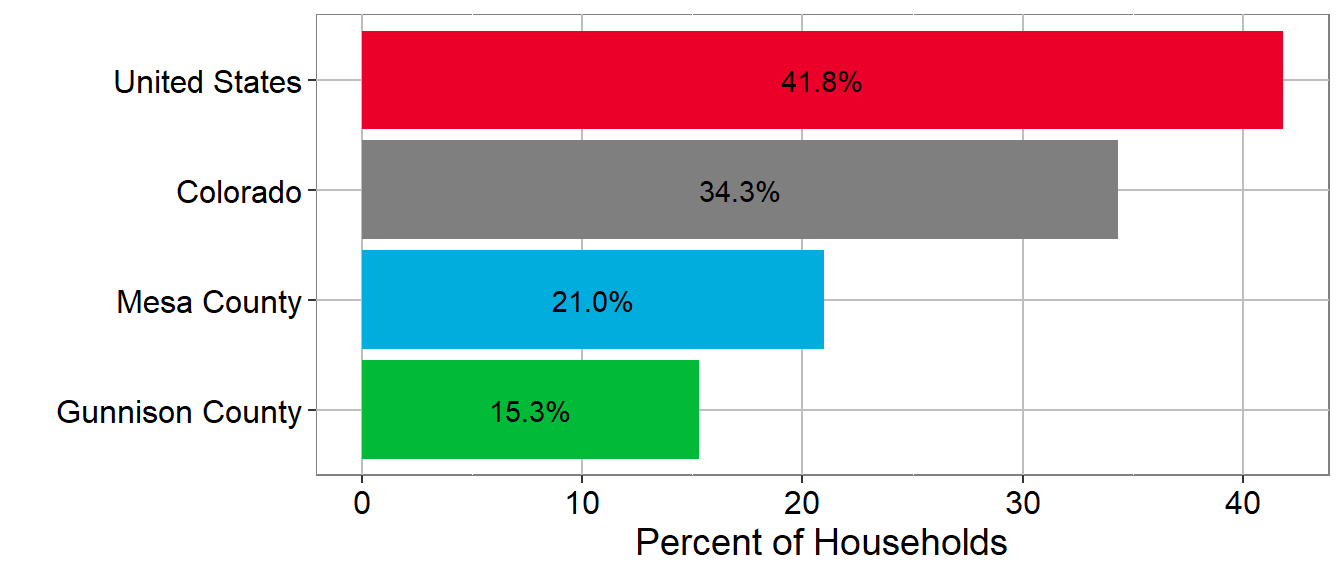
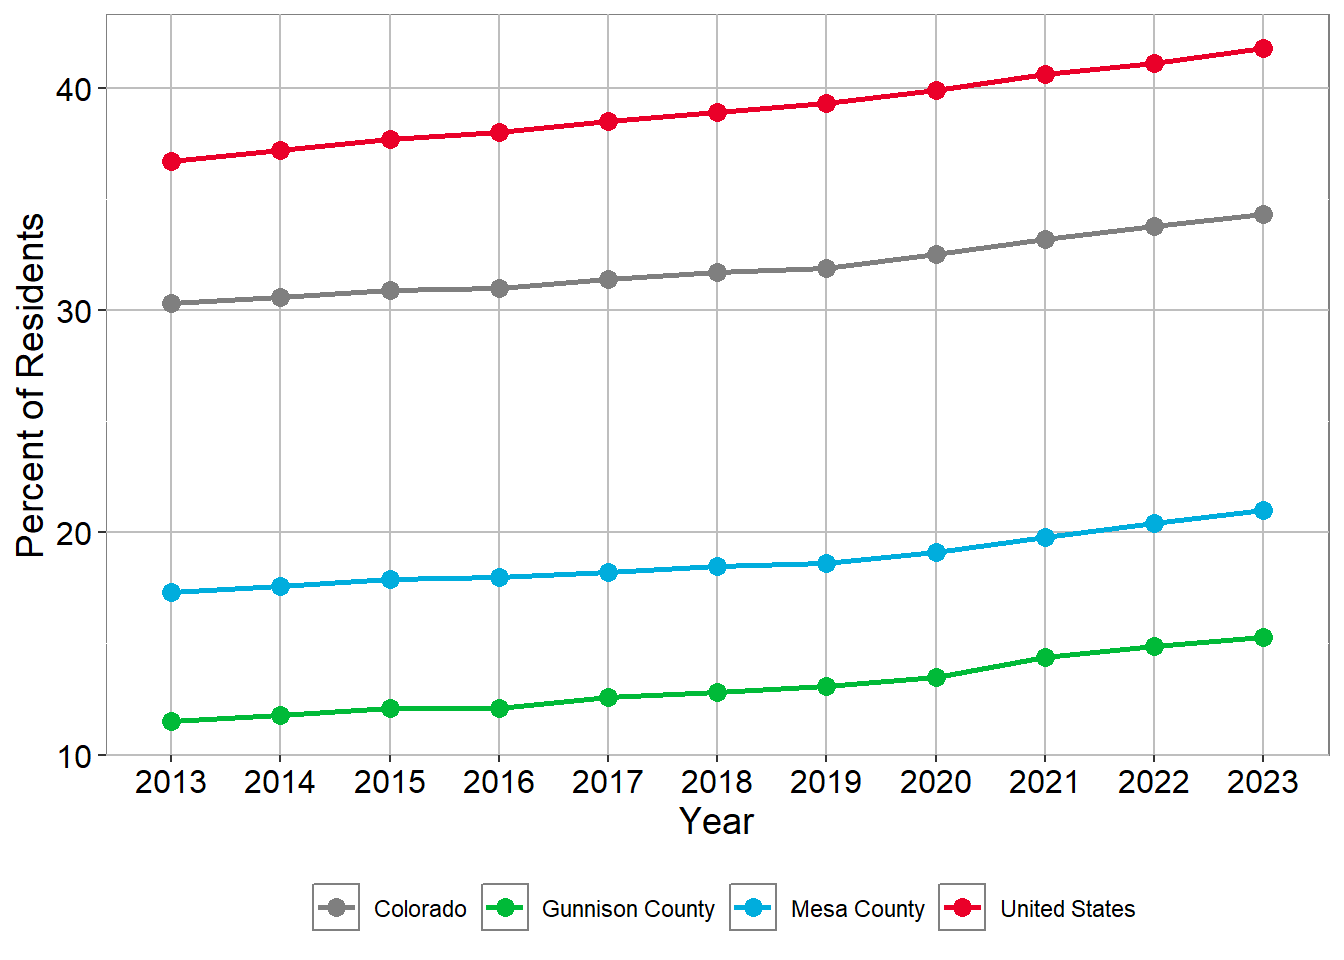
Over the past decade, People of Color have made up a steadily increasing share of the population, from 17% in 2013 to 20% in 2022. This change is being driven primarily by increasing diversity in the younger population. People of Color make up nearly a third of those under 25 years old, compared to only about 10% among those 65 and older.
People of color or Hispanic by Year
People of color or Hispanic by Year
| name | 2013 | 2014 | 2015 | 2016 | 2017 | 2018 | 2019 | 2020 | 2021 | 2022 | 2023 |
|---|---|---|---|---|---|---|---|---|---|---|---|
| Colorado | 30.3% | 30.6% | 30.9% | 31.0% | 31.4% | 31.7% | 31.9% | 32.5% | 33.2% | 33.8% | 34.3% |
| Mesa County | 17.3% | 17.6% | 17.9% | 18.0% | 18.2% | 18.5% | 18.6% | 19.1% | 19.8% | 20.4% | 21.0% |
| United States | 36.7% | 37.2% | 37.7% | 38.0% | 38.5% | 38.9% | 39.3% | 39.9% | 40.6% | 41.1% | 41.8% |
Source: U.S. Census Bureau, American Community Survey 5-year estimates, Tables: B01001H; SEX BY AGE (WHITE ALONE, NOT HISPANIC OR LATINO), and B01003; TOTAL POPULATION 2022
PEOPLE OF COLOR Within Age Group, Mesa County - 2023
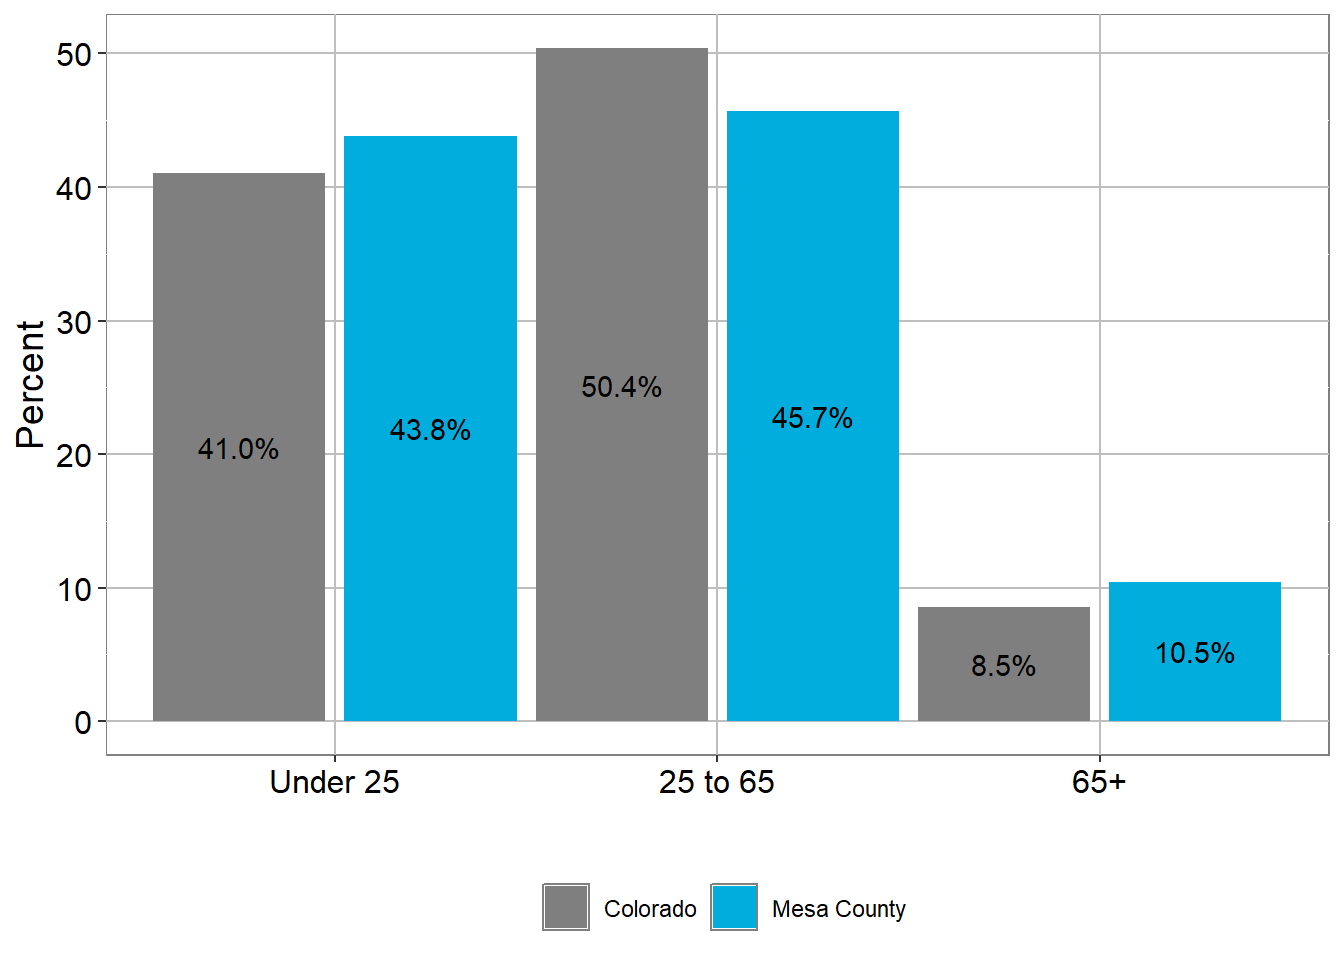
PEOPLE OF COLOR Within Age Group, Mesa County - 2023
| Region | Under 25 | 25 to 65 | 65+ |
|---|---|---|---|
| Colorado | 41.0% | 50.4% | 8.5% |
| Mesa County | 43.8% | 45.7% | 10.5% |
Source: U.S. Census Bureau, American Community Survey 5-year estimates, Table: DP04; SELECTED HOUSING CHARACTERISTICS 2022
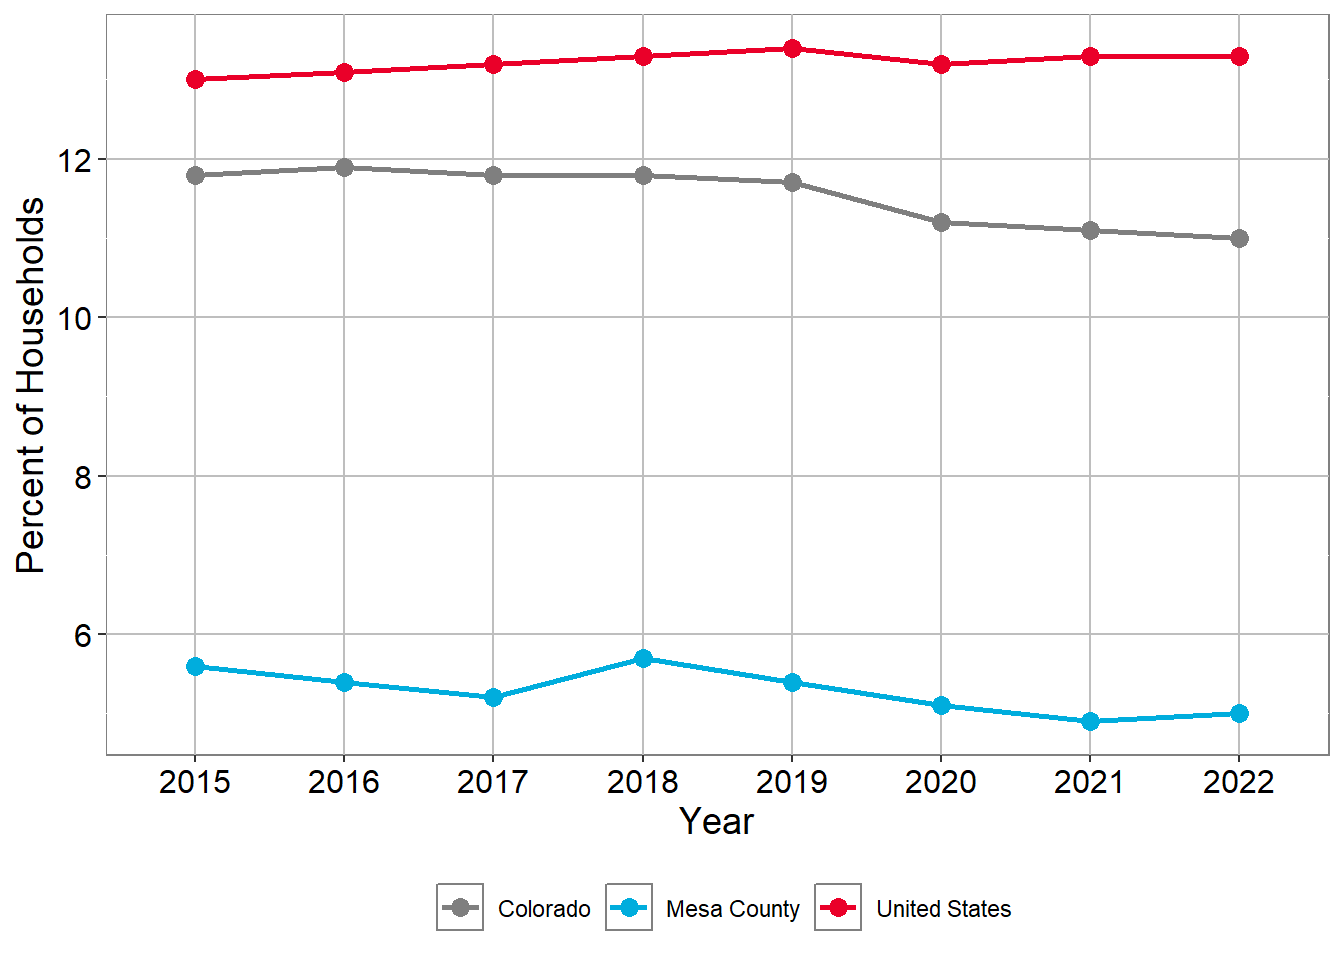
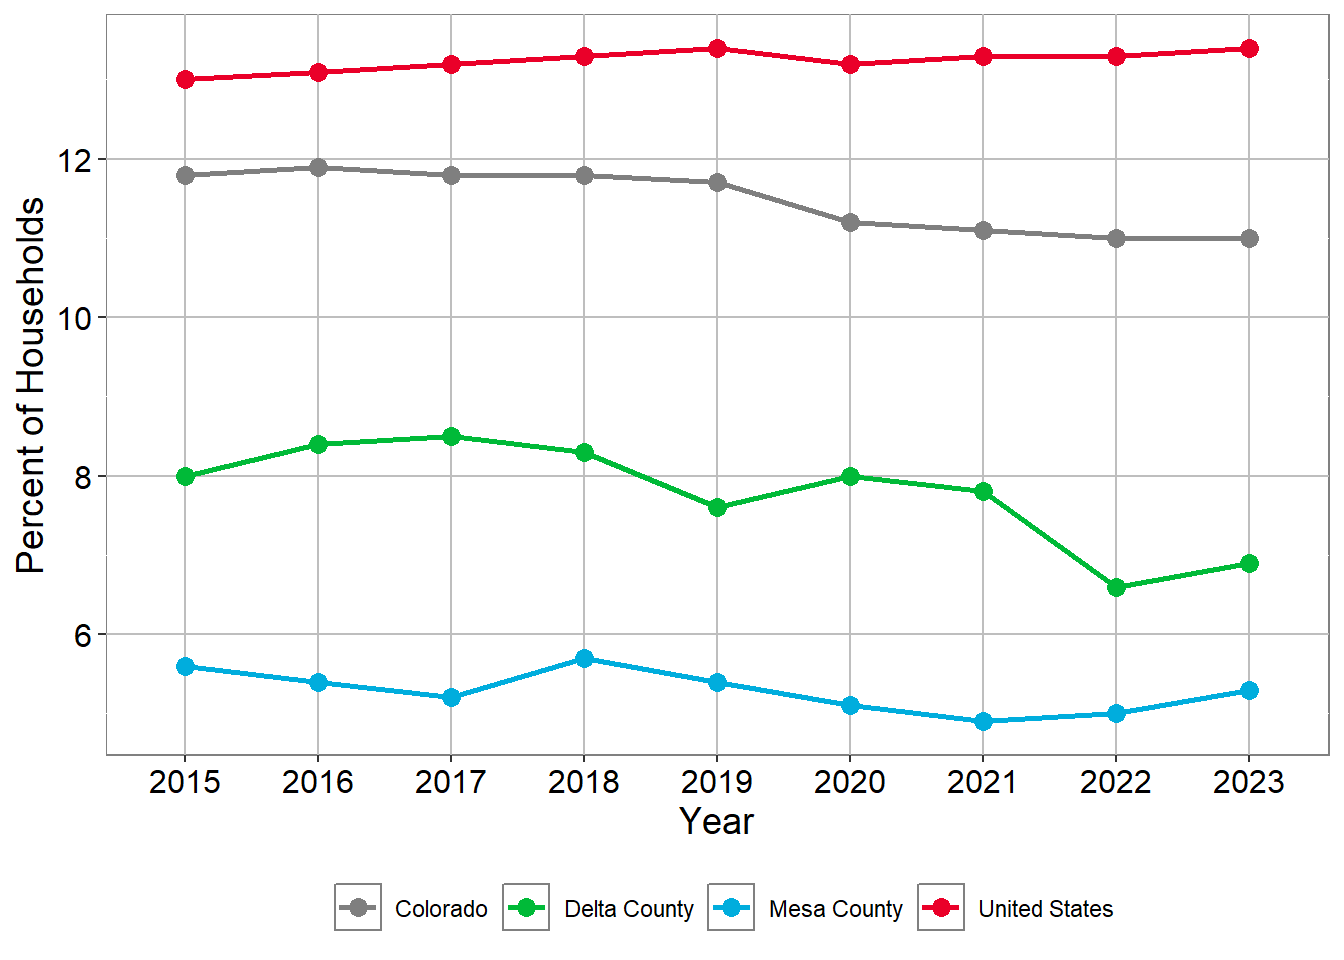
Spanish Speaking Households
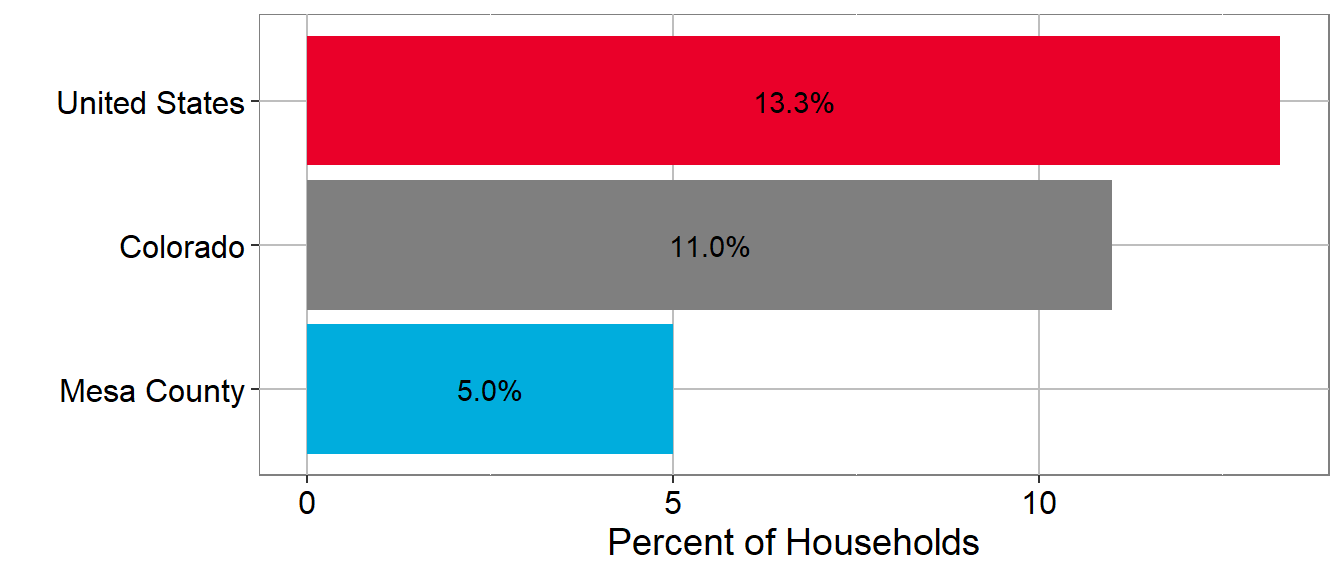
In 2022, about 5% of Mesa County residents reported speaking Spanish at home; this is about a third of Hispanic residents. Among these, 30% said they speak English “less than very well,” which is about 2,300 residents five years or older.
POPULATION AGE 5+ WHO SPEAK SPANISH AT HOME
2023
POPULATION AGE 5+ WHO SPEAK SPANISH AT HOME
POPULATION AGE 5+ WHO SPEAK SPANISH AT HOME
| Region | 2015 | 2016 | 2017 | 2018 | 2019 | 2020 | 2021 | 2022 | 2023 |
|---|---|---|---|---|---|---|---|---|---|
| Colorado | 11.8% | 11.9% | 11.8% | 11.8% | 11.7% | 11.2% | 11.1% | 11.0% | 11.0% |
| Mesa County | 5.6% | 5.4% | 5.2% | 5.7% | 5.4% | 5.1% | 4.9% | 5.0% | 5.3% |
| United States | 13.0% | 13.1% | 13.2% | 13.3% | 13.4% | 13.2% | 13.3% | 13.3% | 13.4% |
Source: U.S. Census Bureau, American Community Survey 5-year estimates, Table: S1601; LANGUAGE SPOKEN AT HOME 2022
Gender Identity and Sexual Orientation
National, statewide, and local data collection efforts often lack sufficient information related to sexual orientation or gender identity.
The limited data currently available on sexual orientation and gender identity presents a challenge in meaningfully describing the local LGBTQ+ community in a way that would help in highlighting community resources and identifying areas in need of community action.
Nationally, about 4.5% of the population identifies as lesbian, gay, bisexual, or transgender, 4.6% in Colorado and 3.7% in Utah. Based on these percentages and the likelihood that there is a similar prevalence locally, there are somewhere in the range of 5,700 to 7,200 residents identify as LGBTQ+ in Mesa County.
The most robust data available about LGBTQ+ residents of Mesa County comes from the Healthy Kids Colorado Survey for high schoolers. 24.5% of survey respondents identified as LGBTQ+.
Recent statewide survey data from the Williams Institute indicates the following are some characteristics of LGBTQ+ Coloradans which are likely to be similar in Mesa County:
- LGBTQ+ individuals tend to be younger with an average age of 37 compared to non-LGBTQ+ individuals with an average age of 47.
- LGBTQ+ individuals are more likely to have a household income that is less than $24,000.
- LGBTQ+ individuals are twice as likely to experience food insecurity, 27% compared to 15%.
Source: LGBT Demographic Data Interactive. UCLA School Of Law.
Understanding the experiences and characteristics of different communities in Mesa County is a priority for local community leaders, which can help to shape better organizational capacity and benefit those they serve.
Disability
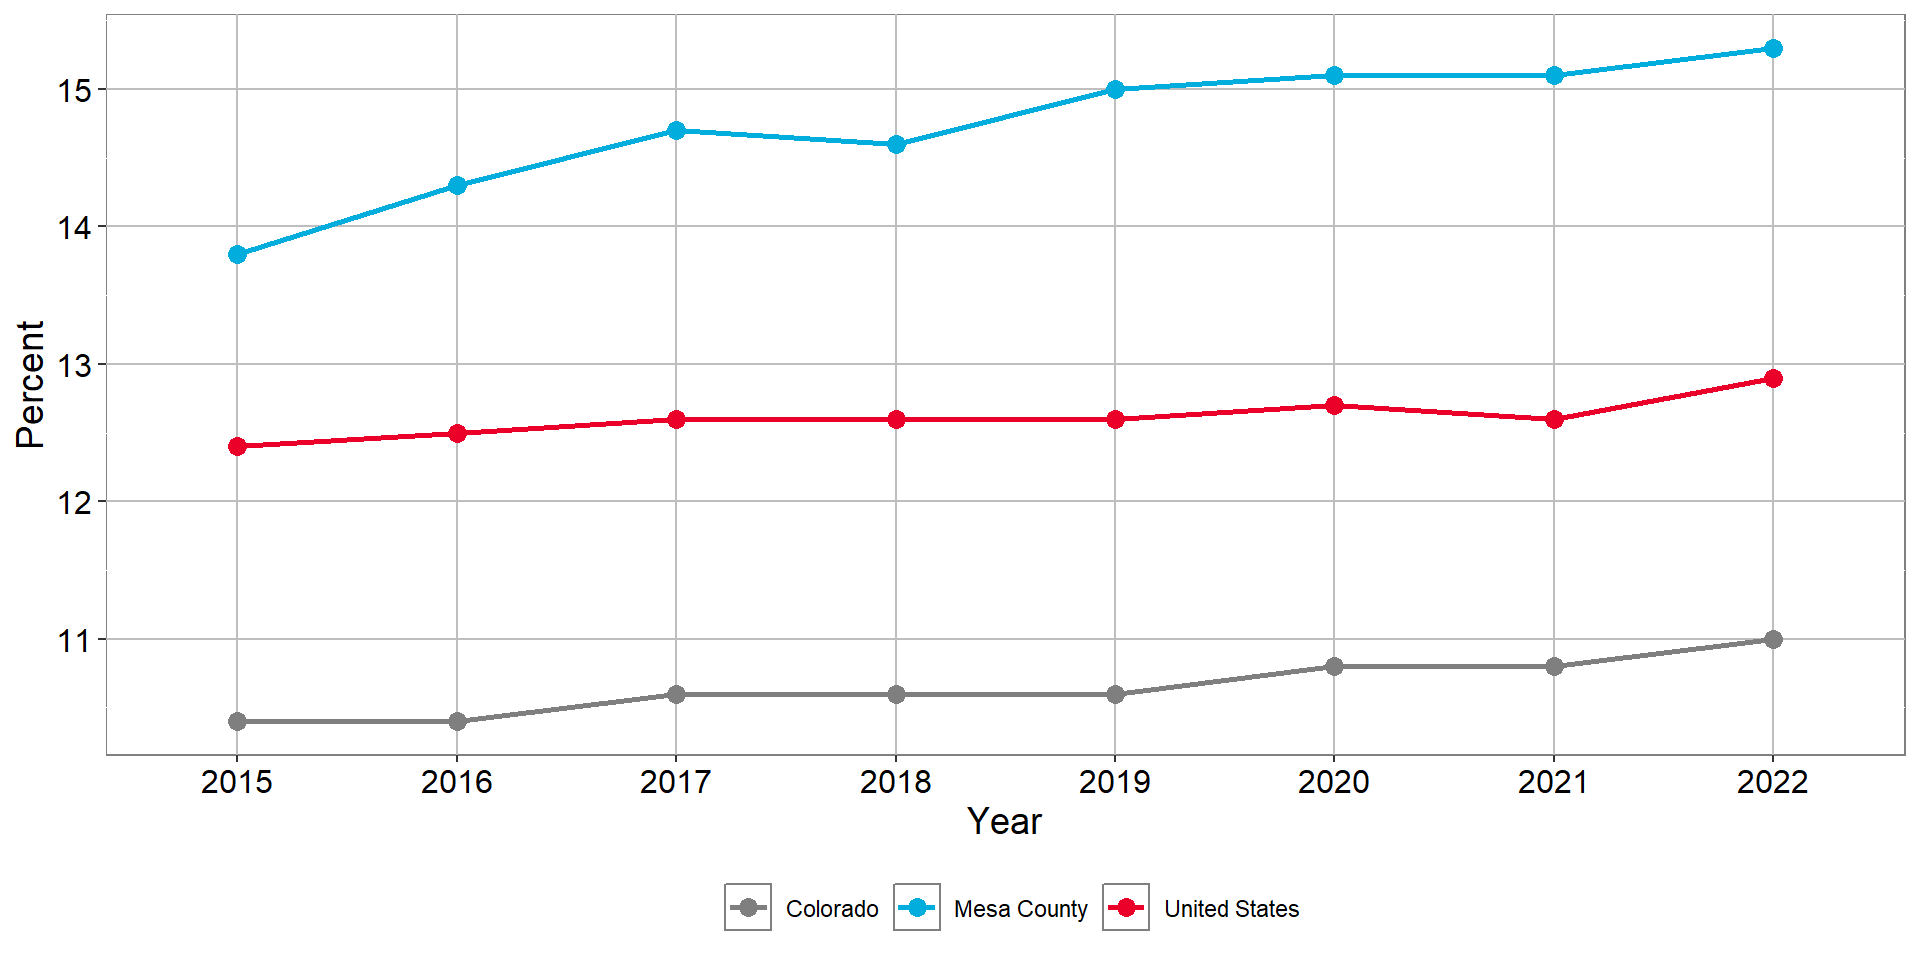
In 2022, about 15% of the population in Mesa County had one or more disabling conditions. This rate is higher than the Colorado and U.S. rates; however, this is unsurprising given the higher share of older adults in Mesa County.
Disability Definitions
- Hearing difficulty deaf or having serious difficulty hearing.
- Vision difficulty blind or having serious difficulty seeing, even when wearing glasses.
- Cognitive difficulty Because of a physical, mental, or emotional problem, having difficulty remembering, concentrating, or making decisions.
- Ambulatory difficulty Having serious difficulty walking or climbing stairs.
- Self-care difficulty Having difficulty bathing or dressing.
- Independent living difficulty Because of a physical, mental, or emotional problem, having difficulty doing errands alone such as visiting a doctor’s office or shopping.
Source: U.S. Census Bureau
Poplation with Disability By Type, Mesa County 2023
| Disability | Percent |
|---|---|
| Ambulatory difficulty | 7.2% |
| Cognitive difficulty | 7.0% |
| Independent living difficulty | 6.2% |
| Hearing difficulty | 5.0% |
| Vision difficulty | 3.0% |
| Self-care difficulty | 2.5% |
Source: U.S. Census Bureau, American Community Survey 5-year estimates, Table: S1810; DISABILITY CHARACTERISTICS 2023
POPULATION WITH A DISABILITY (2023) Among Civilian Nonistitutionalize Population
POPULATION WITH A DISABILITY Among Civilian Nonistitutionalize Population
POPULATION WITH A DISABILITY Among Civilian Nonistitutionalize Population
| Region | 2015 | 2016 | 2017 | 2018 | 2019 | 2020 | 2021 | 2022 | 2023 |
|---|---|---|---|---|---|---|---|---|---|
| Colorado | 10.4% | 10.4% | 10.6% | 10.6% | 10.6% | 10.8% | 10.8% | 11.0% | 11.2% |
| Mesa County | 13.8% | 14.3% | 14.7% | 14.6% | 15.0% | 15.1% | 15.1% | 15.3% | 15.3% |
| United States | 12.4% | 12.5% | 12.6% | 12.6% | 12.6% | 12.7% | 12.6% | 12.9% | 13.0% |
Source: U.S. Census Bureau, American Community Survey 5-year estimates, Table: S1810; DISABILITY CHARACTERISTICS 2023
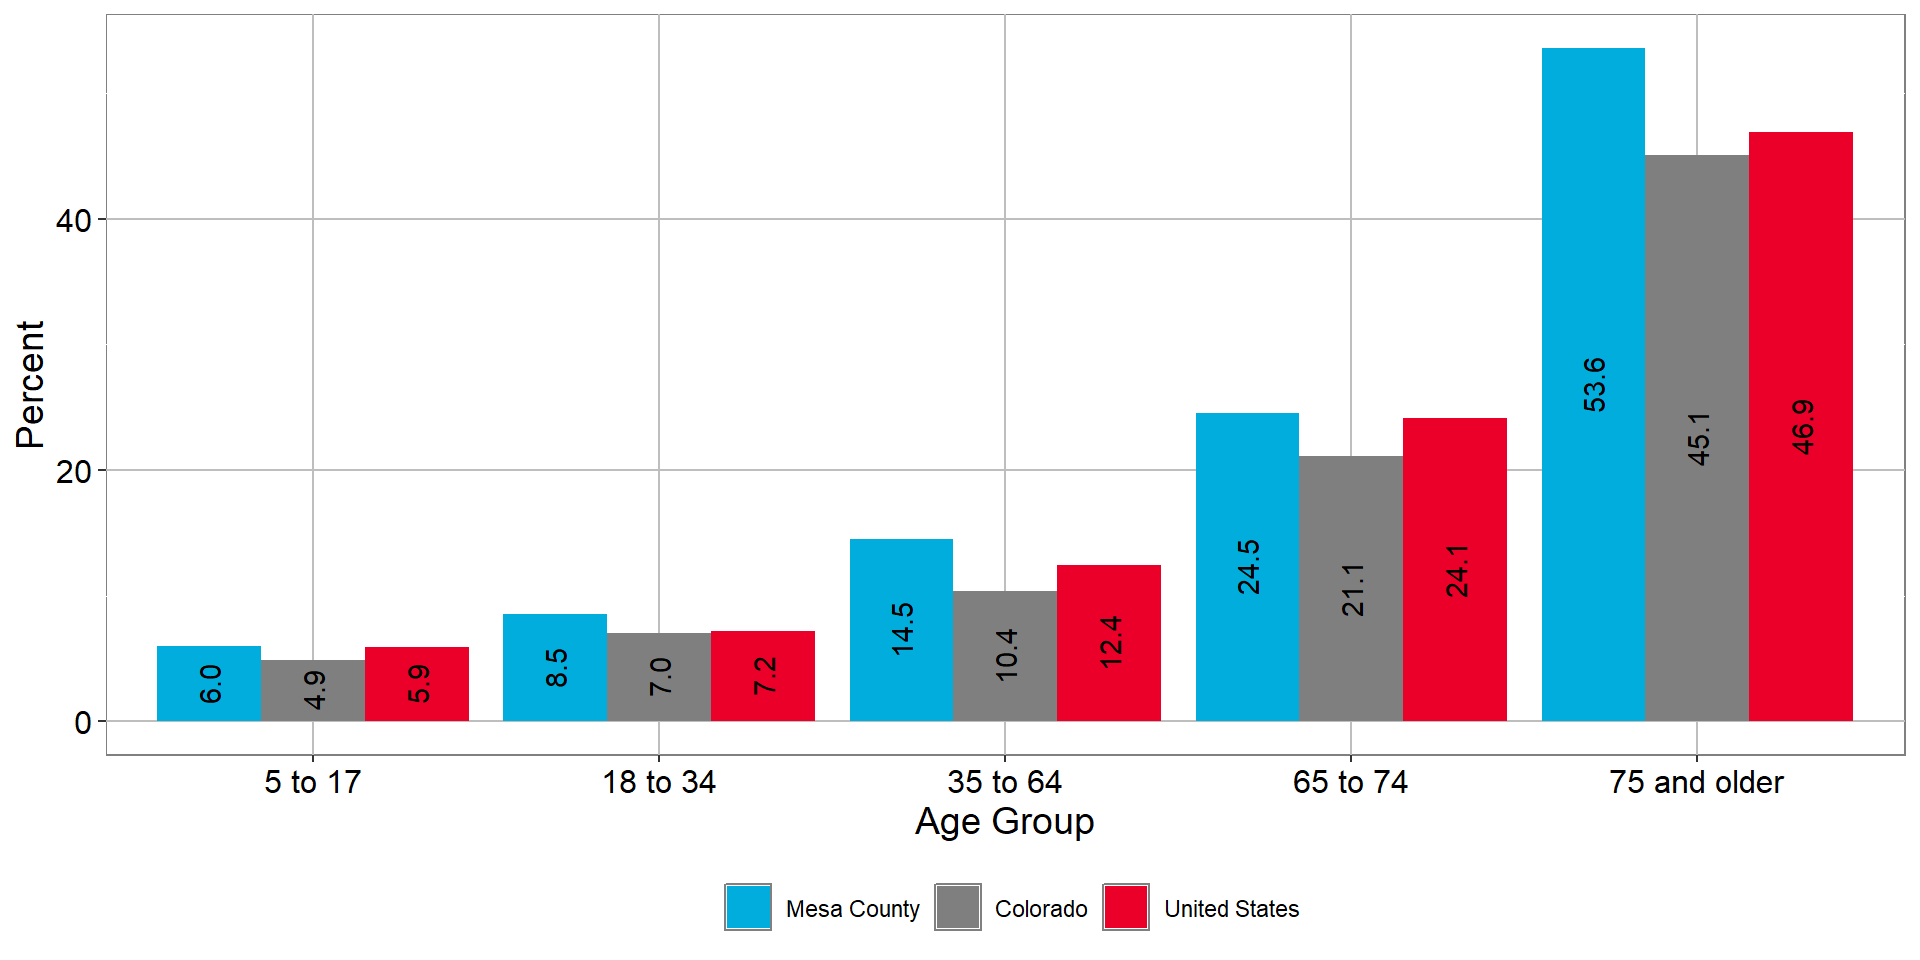
Mesa County Residents: Percent with Disability by Age 2023
Among Civilian Nonistitutionalize Population
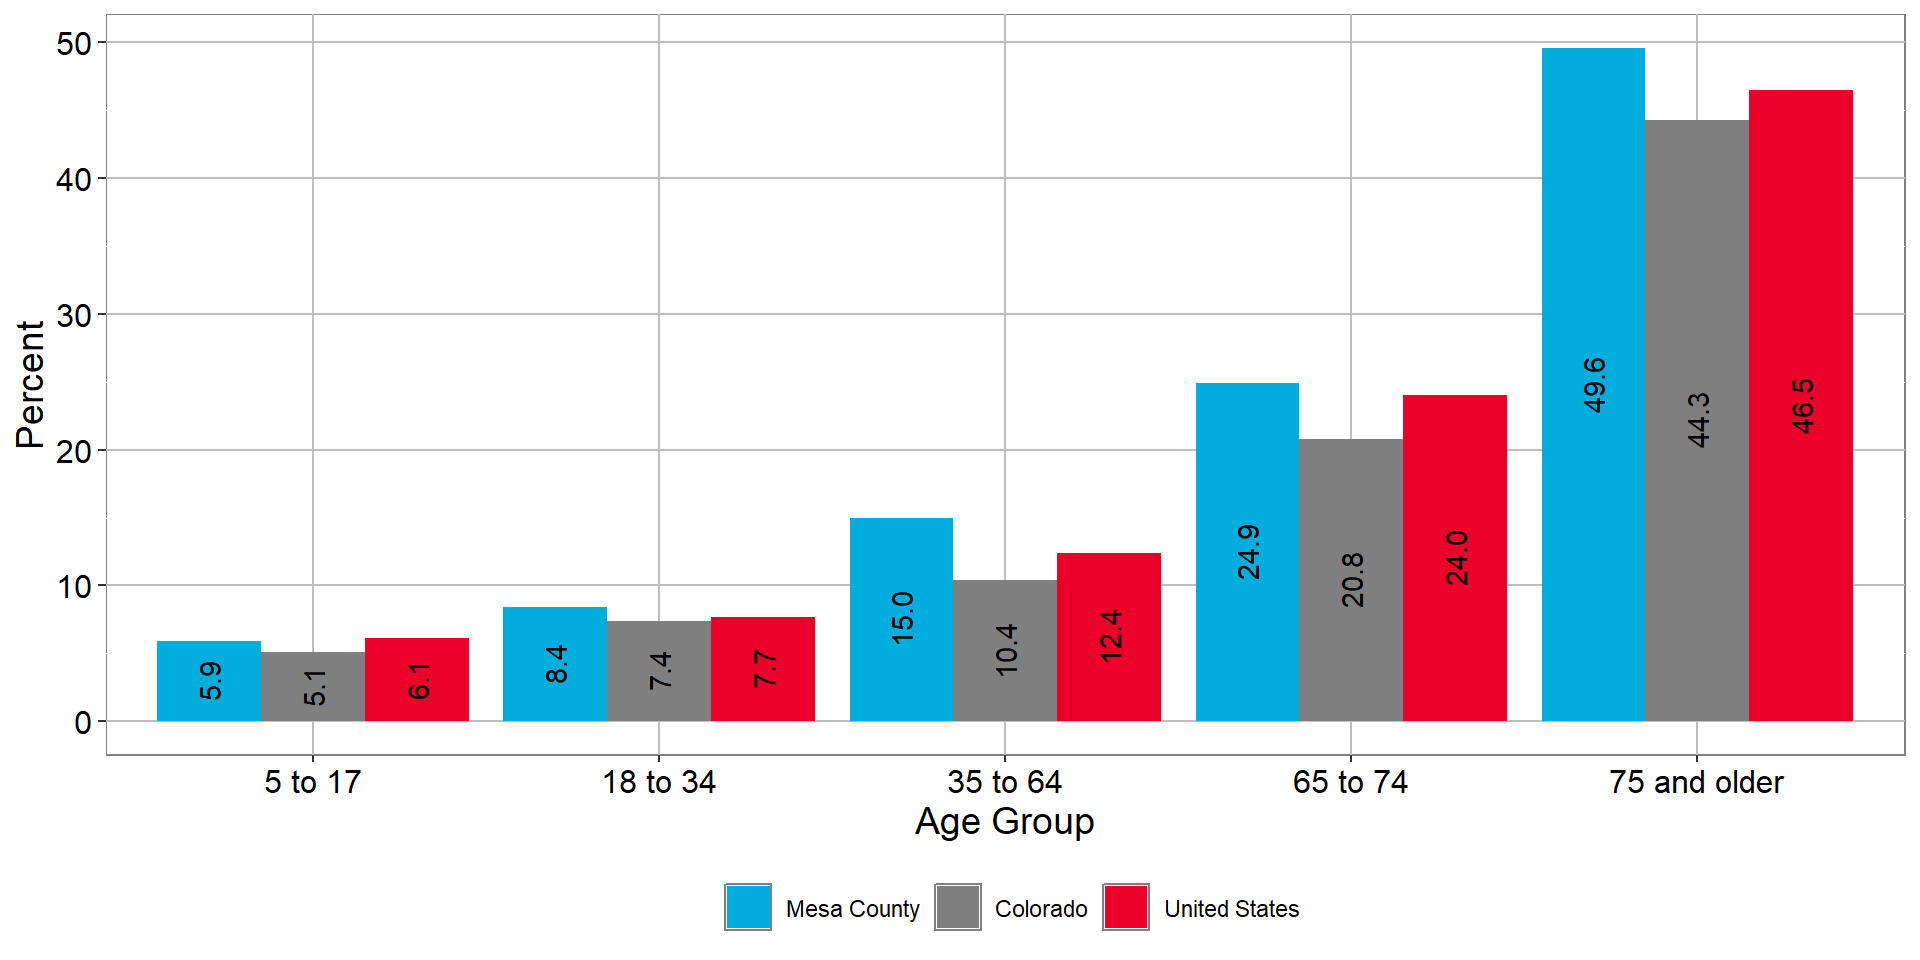
Mesa County Residents: Percent with Disability by Age 2023
Among Civilian Nonistitutionalize Population
| Region | 5 to 17 | 18 to 34 | 35 to 64 | 65 to 74 | 75 and older |
|---|---|---|---|---|---|
| Mesa County | 5.9% | 8.4% | 15.0% | 24.9% | 49.6% |
| Colorado | 5.1% | 7.4% | 10.4% | 20.8% | 44.3% |
| United States | 6.1% | 7.7% | 12.4% | 24.0% | 46.5% |
Source: U.S. Census Bureau, American Community Survey 5-year estimates, Table: S1810; DISABILITY CHARACTERISTICS 2023
Educational Attainment
Among adults 25 and older, the rate of high school completion in Mesa County and Colorado is about 92%, which is higher than the national rate of 89%.
Adults, 25+, with HS Degree or Equivalent
| 2017 | 2019 | 2023 | |
|---|---|---|---|
| Colorado | 91.1% | 91.7% | 92.8% |
| Mesa County | 90.2% | 90.5% | 92.4% |
| United States | 87.3% | 88.0% | 89.4% |
Source: Census Bureau, ACS 5-year estimates, Table: B15003; EDUCATIONAL ATTAINMENT FOR THE POPULATION 25 YEARS AND OVER 2023
Adults, 18-24, with Bachelor’s Degree
| 2017 | 2019 | 2023 | |
|---|---|---|---|
| Mesa County | 4.5% | 7.3% | 7.9% |
| Colorado | 11.5% | 12.6% | 14.3% |
| United States | 10.5% | 11.2% | 12.9% |
Source: Census Bureau, ACS 5-year estimates, Table: S1501; EDUCATIONAL ATTAINMENT 2023
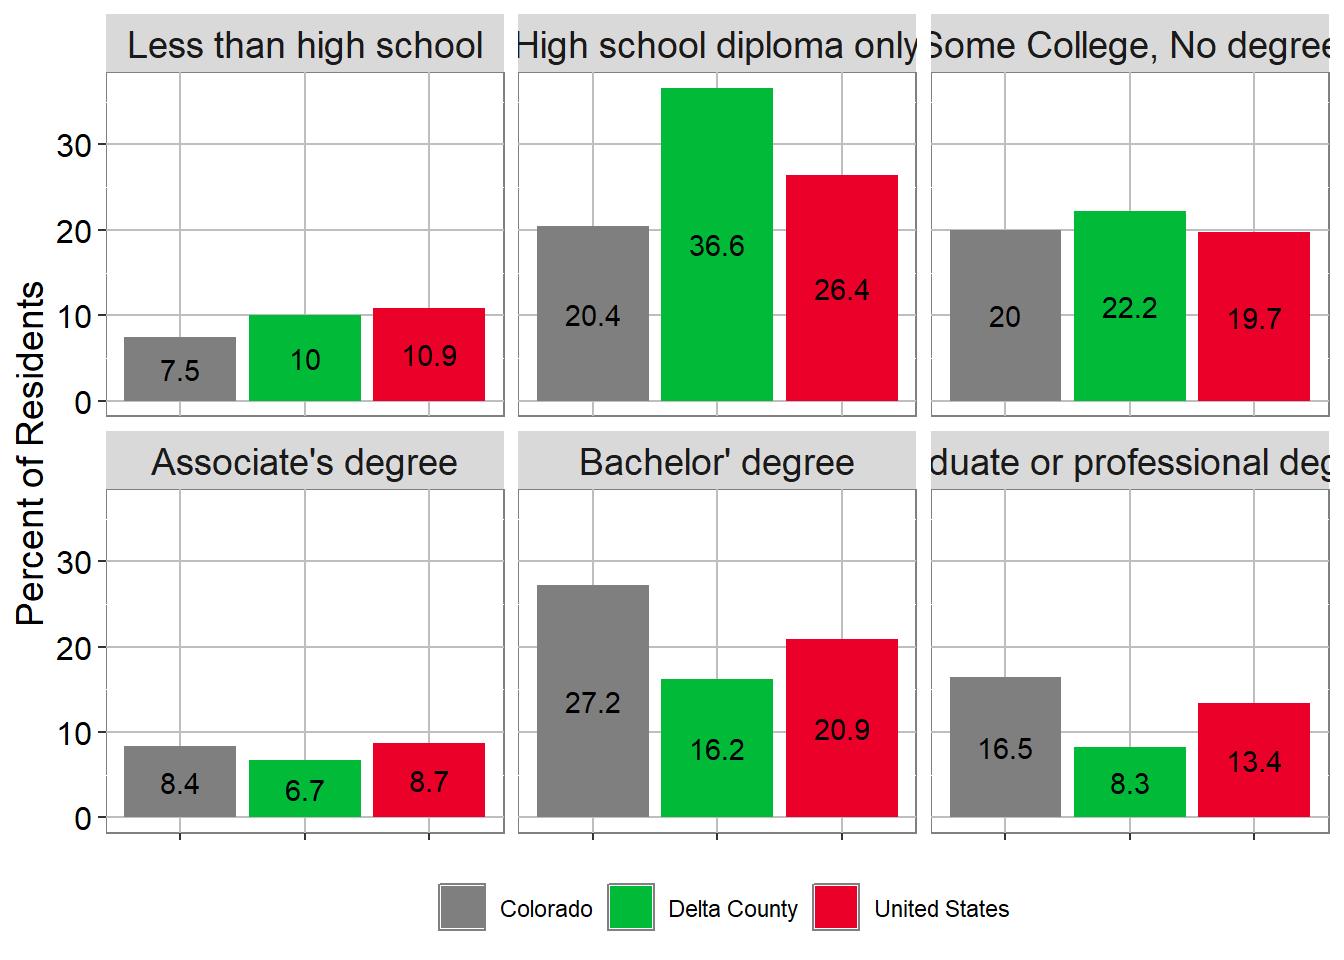
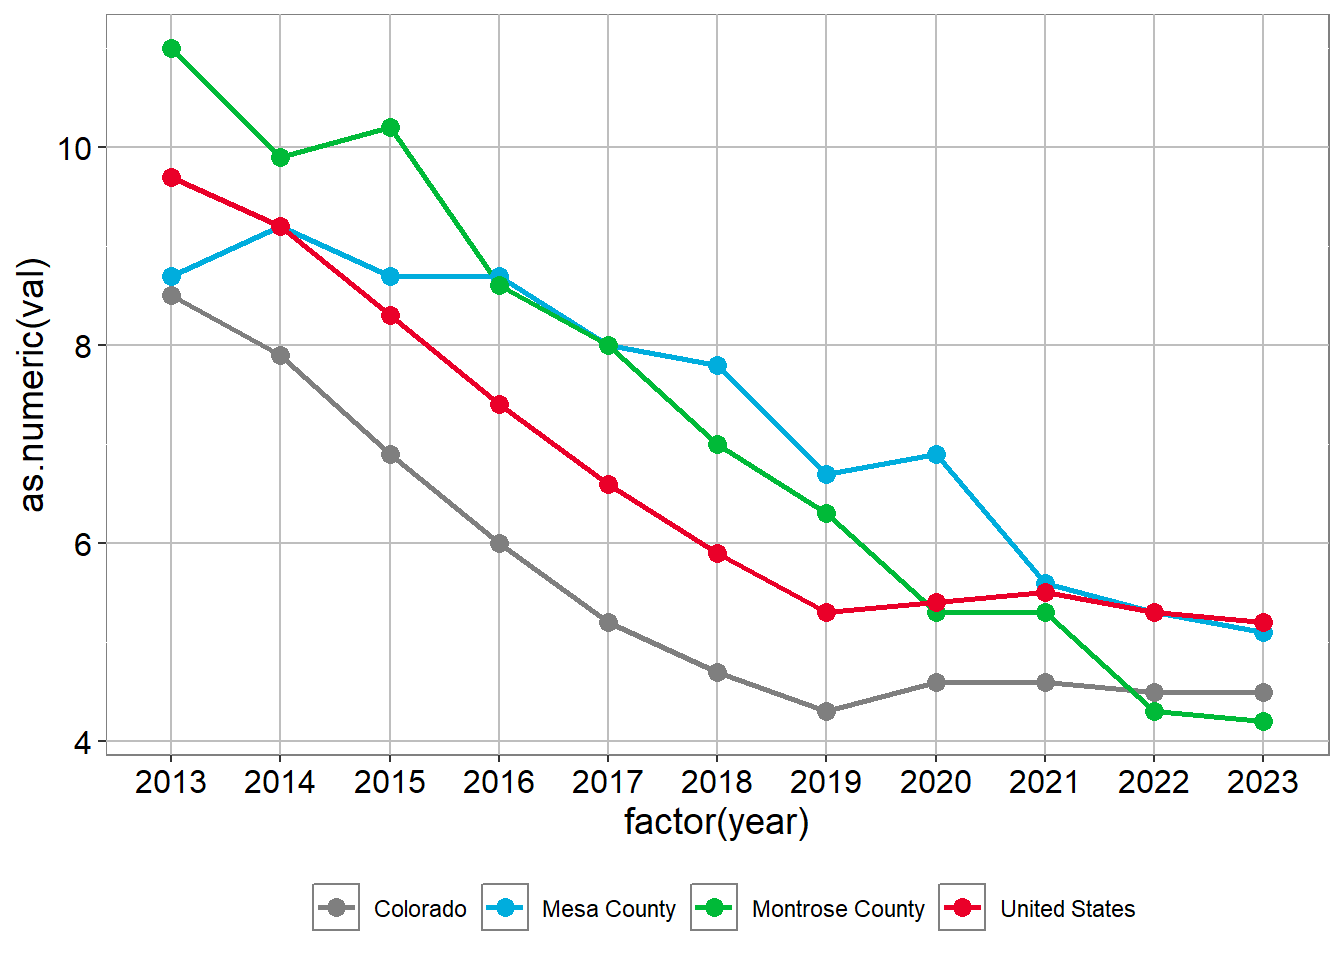
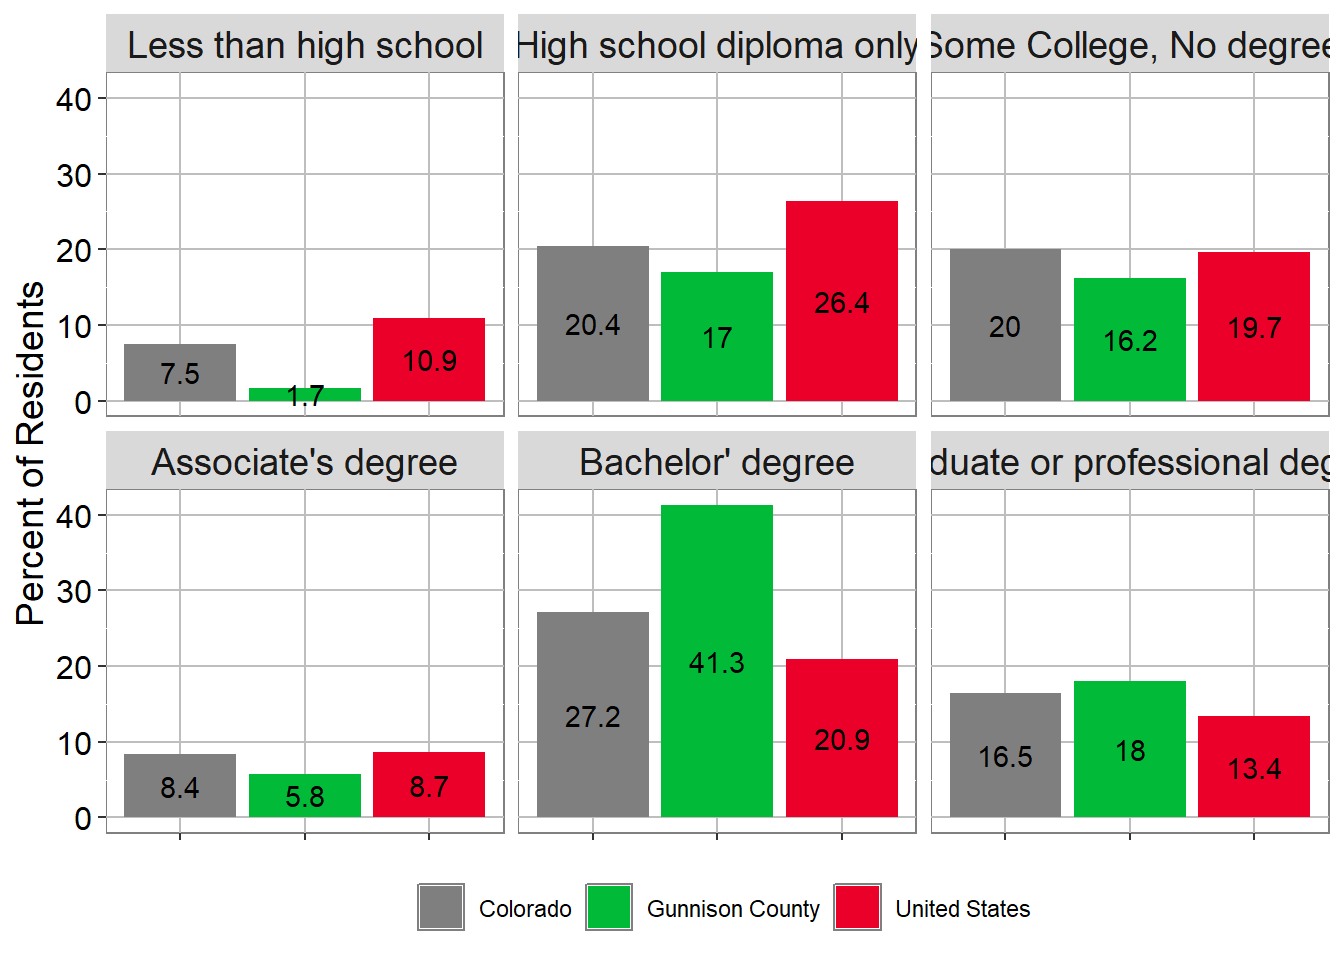
Historically, Mesa County has significantly trailed both the state of Colorado and the U.S. in the share of adults with bachelor’s degrees or greater.
However, the prevalence of adults with higher education in Mesa County has increased. Over the last decade, the share of young adults with a bachelor’s degree has nearly doubled.
This prevalence has increased even among older age groups, likely impacted by the higher educational attainment of those moving to the area in recent years.
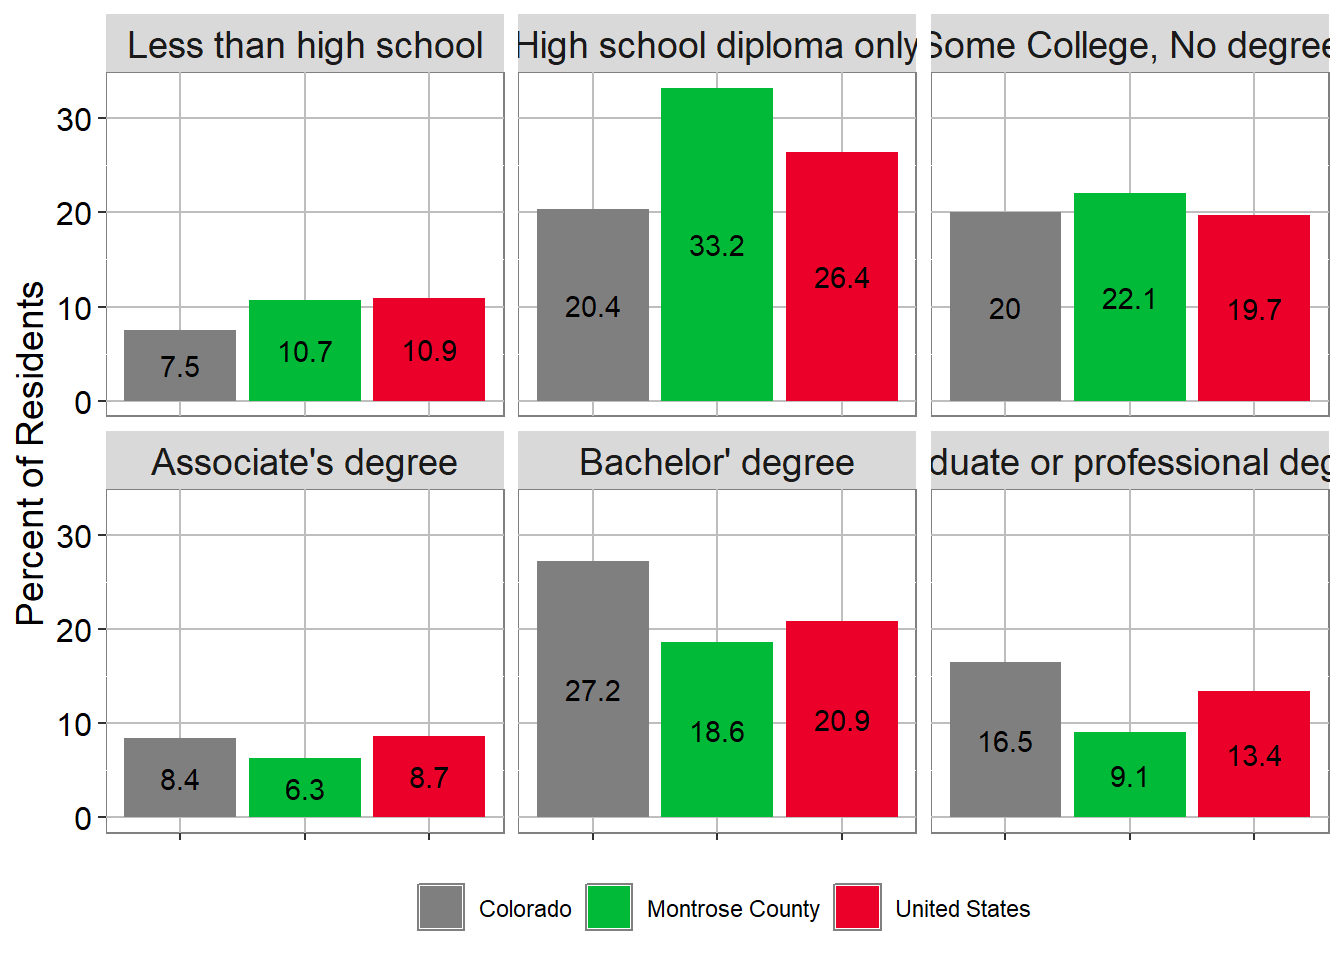
EDUCATIONAL ATTAINMENT (ADULTS 25+) IN Mesa County ( 2023 )
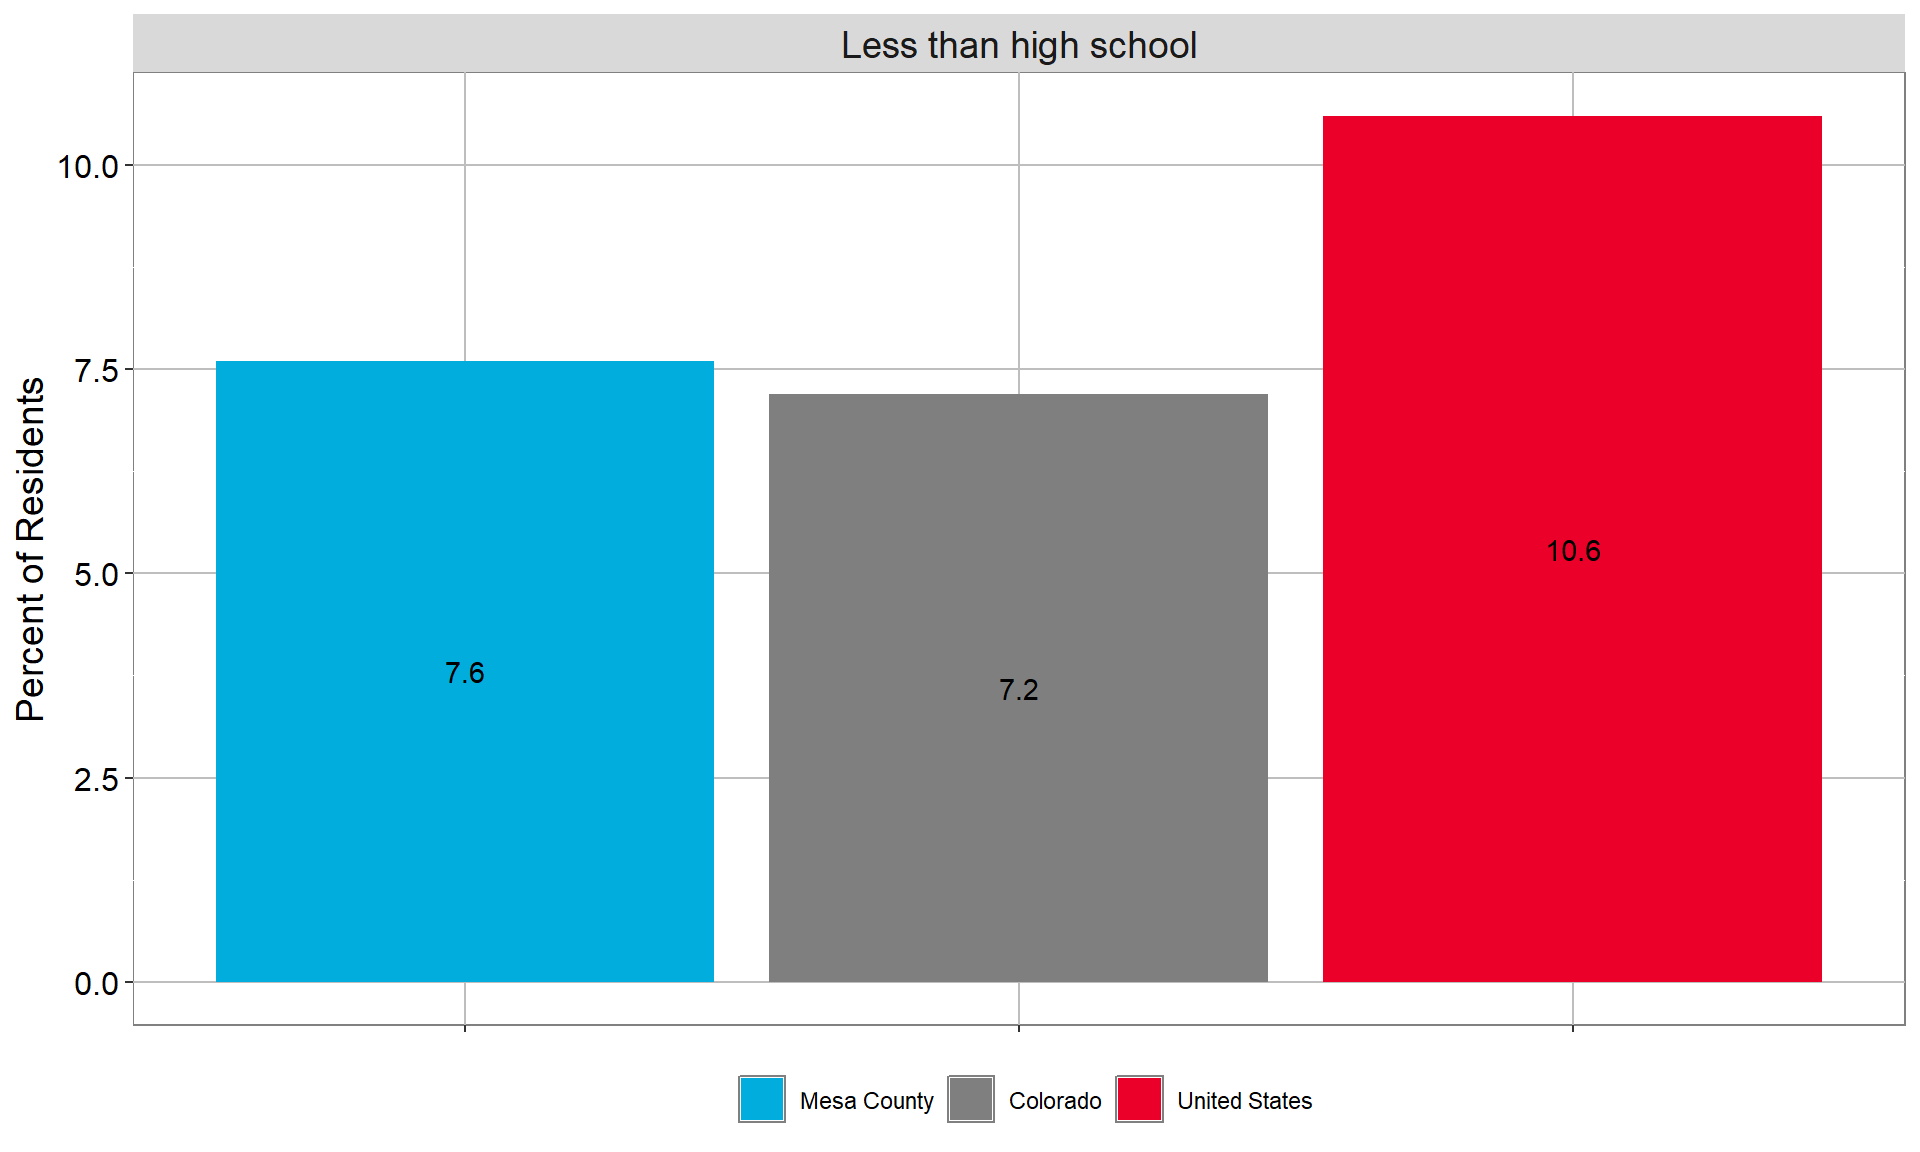
EDUCATIONAL ATTAINMENT (ADULTS 25+) IN Mesa County ( 2023 )
| Mesa County | Colorado | United States | |
|---|---|---|---|
| Less than high school | 7.6% | 7.2% | 10.6% |
Source: U.S. Census Bureau, American Community Survey 5-year estimates, Table: B15003; EDUCATIONAL ATTAINMENT FOR THE POPULATION 25 YEARS AND OVER 2023
Economic Characteristics
Employment
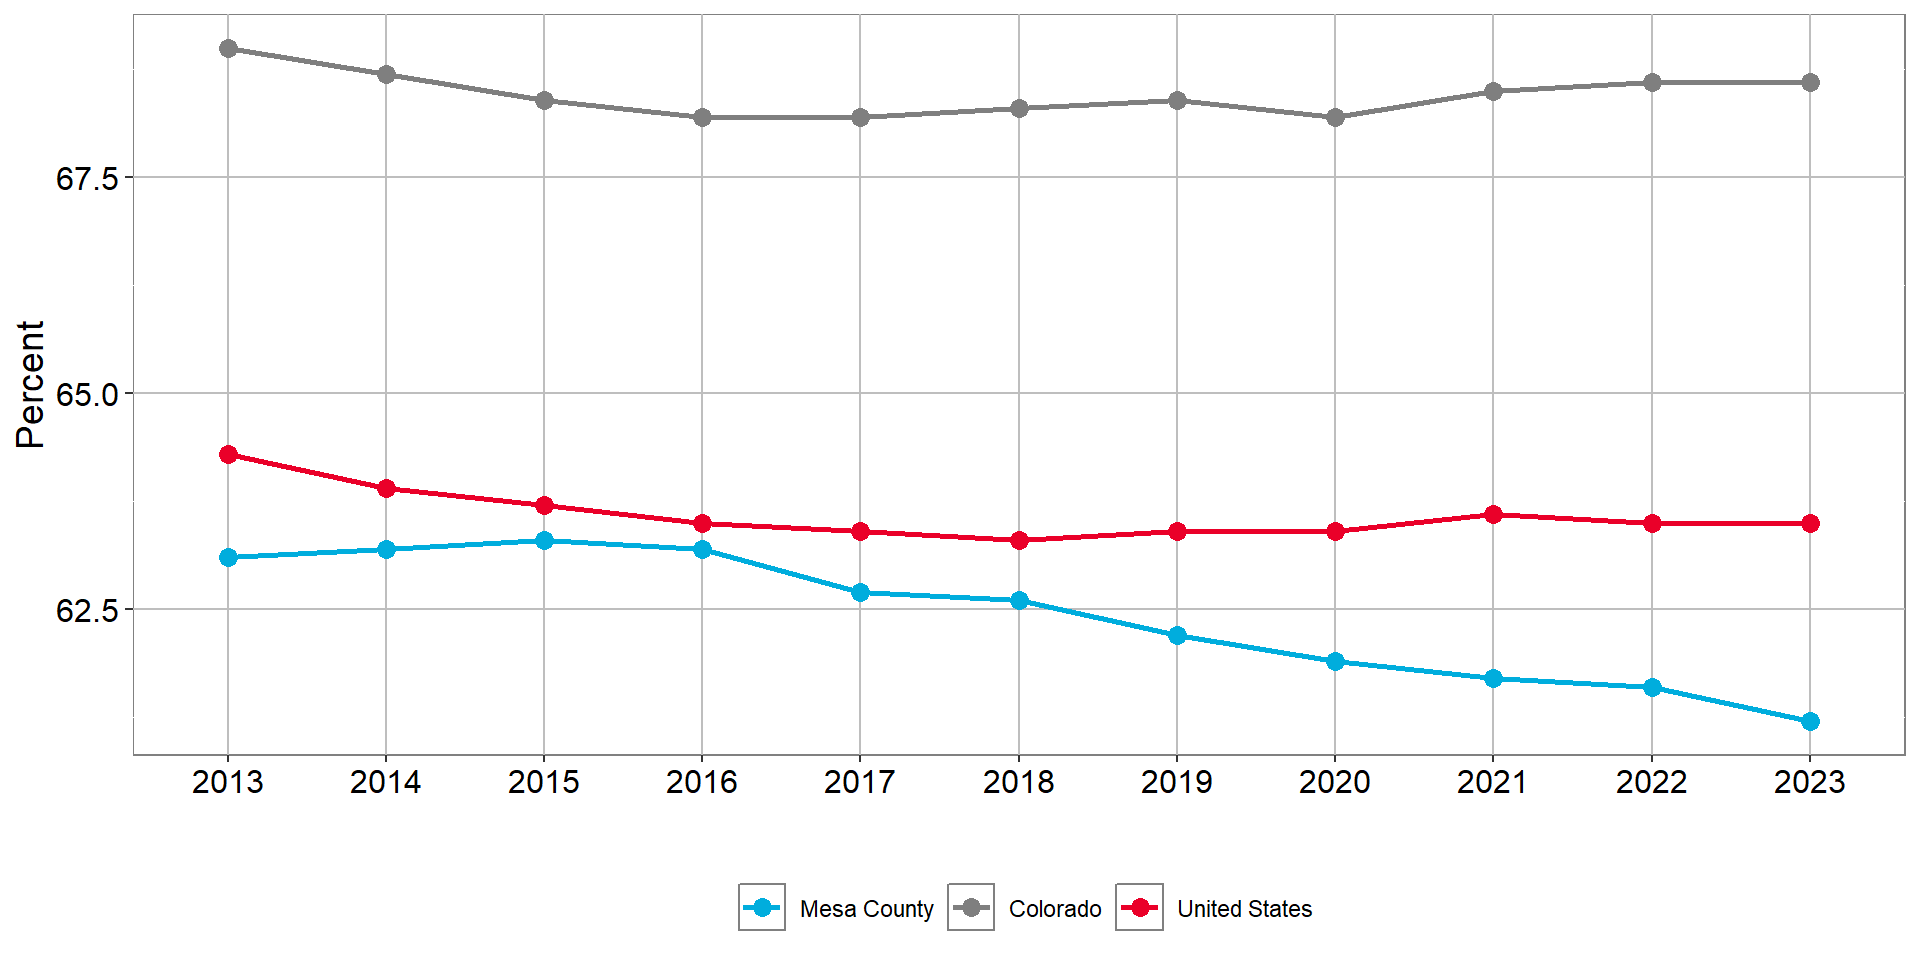
In Mesa County, a smaller share of the population 16 and older participates in the labor force compared to both Colorado and the U.S. This is expected given the notably higher share of adults 65 and older in Mesa County.
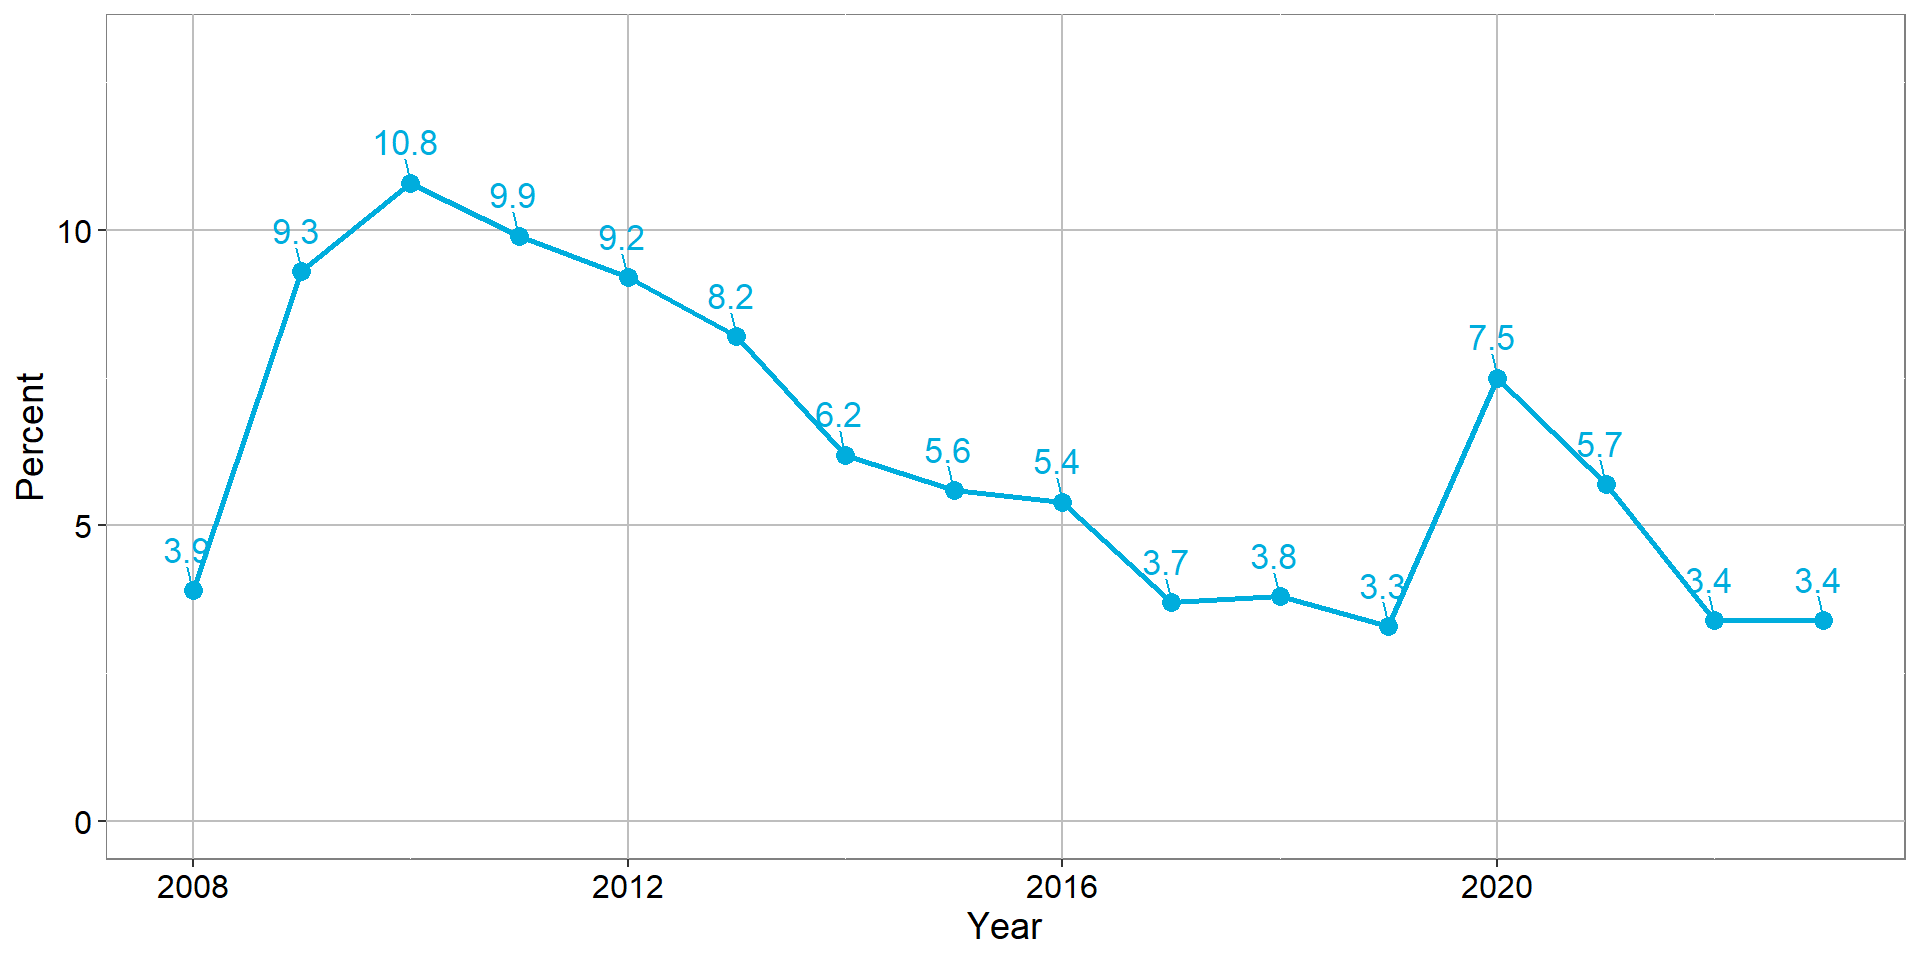
Mesa County’s unemployment rate peaked in 2010 at 10.8%, and again recently in 2020 at 7.5%. In 2019, nine years after Mesa County’s 2010 unemployment rate spike, the unemployment rate returned to levels similar to those of pre-2010 years. The impact of the COVID-19 pandemic raised the unemployment rate again, but the effect was short-lived with rates returning to pre-pandemic levels by 2022.
DECEMBER 2024 UNEMPLOYMENT RATES
UNEMPLOYMENT RATE, MESA COUNTY
Annual Average
UNEMPLOYMENT RATE, MESA COUNTY
Annual Average
| 2008 | 2009 | 2010 | 2011 | 2012 | 2013 | 2014 | 2015 | 2016 | 2017 | 2018 | 2019 | 2020 | 2021 | 2022 | 2023 |
|---|---|---|---|---|---|---|---|---|---|---|---|---|---|---|---|
| 3.9% | 9.3% | 10.8% | 9.9% | 9.2% | 8.2% | 6.2% | 5.6% | 5.4% | 3.7% | 3.8% | 3.3% | 7.5% | 5.7% | 3.4% | 3.4% |
Source: U.S. Bureau of Labor Statistics, Civilian Unemployment Rate U.S. Bureau of Labor Statistics
Unemployment Rates for States Mesa County Workforce Center. Workforce Center Dashboard Statistics Data Request.
Mesa County Workforce Center, Workforce Center Dashboard Statistics [Data File]. Obtained through personal communication
Here we report the county’s unemployment rate based on statistics from the Bureau of Labor Statistics. At the County, State, and National levels, the BLS is the gold standard measure of unemployment, and the data available is very up to date, including 2023. In other parts of the report, we report the unemployment rate from the Census American Community Survey. This survey has a longer lag in it’s reporting, usually 1-2 years, and is less comprehensive than the BLS. However, the American Community Survey reports unemployment by county subsection such as demographic groups and city.
POPULATION 16+ IN CIVILIAN LABOR FORCE
POPULATION 16+ IN CIVILIAN LABOR FORCE
POPULATION 16+ IN CIVILIAN LABOR FORCE
| name | 2013 | 2014 | 2015 | 2016 | 2017 | 2018 | 2019 | 2020 | 2021 | 2022 | 2023 |
|---|---|---|---|---|---|---|---|---|---|---|---|
| Colorado | 69.0% | 68.7% | 68.4% | 68.2% | 68.2% | 68.3% | 68.4% | 68.2% | 68.5% | 68.6% | 68.6% |
| Mesa County | 63.1% | 63.2% | 63.3% | 63.2% | 62.7% | 62.6% | 62.2% | 61.9% | 61.7% | 61.6% | 61.2% |
| United States | 64.3% | 63.9% | 63.7% | 63.5% | 63.4% | 63.3% | 63.4% | 63.4% | 63.6% | 63.5% | 63.5% |
Source: U.S. Census Bureau, American Community Survey 5-year estimates, Table: S2301; EMPLOYMENT STATUS 2023
Household Income
Minimum Wage
Minimum wage increased by 75% between 2015 and 2024, from $8.23 to $14.42 per hour.
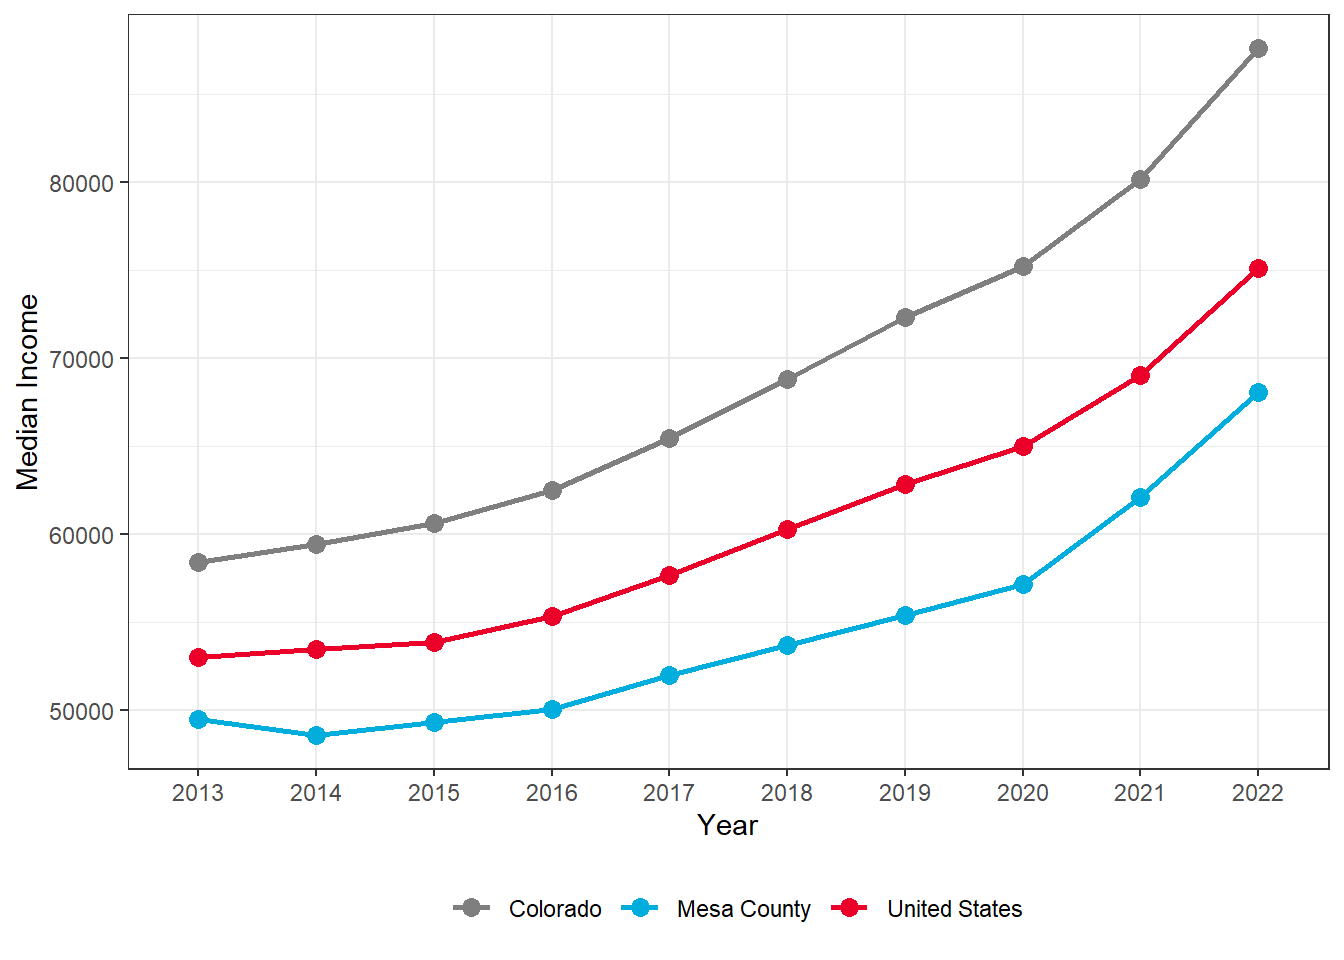
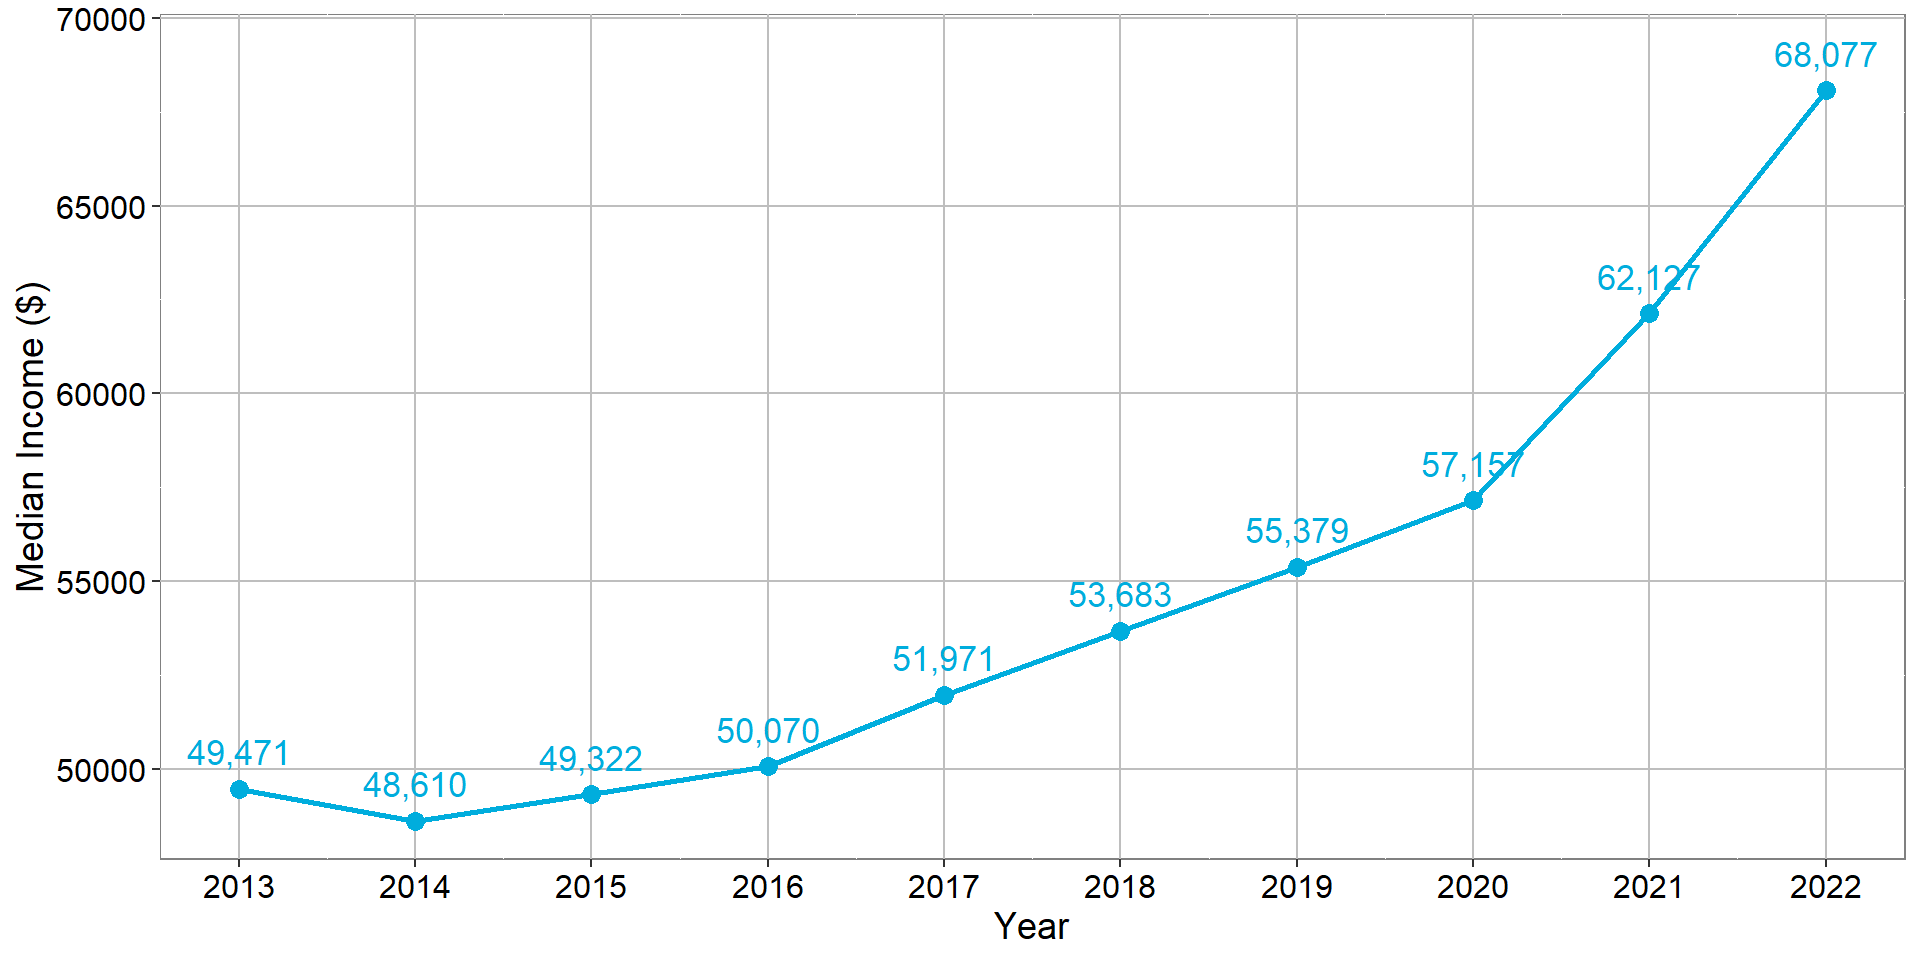
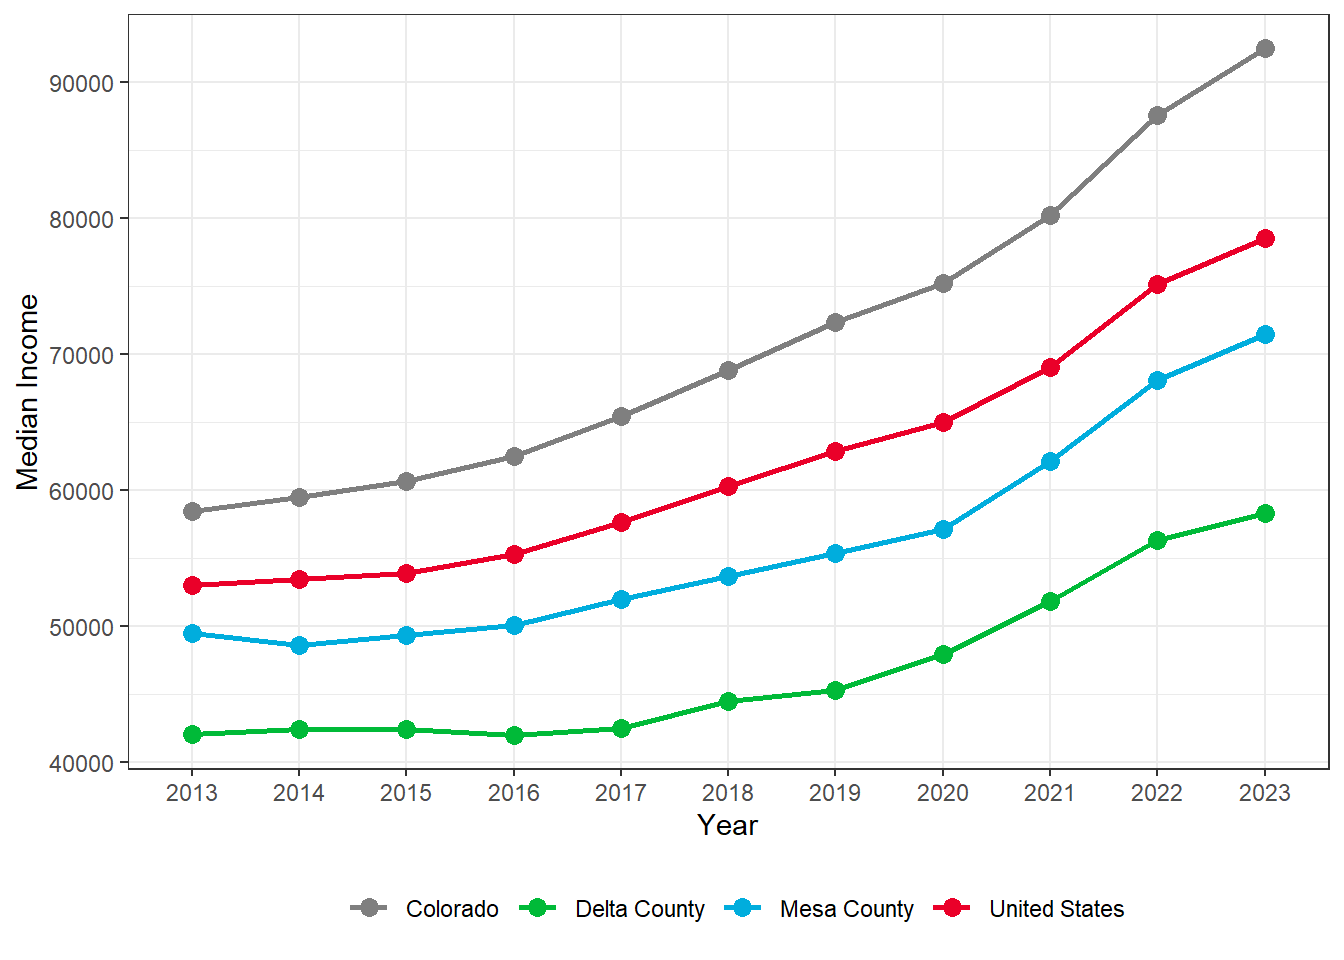
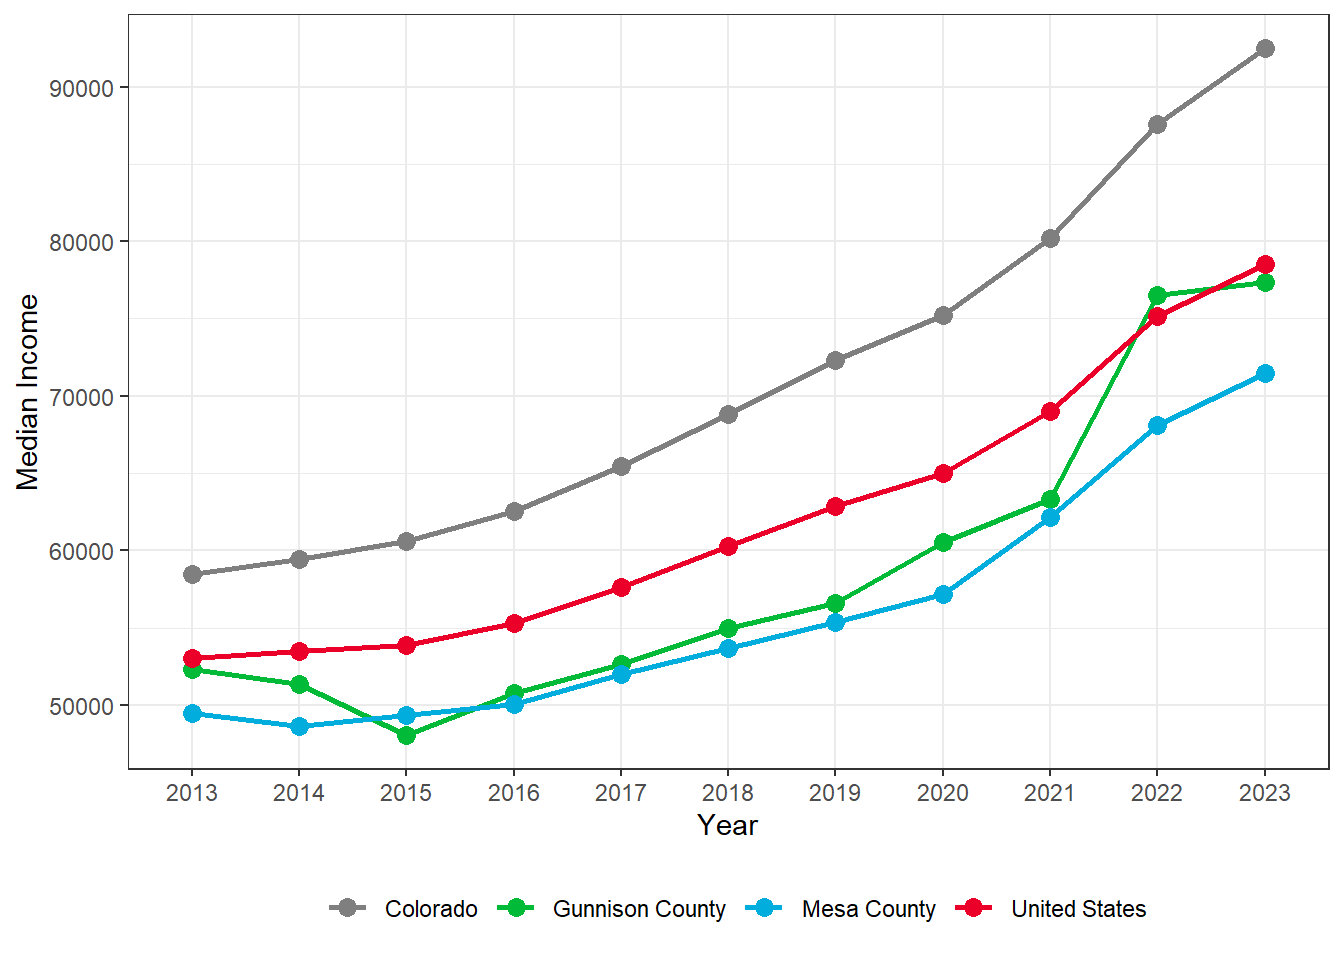
The median household income in Mesa County is lower than that of both Colorado and the U.S. Median incomes span a wide range across Mesa County communities, from $55,108 in Clifton to $106,201 in the rural western region containing Loma and Mack.
Median income rose notably in recent years, both for the county as a whole and in each of the various communities profiled in this report. The county-wide median income in 2022 was $68,077, a 27% increase from the median in 2018.
| Community | 2023 Median Income ($) | Change since 2018 |
|---|---|---|
| Grand Junction | $66,676 | 27.0% |
| Fruita | $77,680 | 32.7% |
| Redlands | $97,500 | 24.9% |
| Clifton | $54,301 | 25.0% |
| Fruitvale | $76,339 | 20.2% |
| Orchard Mesa | $76,173 | 51.7% |
| Palisade | $61,655 | 77.3% |
| Rural East | $89,151 | 34.1% |
| Rural South | $84,861 | 9.8% |
| Rural West | $103,949 | 50.9% |
Source: U.S. Census Bureau, American Community Survey 5-year estimates, Table: S1901; INCOME IN THE PAST 12 MONTHS 2023
Median Household Income
Median Household Income
MESA COUNTY
Median Household Income
| Region | 2013 | 2014 | 2015 | 2016 | 2017 | 2018 | 2019 | 2020 | 2021 | 2022 | 2023 |
|---|---|---|---|---|---|---|---|---|---|---|---|
| Colorado | 58,433 | 59,448 | 60,629 | 62,520 | 65,458 | 68,811 | 72,331 | 75,231 | 80,184 | 87,598 | 92,470 |
| Mesa County | 49,471 | 48,610 | 49,322 | 50,070 | 51,971 | 53,683 | 55,379 | 57,157 | 62,127 | 68,077 | 71,485 |
| United States | 53,046 | 53,482 | 53,889 | 55,322 | 57,652 | 60,293 | 62,843 | 64,994 | 69,021 | 75,149 | 78,538 |
Source: U.S. Census Bureau, American Community Survey 5-year estimates, Table: S1901; INCOME IN THE PAST 12 MONTHS 2023
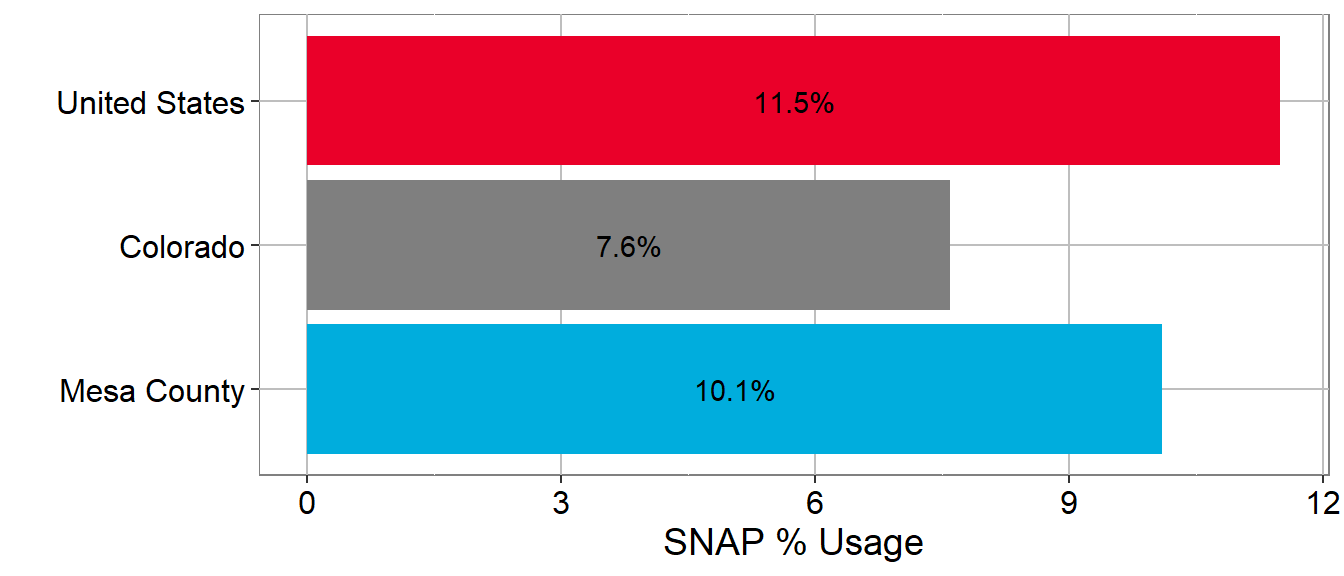
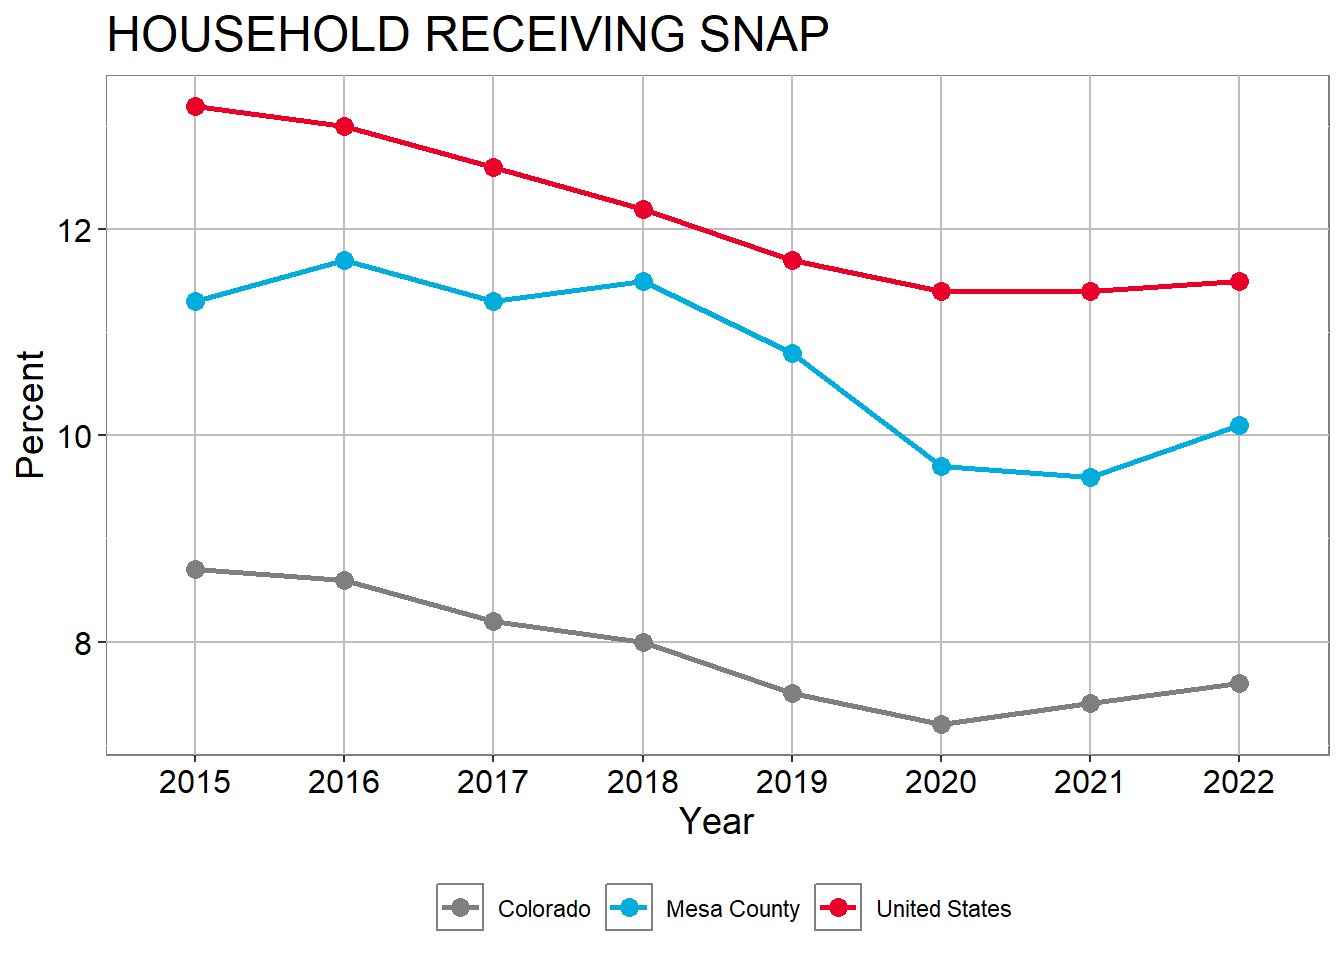
SNAP Usage
The Supplemental Nutrition Assistance Program, or SNAP, provides nutrition benefits to supplement the food budget of families in need so they can purchase healthy food and move towards self-sufficiency.
Household receiving snap
Household receiving snap
Household receiving snap
| Name | 2015 | 2016 | 2017 | 2018 | 2019 | 2020 | 2021 | 2022 | 2023 |
|---|---|---|---|---|---|---|---|---|---|
| Colorado | 8.7% | 8.6% | 8.2% | 8.0% | 7.5% | 7.2% | 7.4% | 7.6% | 8.0% |
| Mesa County | 11.3% | 11.7% | 11.3% | 11.5% | 10.8% | 9.7% | 9.6% | 10.1% | 10.6% |
| United States | 13.2% | 13.0% | 12.6% | 12.2% | 11.7% | 11.4% | 11.4% | 11.5% | 11.8% |
Source: U.S. Census Bureau, American Community Survey 5-year estimates, Table: S2201; FOOD STAMPS/SUPPLEMENTAL NUTRITION ASSISTANCE PROGRAM (SNAP) 2023
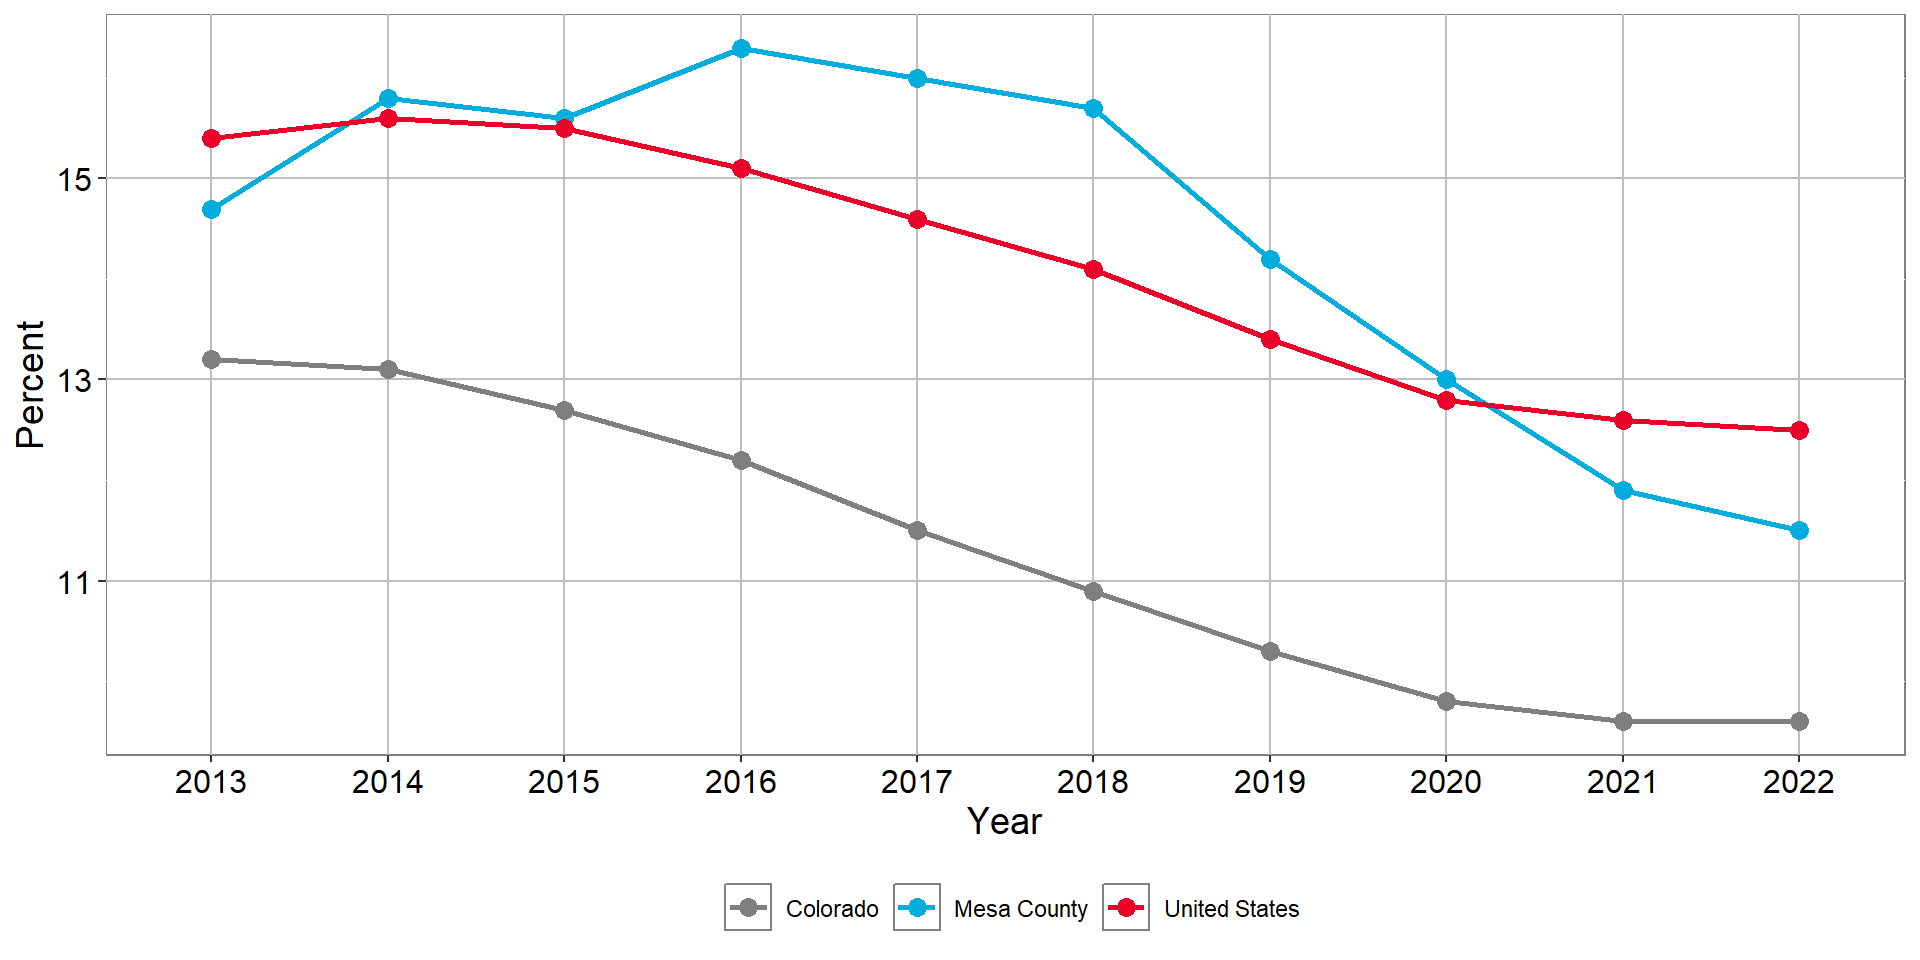
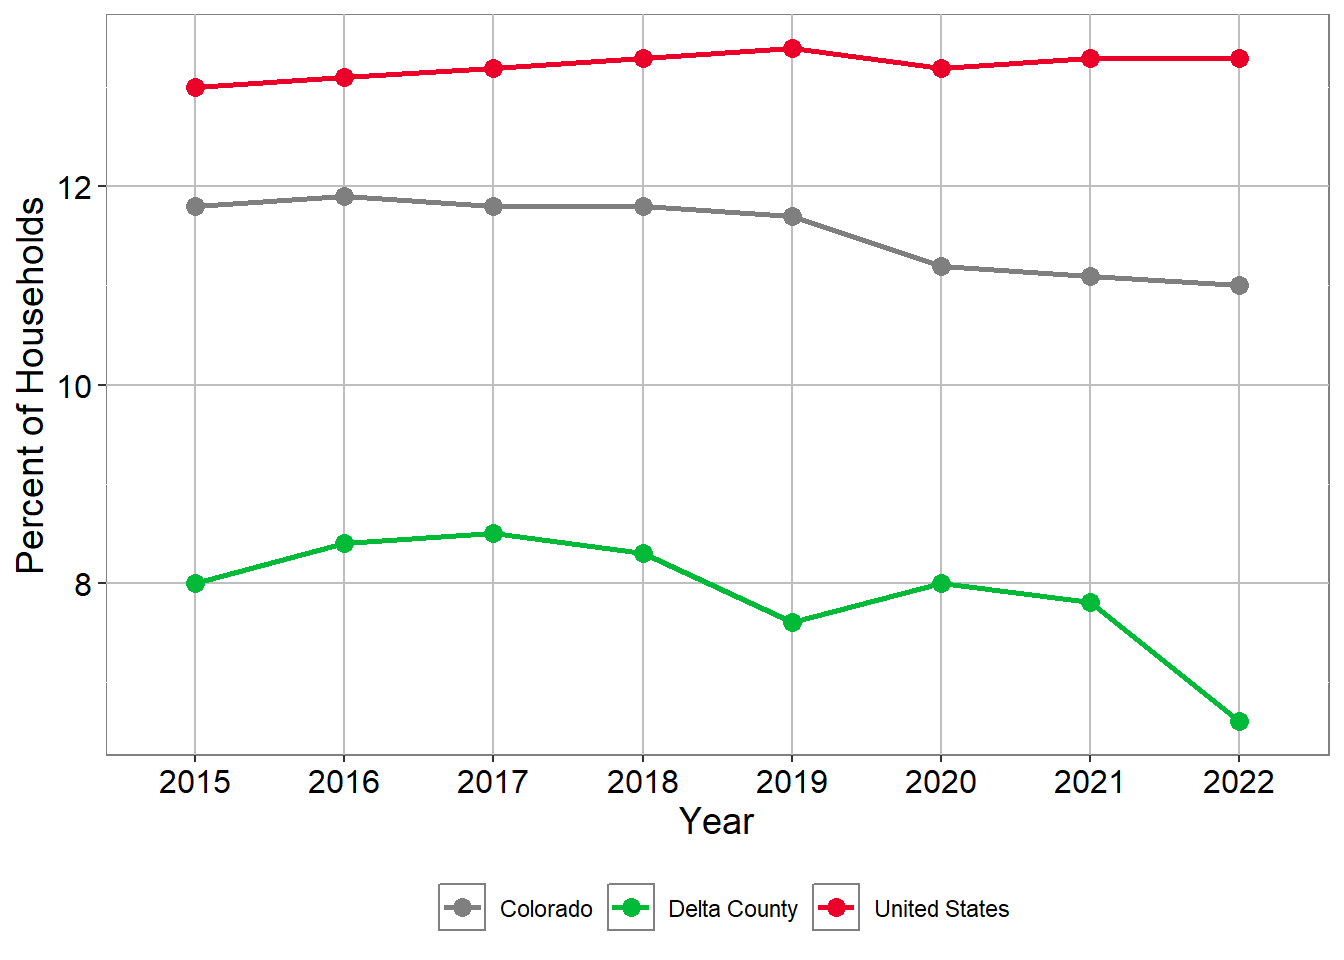
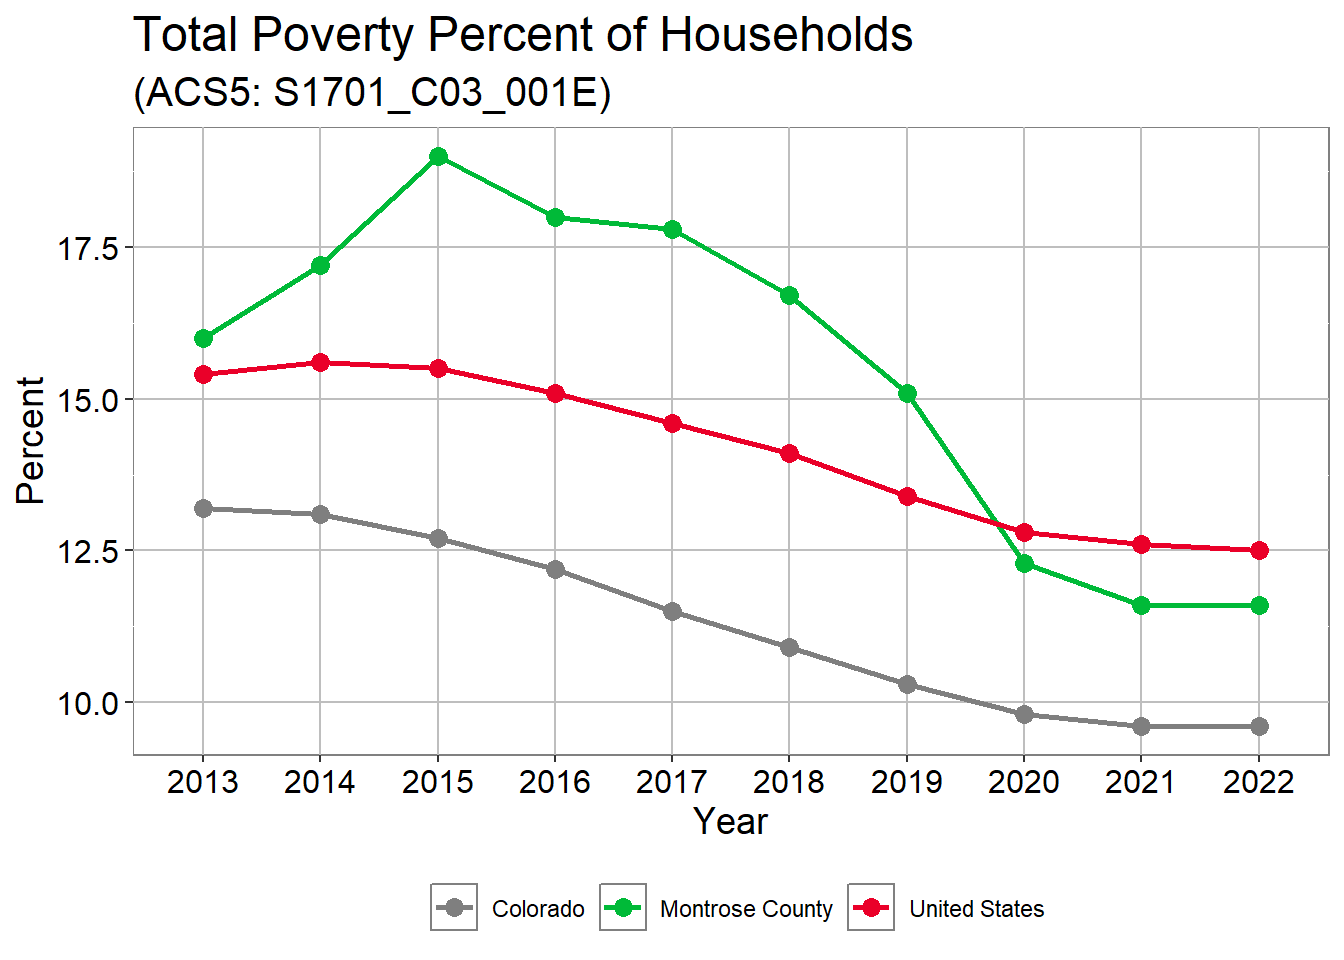
Poverty
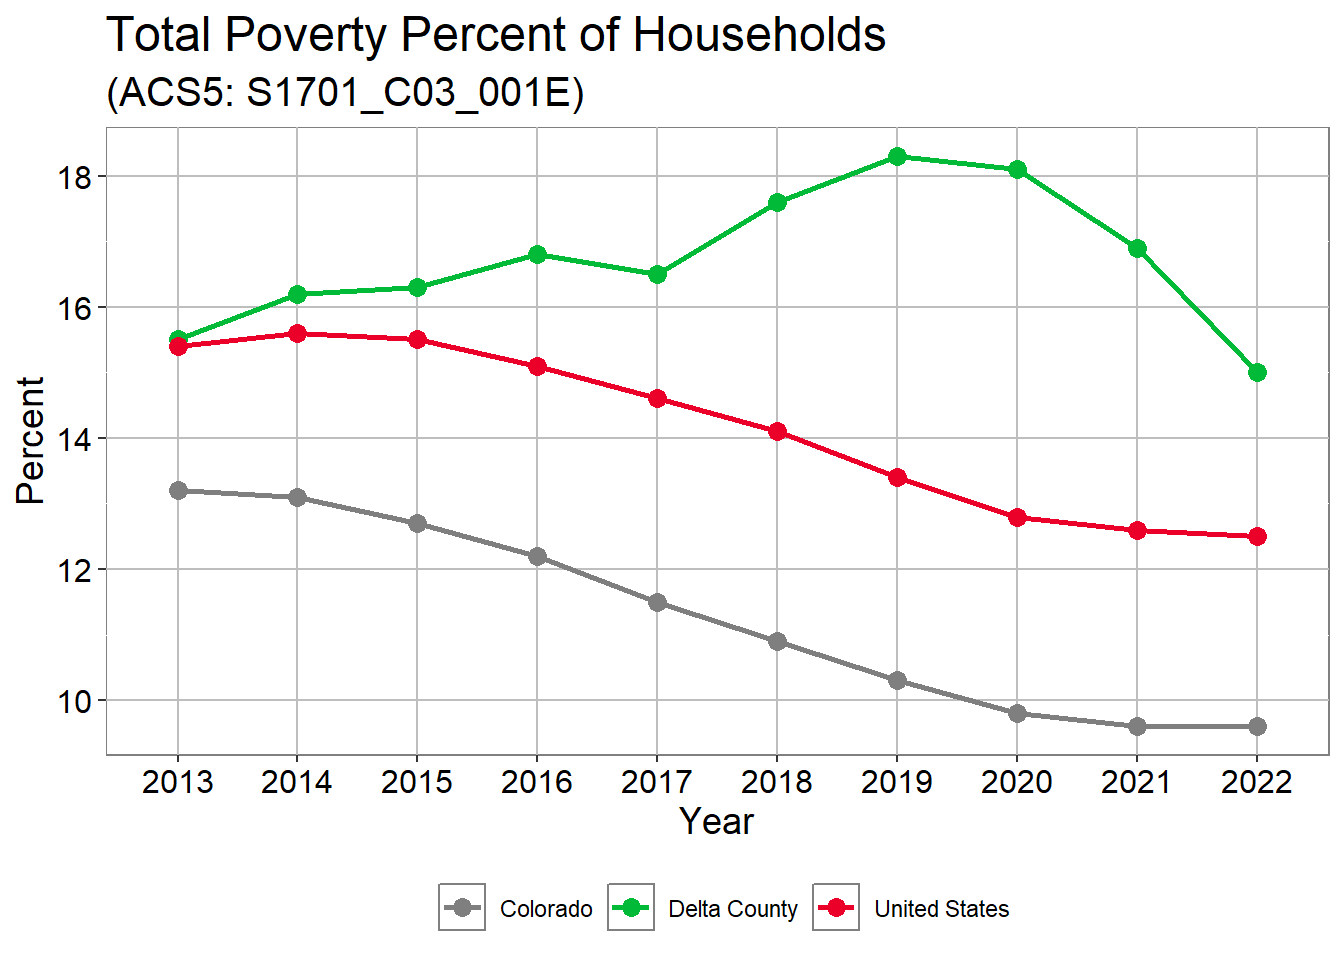
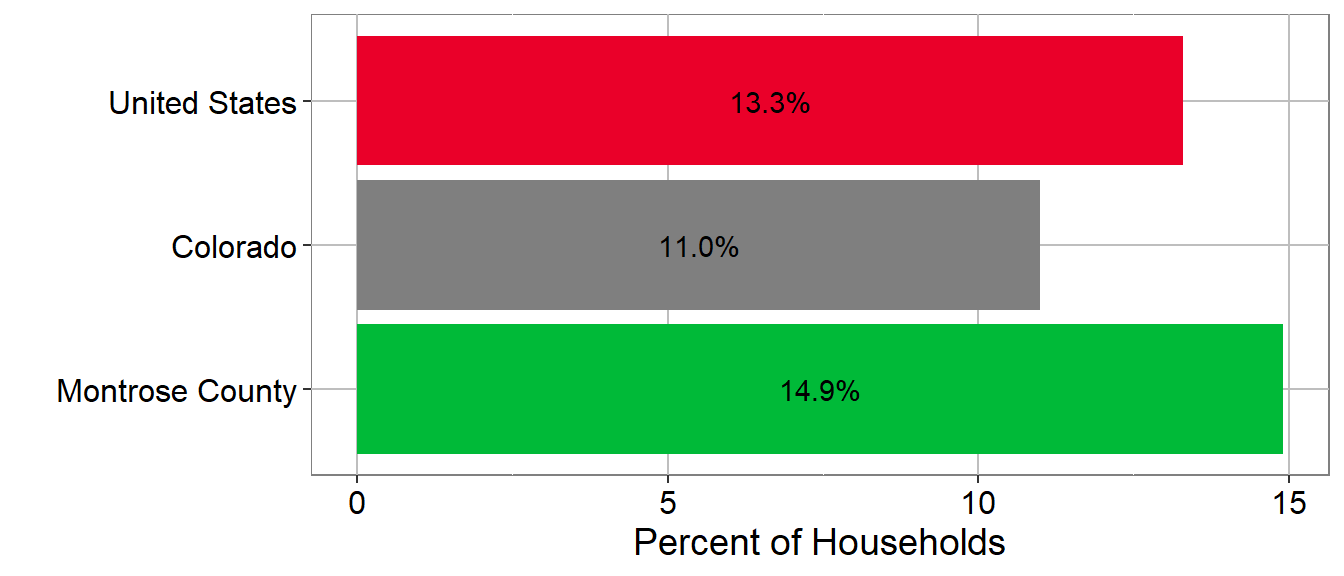
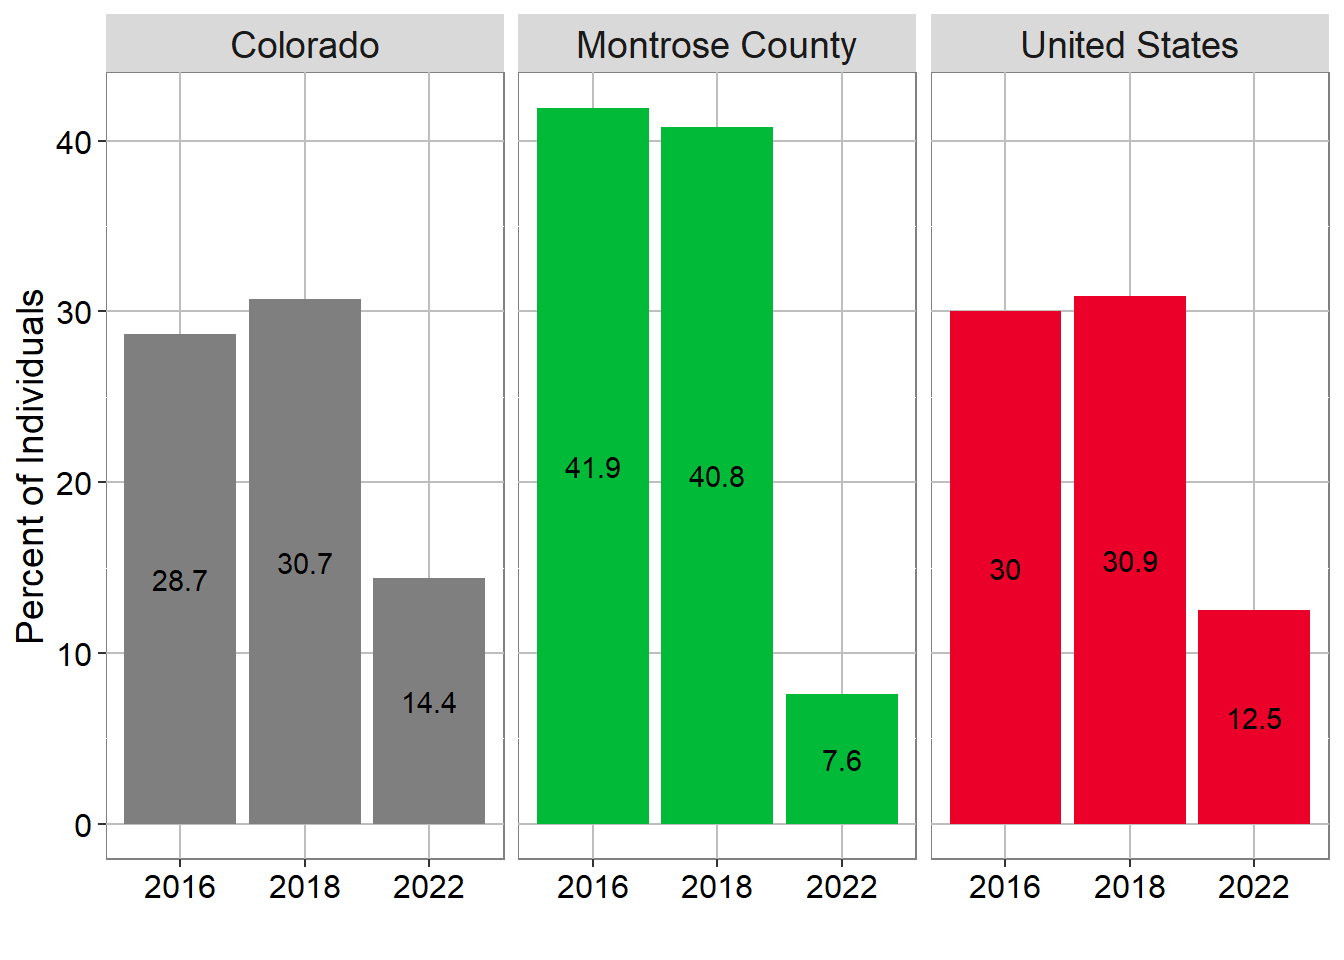
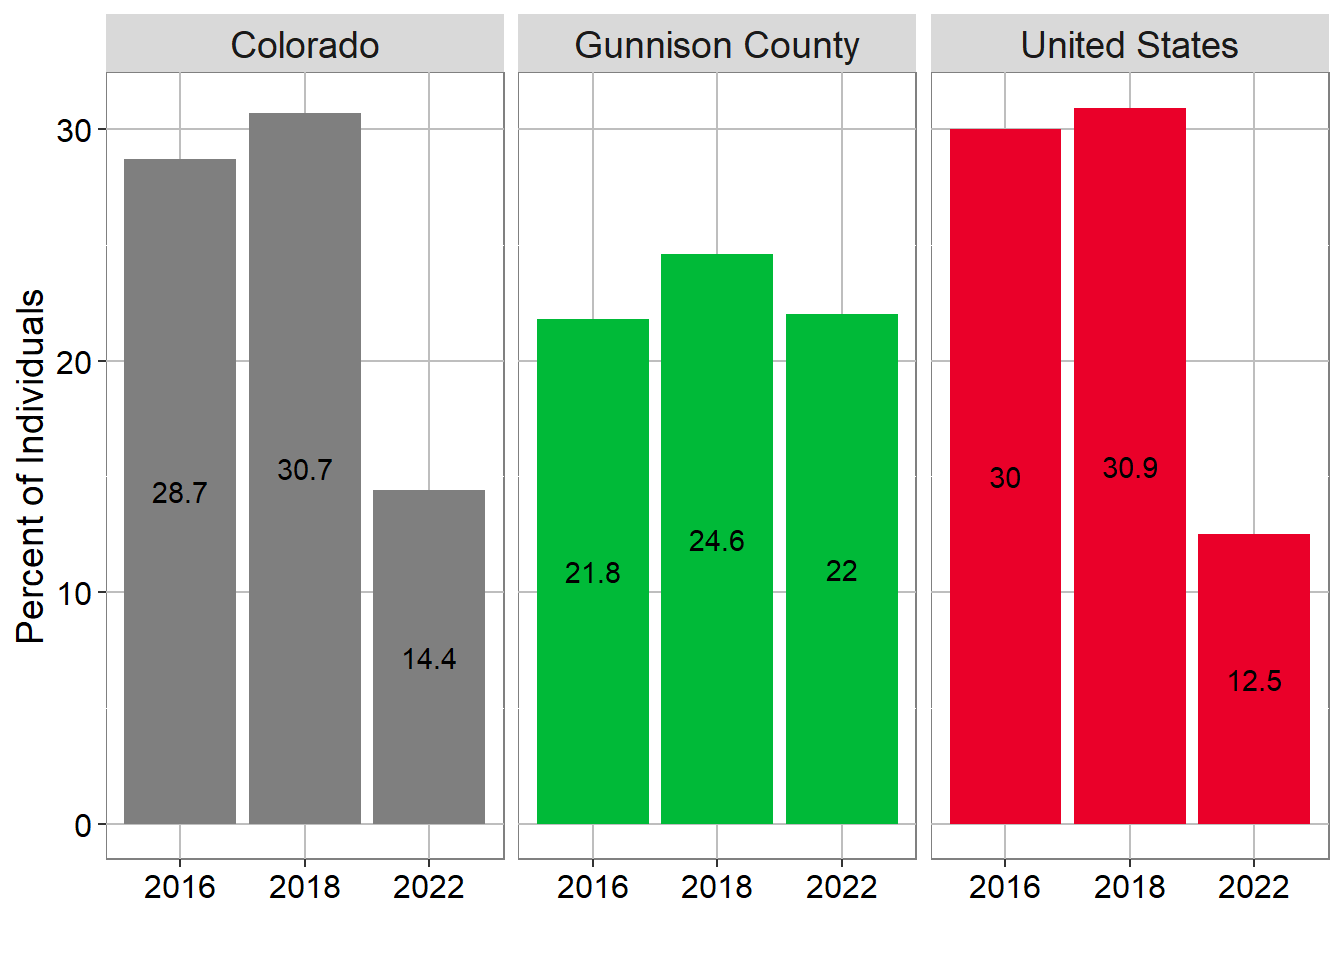
Nationwide, the prevalence of poverty has been slowly decreasing since about 2016. This has also been true for Mesa County, with the share of the population impacted by poverty dropping from nearly 16% in 2018 to nearly 12% in 2022. See Poverty section in Economic Stabilityfor an in depth analysis on poverty in Mesa County.
TOTAL POVERTY PERCENT OF HOUSEHOLDS
TOTAL POVERTY PERCENT OF HOUSEHOLDS
| Region | 2013 | 2014 | 2015 | 2016 | 2017 | 2018 | 2019 | 2020 | 2021 | 2022 | 2023 |
|---|---|---|---|---|---|---|---|---|---|---|---|
| Colorado | 13.2% | 13.1% | 12.7% | 12.2% | 11.5% | 10.9% | 10.3% | 9.8% | 9.6% | 9.6% | 9.4% |
| Mesa County | 14.7% | 15.8% | 15.6% | 16.3% | 16.0% | 15.7% | 14.2% | 13.0% | 11.9% | 11.5% | 11.2% |
| United States | 15.4% | 15.6% | 15.5% | 15.1% | 14.6% | 14.1% | 13.4% | 12.8% | 12.6% | 12.5% | 12.4% |
Source: U.S. Census Bureau, American Community Survey 5-year estimates, Table: S1701; POVERTY STATUS IN THE PAST 12 MONTHS 2023
Housing Cost Burden
 Price of Housing
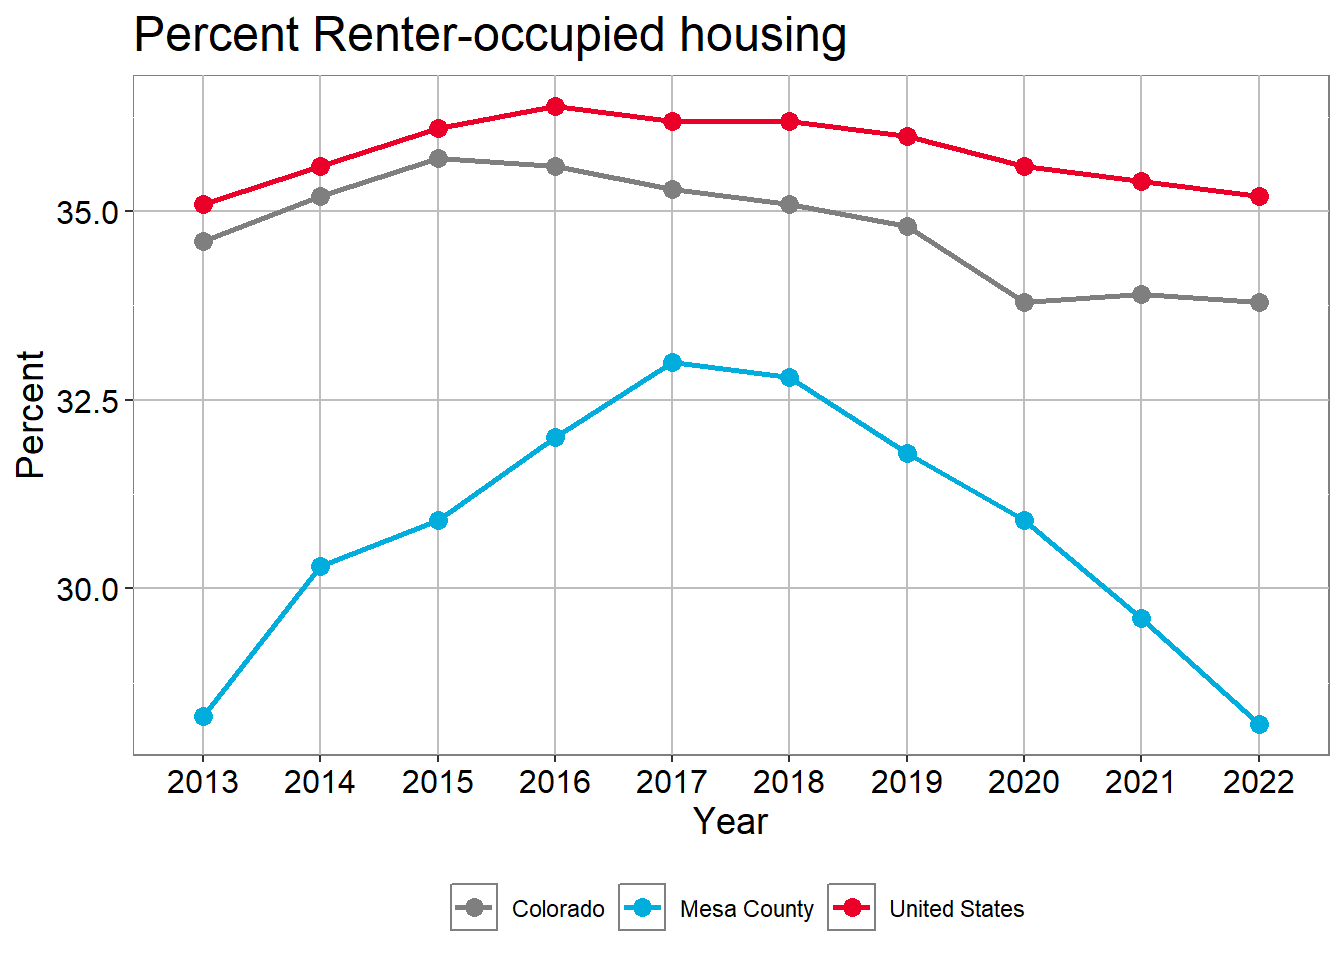
The price of housing in Mesa County, both owning and renting, has increased significantly in the last 7 years relative to the median income. For more information about trends in housing costs, See the Housing section of Neighborhood and Built Enviorment for more information.
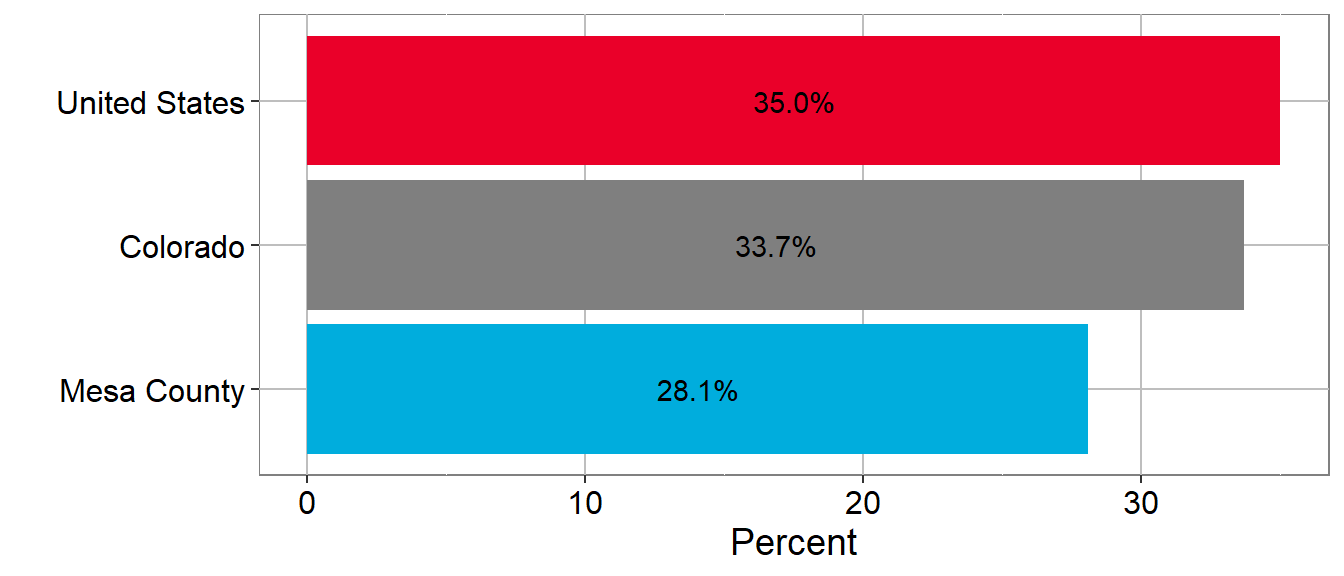
Renters pay a higher percentage of their income for housing expenses than homeowners in every community in Mesa County except the Rural South region. Nearly half of renters throughout the county are experiencing a housing cost burden, defined as paying 30% or more of their income towards rent.
Renter-occupied housing
Renter-occupied housing
Renter-occupied housing
| 2013 | 2014 | 2015 | 2016 | 2017 | 2018 | 2019 | 2020 | 2021 | 2022 | 2023 | |
|---|---|---|---|---|---|---|---|---|---|---|---|
| Mesa County | 28.3% | 30.3% | 30.9% | 32.0% | 33.0% | 32.8% | 31.8% | 30.9% | 29.6% | 28.2% | 28.1% |
| Colorado | 34.6% | 35.2% | 35.7% | 35.6% | 35.3% | 35.1% | 34.8% | 33.8% | 33.9% | 33.8% | 33.7% |
| United States | 35.1% | 35.6% | 36.1% | 36.4% | 36.2% | 36.2% | 36.0% | 35.6% | 35.4% | 35.2% | 35.0% |
Source: U.S. Census Bureau, American Community Survey 5-year estimates, Table: DP04; SELECTED HOUSING CHARACTERISTICS 2023
Percent of Household that are housing cost burden. (2023)
| Region | Percent Renters | Total Household Burdened | Renter household Burdened |
|---|---|---|---|
| Mesa County | 28.1% | 31.6% | 49.1% |
| Colorado | 33.7% | 33.4% | 52.2% |
| United States | 35.0% | 31.7% | 50.4% |
Source: U.S. Census Bureau, American Community Survey 5-year estimates, Table: DP04; SELECTED HOUSING CHARACTERISTICS 2023
Communities
Fast Facts: Communities in Mesa County (2023)
| Population | % of Mesa County Population. | % Hispanic Residents | Median Age | % Completed High School | % Completed Bachelors+ | Unemployment | Median Income | |
|---|---|---|---|---|---|---|---|---|
| Mesa County | 157,316 | 100.0% | 15.2% | 41 | 92.4% | 30.6% | 5.1% | $71,485 |
| Clifton | 19,746 | 12.6% | 25.4% | 35 | 83.9% | 11.8% | 9.5% | $54,301 |
| Fruita | 13,578 | 8.6% | 9.4% | 41 | 94.5% | 31.1% | 2.0% | $77,680 |
| Fruitvale | 7,998 | 5.1% | 13.1% | 42 | 93.6% | 27.1% | 3.5% | $76,339 |
| Grand Junction | 67,027 | 42.6% | 16.6% | 40 | 93.2% | 36.1% | 4.5% | $66,676 |
| Orchard Mesa | 6,597 | 4.2% | 9.3% | 45 | 94.1% | 21.2% | 6.2% | $76,173 |
| Palisade | 2,580 | 1.6% | 12.2% | 51 | 90.5% | 30.4% | 6.2% | $61,655 |
| Redlands | 8,771 | 5.6% | 7.4% | 48 | 97.5% | 47.9% | 5.2% | $97,500 |
| Rural West | 8,222 | 5.2% | 9.7% | 43 | 95.0% | 33.4% | 6.9% | $103,949 |
| Rural East | 3,602 | 2.3% | 7.5% | 41 | 93.4% | 25.8% | 6.3% | $89,151 |
| Rural South | 4,946 | 3.1% | 5.0% | 55 | 96.9% | 32.6% | 1.3% | $84,861 |
Source: Census Bureau, ACS 5-year estimates, Tables: B01001, B03003, B01002, S1501, S2301, and S1901 2023
Mesa County (2023)
Fast Facts
- Median age: 40.8
- Total population: 157,316 (2023)
- Hispanic or Latino: 15.2%
- Educational attainment for adults 25 and over
- High school diploma: 92.4%
- Bachelor’s degree or higher: 30.6%
- Unemployment rate (2023) 5.1%
- Median household income: $71,485
Household Composition
- Total households: 64,559
- Households with children: 27.0% (17,431 households)
- Households with resident age 60 or over: 46.5% (30,020 households)
- Single female households with children: 5.0% (3,211 households)
- Households that rent 28.1%
Housing Burden
Households that are housing burden are defined to be when more than 30% of income is used for housing.
- All Households: 31.6%
- Rentors: 49.1% (8,347)
- Owners: 25.2% (11,696)
Source: U.S. Census Bureau, American Community Survey 5-year estimates 2023
Population Demographics and Economic Characteristics
The total population in Mesa County has grown every year since 2015, by about 1200 residents each year. Over this period the median age increased to 40.8 in 2023. This is likely a result of lower birth rates and a heavy prevalence of older adults moving to the area.
As of 2023, 46.5% of all households include residents 60 and older and 27.0% include children. 5.0% of all households are female single parent households. The ratio of single female households with children to other households with children is 1 to 4.4 households.
The share of the population who identify as Hispanic or Latino is also growing, up to 15.2% in 2023. This will likely continue given that the youngest generations are the most diverse.
The median household income has risen rapidly in recent years, increasing by 29% since 2019. In the years prior, 2015 to 2018, the median income had only increased by 12%. This trend was likely impacted by the addition of more well-resourced households moving to the area, as well as COVID-19 pandemic response programs and rapidly increasing inflation.
Unemployment also dropped in recent years, from 6.9 during the pandemic to 5.1 percent in 2023 (American Community Census Table S2301).
Clifton (2023)
Fast Facts
- Total Population: 19,746
- Hispanic/Latino: 25.4%
- Median Age: 35.2
- This increased from 32.8 years in 2019 indicating a somewhat aging population.
- Educational Attainment (Adults 25 and older)
- High School Diploma: 83.9%
- Bachelor’s Degree or higher: 11.8%
- Employment Status: Unemployment in 2023 9.5%
- Median Income: increased from $43,452 in 2019 to $54,301 in 2023.
- $17,184 less than Mesa County’s median income. Median incomes increased from $43,452 in 2019 to $54,301 in 2023.
Household Composition
- Total households: 7,598
- Households with children: 36.0% (2,735 households)
- Households with resident age 60 or over: 35.3% (2,682 households)
- Single female households with children: 10.5% (794 households)
- Households that rent 27.7%
Housing Burden
Households that are housing burden are defined to be when more than 30% of income is used for housing.
- All Households: 40.2%
- Rentors: 51.6% (1,033)
- Owners: 36.0% (1,976)
Source: U.S. Census Bureau, American Community Survey 5-year estimates 2023
Population Demographics and Economic Characteristics
Clifton is an unincorporated community to the east of the City of Grand Junction. It has the second largest population in the county, accounting for 12.6% of the county’s total population.
This community has the lowest median age at 35.2, with a high concentration of households with children, about a third of which are female single parent households. This area also has the highest concentration of Hispanic or Latino residents at 25.4%, and that share has increased in recent years.
Clifton has the lowest median household income in the county, 24.0% less than the county median. Clifton has the smallest share of adults with a bachelor’s degree at only 11.8%. This community also has the highest unemployment rate at 9.5% compared to 5.1% countywide. Clifton has the highest share in the county with housing cost burden at 51.6%.
City of Fruita (2023)
Fast Facts
- Total Population: 13,578
- Hispanic/Latino: 9.4%
- Median Age: 40.8
- This increased from 38.4 years in 2019 indicating a somewhat aging population.
- Educational Attainment (Adults 25 and older)
- High School Diploma: 94.5%
- Bachelor’s Degree or higher: 31.1%
- Employment Status: Unemployment in 2023 2.0%
- Median Income: increased from $58,531 in 2019 to $77,680 in 2023.
- $6,195 more than Mesa County’s median income. Median incomes increased from $58,531 in 2019 to $77,680 in 2023.
Household Composition
- Total households: 5,146
- Households with children: 36.6% (1,883 households)
- Households with resident age 60 or over: 44.7% (2,300 households)
- Single female households with children: 4.0% (208 households)
- Households that rent 19.5%
Housing Burden
Households that are housing burden are defined to be when more than 30% of income is used for housing.
- All Households: 32.9%
- Rentors: 46.4% (364)
- Owners: 30.3% (1,255)
Source: U.S. Census Bureau, American Community Survey 5-year estimates 2023
Population Demographics and Economic Characteristics
The City of Fruita, located on the western side of the Grand Valley, accounts for 9% of the county’s population. Fruita has the greatest concentration of households with children in the county, and that share has increased notably in recent years. The city also has one of the lowest concentrations of households that include older adults.
In 2023 Fruita had one of the lowest unemployment rates in the county, and the median household income had increased more rapidly than the county median.
Fruitvale (2023)
Fast Facts
- Total Population: 7,998
- Hispanic/Latino: 13.1%
- Median Age: 41.6
- This increased from 40.6 years in 2019 indicating a somewhat aging population.
- Educational Attainment (Adults 25 and older)
- High School Diploma: 93.6%
- Bachelor’s Degree or higher: 27.1%
- Employment Status: Unemployment in 2023 3.5%
- Median Income: increased from $63,509 in 2019 to $76,339 in 2023.
- $4,854 more than Mesa County’s median income. Median incomes increased from $63,509 in 2019 to $76,339 in 2023.
Household Composition
- Total households: 3,332
- Households with children: 26.3% (876 households)
- Households with resident age 60 or over: 50.8% (1,693 households)
- Single female households with children: 3.5% (115 households)
- Households that rent 7.7%
Housing Burden
Households that are housing burden are defined to be when more than 30% of income is used for housing.
- All Households: 24.6%
- Rentors: 21.2% (48)
- Owners: 24.9% (766)
Source: U.S. Census Bureau, American Community Survey 5-year estimates 2023
Population Demographics and Economic Characteristics
Fruitvale is a small community located between Grand Junction and Clifton, accounting for about 5.1% of the county’s total population.
The median household income has historically been higher than the county median; however, this gap has diminished in recent years. As of 2023, Fruitvale’s median income was only 6.8% higher than the county’s, dropping from 17% higher in 2018.
This community has the lowest concentration of households who rent, at only 7.7%, and the lowest concentration (21.2%) of those who are paying 30% or more of their income towards housing.
City of Grand Junction (2023)
Fast Facts
- Total Population: 67,027
- Hispanic/Latino: 16.6%
- Median Age: 40
- This increased from 37.1 years in 2019 indicating a somewhat aging population.
- Educational Attainment (Adults 25 and older)
- High School Diploma: 93.2%
- Bachelor’s Degree or higher: 36.1%
- Employment Status: Unemployment in 2023 4.5%
- Median Income: increased from $52,504 in 2019 to $66,676 in 2023.
- $4,809 less than Mesa County’s median income. Median incomes increased from $52,504 in 2019 to $66,676 in 2023.
Household Composition
- Total households: 29,037
- Households with children: 24.0% (6,969 households)
- Households with resident age 60 or over: 44.8% (13,009 households)
- Single female households with children: 4.8% (1,387 households)
- Households that rent 37.2%
Housing Burden
Households that are housing burden are defined to be when more than 30% of income is used for housing.
- All Households: 31.8%
- Rentors: 47.8% (4,937)
- Owners: 22.7% (4,137)
Source: U.S. Census Bureau, American Community Survey 5-year estimates 2023
Population Demographics and Economic Characteristics
Grand Junction is the most populous city in Mesa County, accounting for 42.6% of the county’s population. One of the unique characteristics of this city is the presence of a university. Many population characteristics are impacted by student lifestyle and preferences. For example, the median age in Grand Junction is among the lowest in the county, and the city has the highest concentration of residents with college degrees.
Grand Junction’s median household income increased between r YEAR-4 and r YEAR, similar to the overall county increase. The city has one of the highest concentrations of Hispanic or Latino residents in the county at 16.6% . It also has the highest concentration in the county of households who rent their home, at 37.2% . Among renters, 47.8% are paying more than 30% of their income towards monthly rent.
Orchard Mesa (2023)
Fast Facts
- Total Population: 6,597
- Hispanic/Latino: 9.3%
- Median Age: 44.6
- This increased from 41.9 years in 2019 indicating a somewhat aging population.
- Educational Attainment (Adults 25 and older)
- High School Diploma: 94.1%
- Bachelor’s Degree or higher: 21.2%
- Employment Status: Unemployment in 2023 6.2%
- Median Income: increased from $50,227 in 2019 to $76,173 in 2023.
- $4,688 more than Mesa County’s median income. Median incomes increased from $50,227 in 2019 to $76,173 in 2023.
Household Composition
- Total households: 2,568
- Households with children: 25.2% (647 households)
- Households with resident age 60 or over: 50.4% (1,294 households)
- Single female households with children: 4.9% (127 households)
- Households that rent 15.2%
Housing Burden
Households that are housing burden are defined to be when more than 30% of income is used for housing.
- All Households: 23.4%
- Rentors: 53.6% (176)
- Owners: 18.9% (411)
Source: U.S. Census Bureau, American Community Survey 5-year estimates 2023
Population Demographics and Economic Characteristics
Orchard Mesa is a small community located on the southeast side of the City of Grand Junction, accounting for about 4.2% of the county’s total population. This community has a higher concentration of households with children (25.2%), 4.9% of which are female single parent households.
The median household income in Orchard Mesa 76173 is slightly lower than the county median 71485, and though it has increased in recent years, it has increased at a slower rate.
A comparatively smaller share of these households are renters at only15.2%. However, for those who rent, housing cost burden is high, at 53.6%.
Town of Palisade (2023)
Fast Facts
- Total Population: 2,580
- Hispanic/Latino: 12.2%
- Median Age: 50.7
- This increased from 38.8 years in 2019 indicating a somewhat aging population.
- Educational Attainment (Adults 25 and older)
- High School Diploma: 90.5%
- Bachelor’s Degree or higher: 30.4%
- Employment Status: Unemployment in 2023 6.2%
- Median Income: increased from $34,779 in 2019 to $61,655 in 2023.
- $9,830 less than Mesa County’s median income. Median incomes increased from $34,779 in 2019 to $61,655 in 2023.
Household Composition
- Total households: 1,179
- Households with children: 17.2% (203 households)
- Households with resident age 60 or over: 59.7% (704 households)
- Single female households with children: 4.7% (55 households)
- Households that rent 30.1%
Housing Burden
Households that are housing burden are defined to be when more than 30% of income is used for housing.
- All Households: 28.0%
- Rentors: 52.8% (187)
- Owners: 17.3% (143)
Source: U.S. Census Bureau, American Community Survey 5-year estimates 2023
Population Demographics and Economic Characteristics
The Town of Palisade, known for its peaches and wine, is a small community located on the eastern side of the Grand Valley and makes up about 1.6% of the county’s population.
The area has one of the highest median ages in the county with a high concentration of households with older adults and the lowest concentration of households with children.
Palisade also has one of the lowest median household incomes in the county, 13.8% lower than the county median.
Redlands (2023)
Fast Facts
- Total Population: 8,771
- Hispanic/Latino: 7.4%
- Median Age: 47.8
- This decreased from 51.5 years in 2019 indicating a somewhat more youthful population.
- Educational Attainment (Adults 25 and older)
- High School Diploma: 97.5%
- Bachelor’s Degree or higher: 47.9%
- Employment Status: Unemployment in 2023 5.2%
- Median Income: increased from $78,077 in 2019 to $97,500 in 2023.
- $26,015 more than Mesa County’s median income. Median incomes increased from $78,077 in 2019 to $97,500 in 2023.
Household Composition
- Total households: 3,486
- Households with children: 24.5% (854 households)
- Households with resident age 60 or over: 59.9% (2,088 households)
- Single female households with children: 1.5% (53 households)
- Households that rent 10.1%
Housing Burden
Households that are housing burden are defined to be when more than 30% of income is used for housing.
- All Households: 26.4%
- Rentors: 54.4% (191)
- Owners: 23.3% (730)
Source: U.S. Census Bureau, American Community Survey 5-year estimates 2023
Population Demographics and Economic Characteristics
The Redlands is a small community located along the southwest side of the Colorado River, accounting for 5.6% of the county’s population.
Aside from rural regions, the Redlands community has the highest median household income in the county, 36.4% higher than the county median. This community also has the highest concentration of adults with a bachelor’s degree and one of the highest median ages.
The Redlands has one of the lowest unemployment rates in the county and one of the lowest shares of households that rent at only10.1%.
Rural West, East, South (2023)
Population Demographics and Economic Characteristics
Residents in rural communities account for about 10.7% of the total population of Mesa County. These communities are an important part of Mesa County’s culture and character.
Here we review key characteristics of three rural regions in the east, west, and south of Mesa County. The rural regions include the communities of De Beque, Collbran, and Mesa in the east, Whitewater and Gateway in the south, and Loma and Mack in the west.
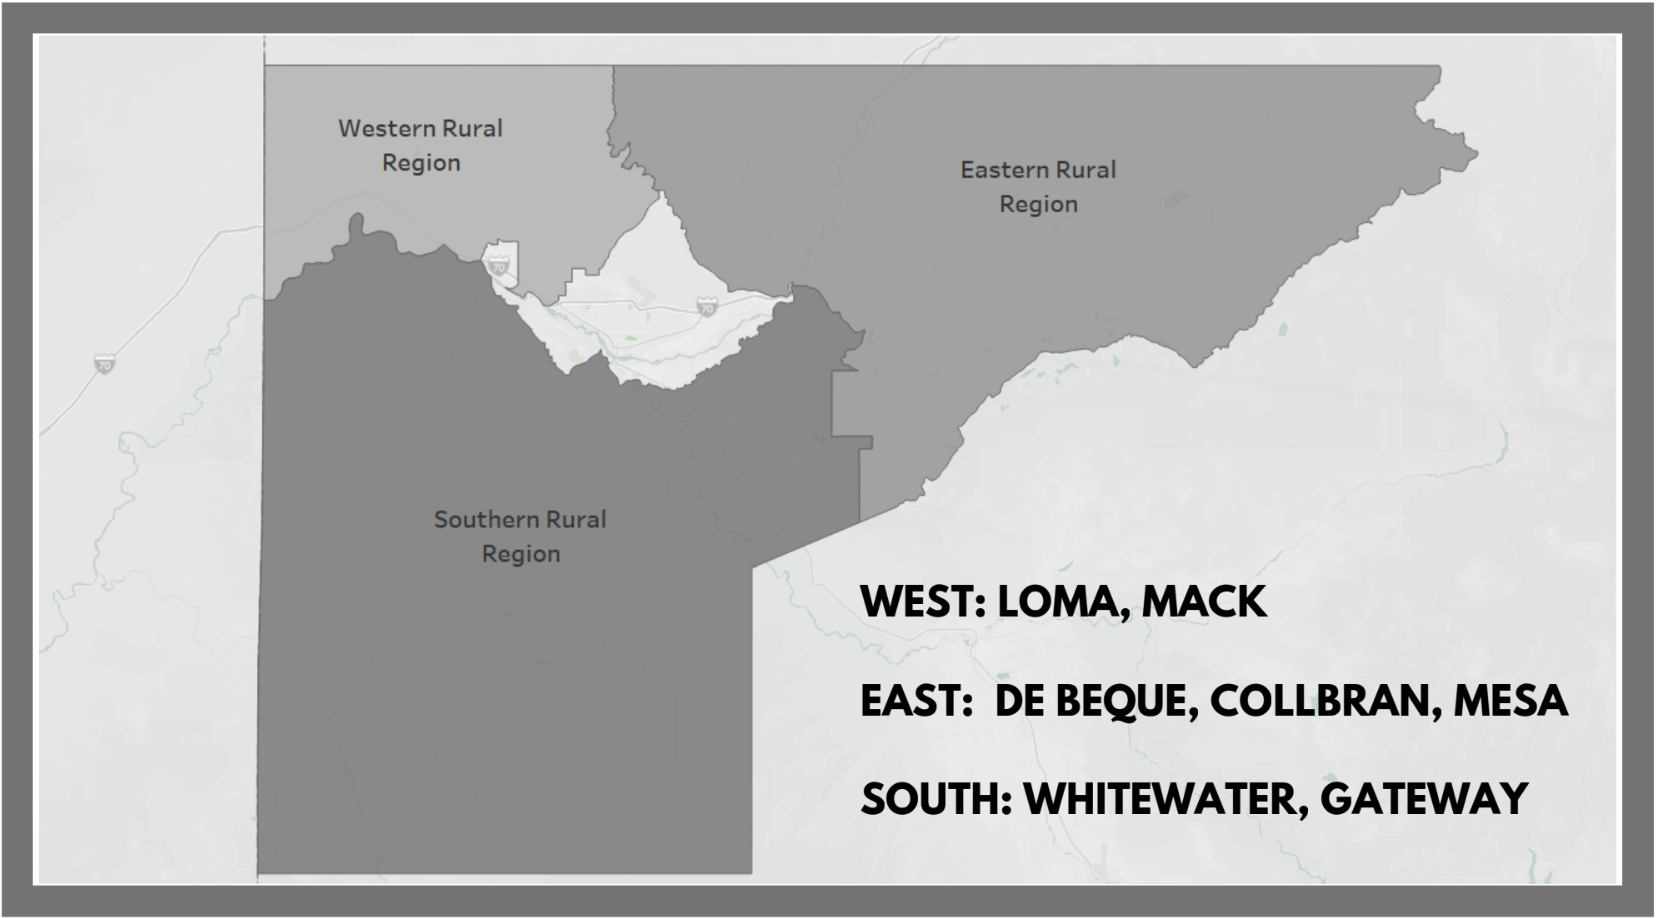
In general, residents in rural areas tend to be older, and have higher household incomes compared to the county overall. As of 2023, 58.4% of rural households included older adults, an increase from previous years. In all three regions the median income was higher than the county median.
Renting is less prevalent in rural areas at only 16% in 2022, though this was an increase from previous years, and rental costs represent a smaller financial burden among rural residents than among county residents as a whole.
Population
| East | South | West | |
|---|---|---|---|
| Estimate | 3,602 | 4,946 | 8,222 |
| Percent of Mesa County Population | 2.3% | 3.1% | 5.2% |
| Hispanic/Latino residents | 7.5% | 5.0% | 9.7% |
Median Age
| Region | 2019 | 2023 | |
|---|---|---|---|
| East | 43.8 | 41.2 | More youthful |
| South | 55.6 | 54.9 | More youthful |
| West | 45.1 | 43.1 | More youthful |
Educational Attainment (Adults 25 and older)
| East | South | West | |
|---|---|---|---|
| High School Diploma | 93.4% | 96.9% | 95.0% |
| Bachelor’s Degree or higher | 74.2% | 67.4% | 66.6% |
Median household incomes
| region | from | to | change |
|---|---|---|---|
| East | $66,484 | $89,151 | More |
| South | $77,261 | $84,861 | More |
| West | $68,864 | $103,949 | More |
Unemployment
| East | South | West | |
|---|---|---|---|
| Unemployment (2023) | 6.3% | 1.3% | 6.9% |
Household Composition
| Household type | East | South | West |
|---|---|---|---|
| Total Households | 1298 | 2209 | 3055 |
| Households with children | 31.7% | 17.1% | 25.2% |
| Includes as 60+ | 50.6% | 64.0% | 50.2% |
| Single female households with children: | 3.1% | 0.0% | 0.0% |
Percent of Households that rent
| East | South | West | |
|---|---|---|---|
| Percent that Rent | 13.9% | 15.7% | 19.3% |
Housing burden (more than 30% of income in 2023 )
| East | South | West | |
|---|---|---|---|
| Total | 33.4% | 28.2% | 25.2% |
| Owner | 33.0% | 27.5% | 23.5% |
| Renter | 36.8% | 33.2% | 32.9% |
Nearby Counties
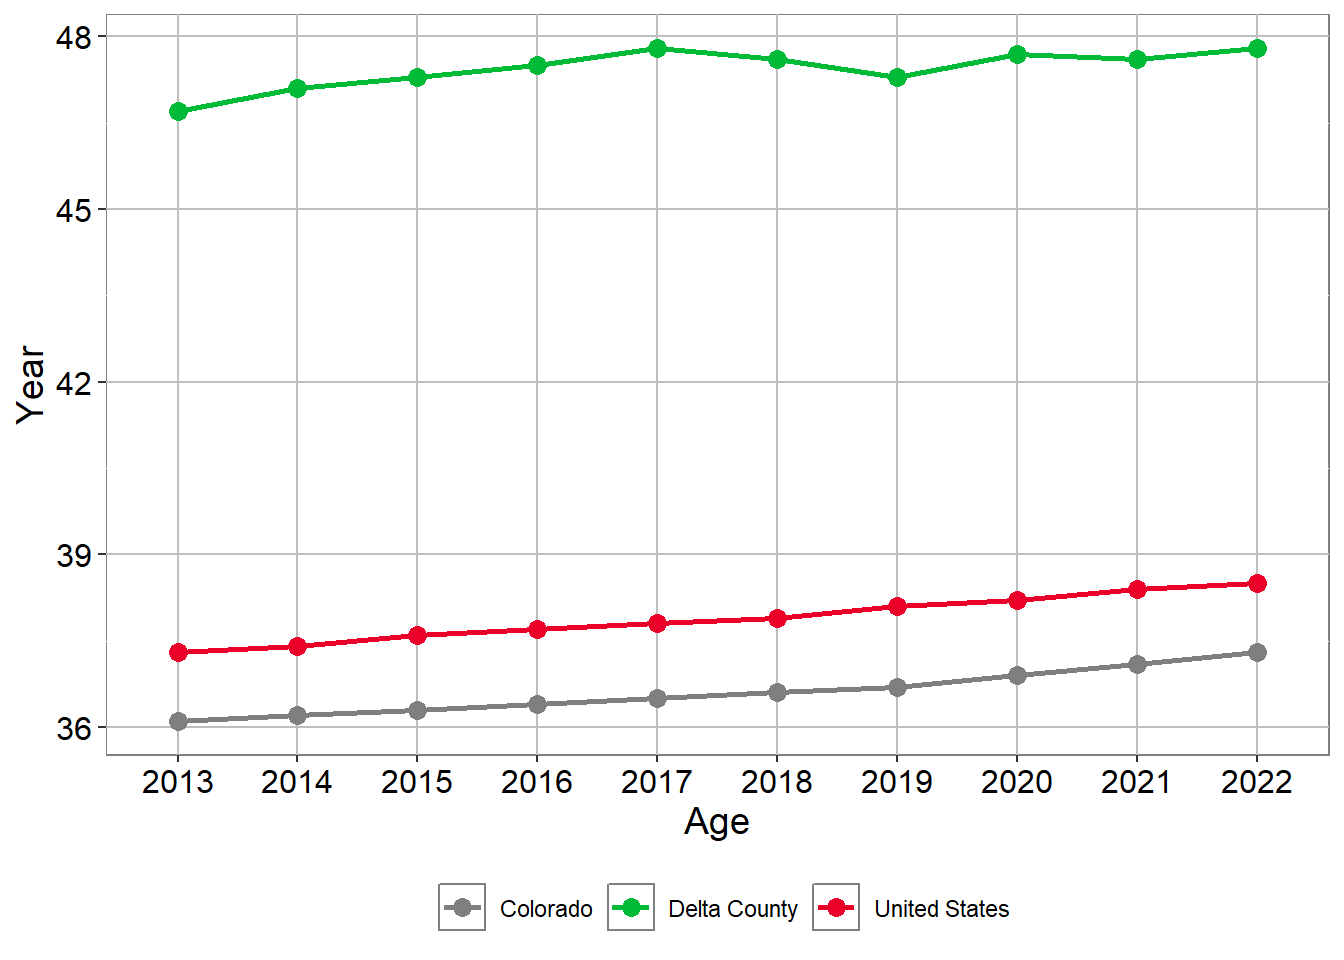
Delta County
2023 Summary
Hispanic/Latino population: 14.2%
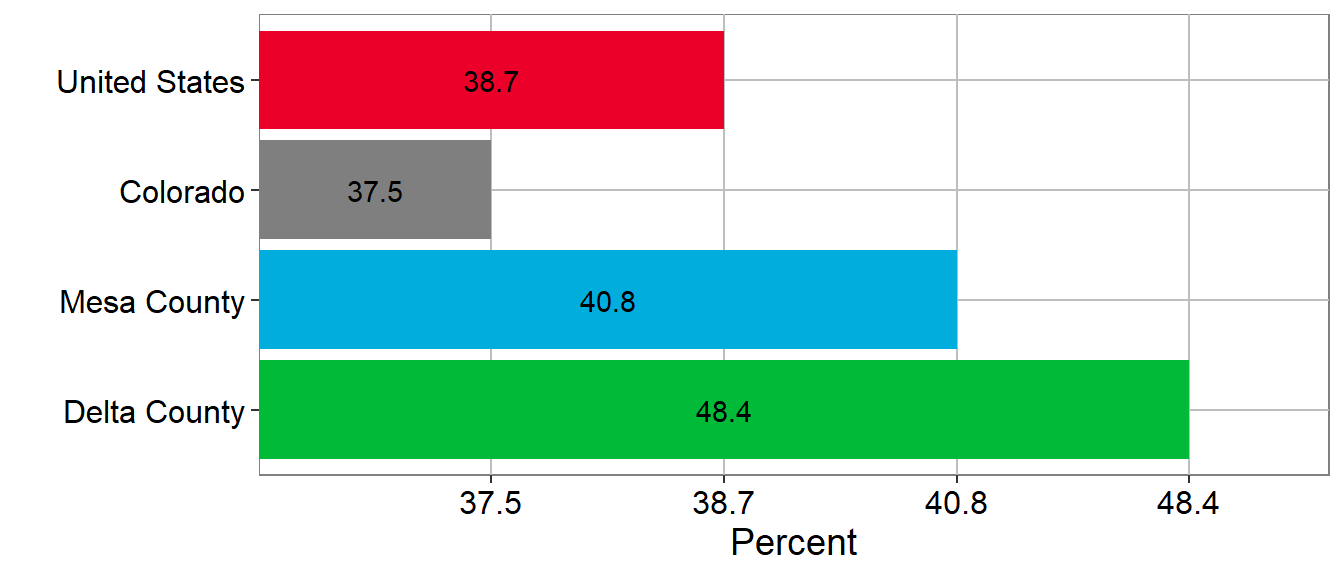
Median Age: 48.4
Educational Attainment
- High School Diploma: 91.0%
- Bachelor’s Degree or higher, age 25+: 25.7%
Median Household Income: $58,330
Employment Status:
- Percent of those 16+ in labor force: 48.5%
- Unemployment rate: 3.2%
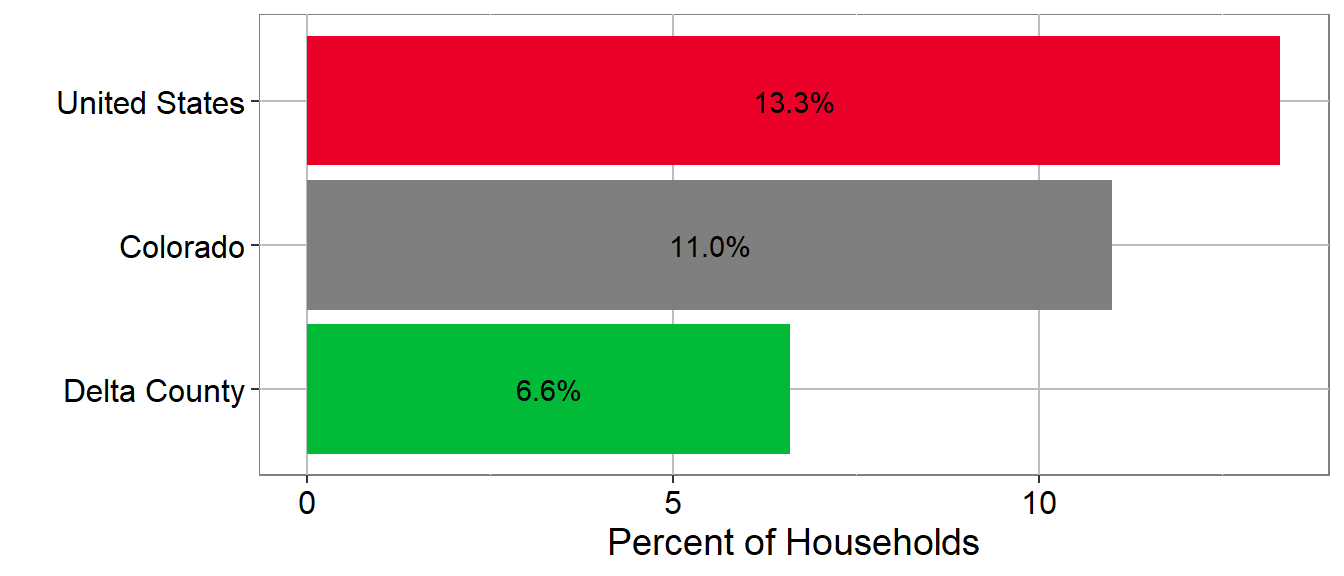
SNAP Usage: 12.2%
Delta Population Growth
Population Growth 2014 to 2023
Population Growth 2014 to 2023
Population Growth 2014 to 2023
| Region | 2013 | 2014 | 2015 | 2016 | 2017 | 2018 | 2019 | 2020 | 2021 | 2022 | 2023 |
|---|---|---|---|---|---|---|---|---|---|---|---|
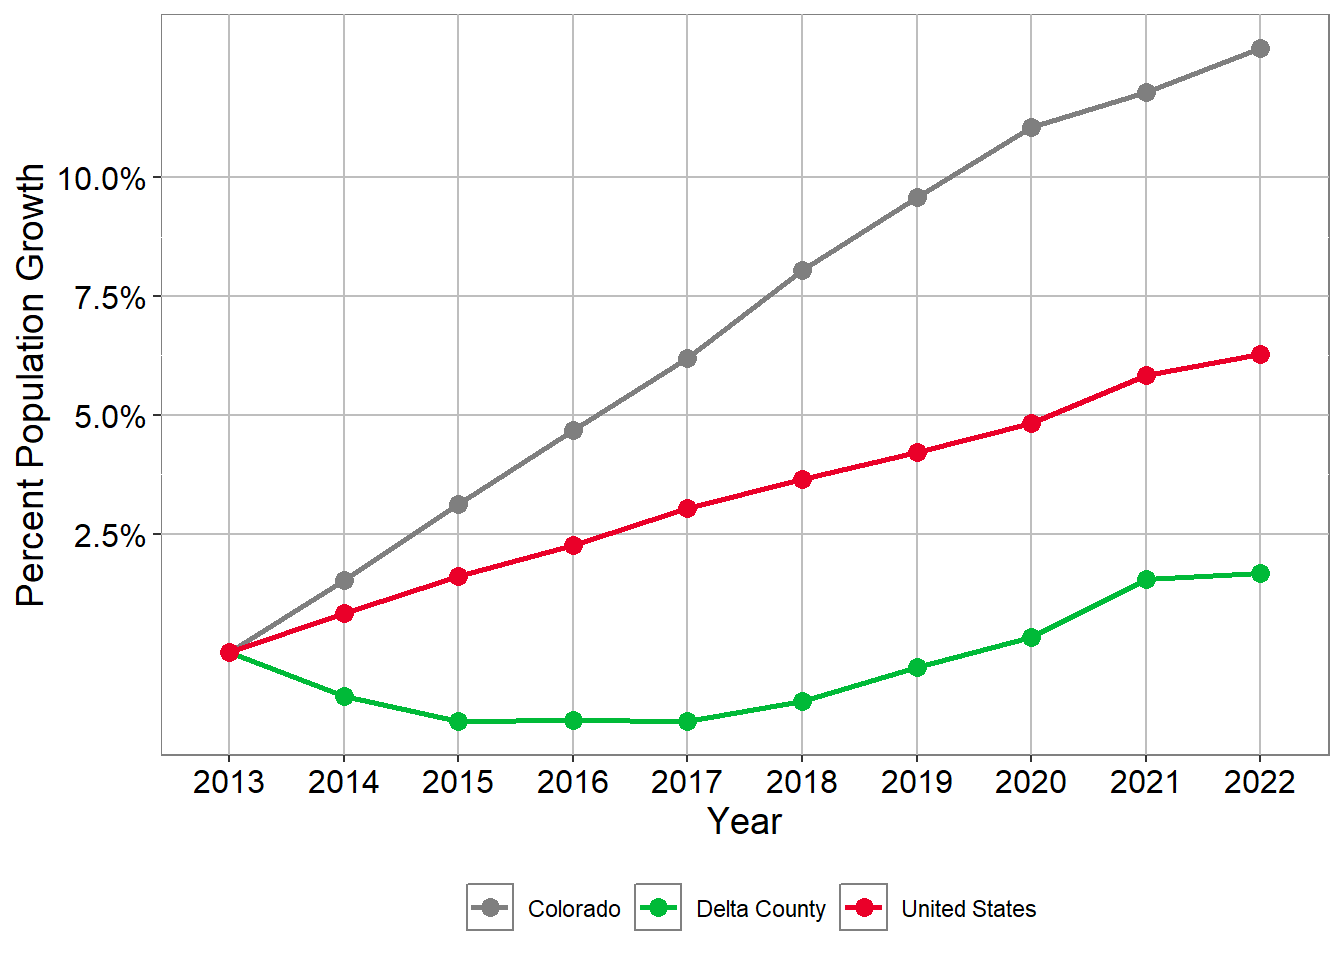
| Colorado | 0.0% | 1.5% | 3.1% | 4.7% | 6.2% | 8.0% | 9.6% | 11.0% | 11.8% | 12.7% | 13.5% |
| Delta County | 0.0% | -0.9% | -1.5% | -1.4% | -1.4% | -1.0% | -0.3% | 0.3% | 1.5% | 1.7% | 2.3% |
| Mesa County | 0.0% | 0.1% | 0.3% | 0.5% | 0.9% | 1.7% | 2.6% | 3.8% | 4.9% | 5.9% | 6.7% |
| United States | 0.0% | 0.8% | 1.6% | 2.3% | 3.0% | 3.6% | 4.2% | 4.8% | 5.8% | 6.3% | 6.7% |
Source: U.S. Census Bureau, American Community Survey 5-year estimates, Table: B01003; TOTAL POPULATION 2023
Delta Median Age
Median Age 2023
Median Age
Median Age
| Region | 2013 | 2014 | 2015 | 2016 | 2017 | 2018 | 2019 | 2020 | 2021 | 2022 | 2023 |
|---|---|---|---|---|---|---|---|---|---|---|---|
| Colorado | 36.1 | 36.2 | 36.3 | 36.4 | 36.5 | 36.6 | 36.7 | 36.9 | 37.1 | 37.3 | 37.5 |
| Delta County | 46.7 | 47.1 | 47.3 | 47.5 | 47.8 | 47.6 | 47.3 | 47.7 | 47.6 | 47.8 | 48.4 |
| Mesa County | 38.2 | 38.2 | 38.4 | 38.8 | 38.9 | 39.1 | 39.7 | 40.0 | 40.3 | 40.6 | 40.8 |
| United States | 37.3 | 37.4 | 37.6 | 37.7 | 37.8 | 37.9 | 38.1 | 38.2 | 38.4 | 38.5 | 38.7 |
Source: U.S. Census Bureau, American Community Survey 5-year estimates, Table: 01002; MEDIAN AGE BY SEX 2023
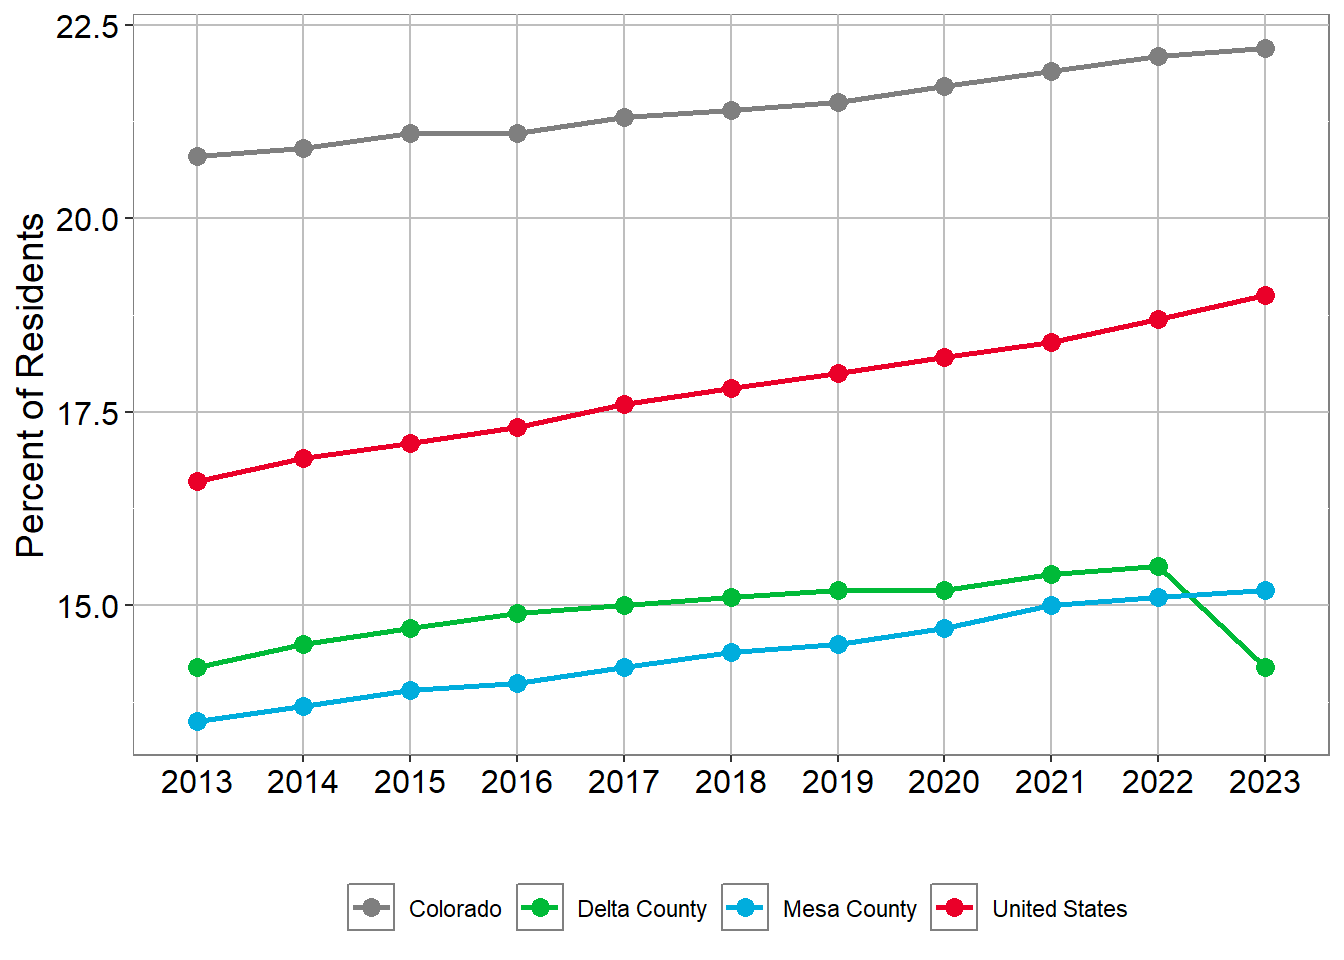
Delta Race
Residents with Race other than White Alone (people of color) in 2023

Residents with Race other than White Alone (people of color)

Residents with Race other than White Alone (people of color)
| Region | 2013 | 2014 | 2015 | 2016 | 2017 | 2018 | 2019 | 2020 | 2021 | 2022 | 2023 |
|---|---|---|---|---|---|---|---|---|---|---|---|
| Colorado | 30.3 | 30.6 | 30.9 | 31.0 | 31.4 | 31.7 | 31.9 | 32.5 | 33.2 | 33.8 | 34.3 |
| Delta County | 17.4 | 17.7 | 17.9 | 18.3 | 18.4 | 18.6 | 18.7 | 19.2 | 20.0 | 20.6 | 19.5 |
| Mesa County | 17.3 | 17.6 | 17.9 | 18.0 | 18.2 | 18.5 | 18.6 | 19.1 | 19.8 | 20.4 | 21.0 |
| United States | 36.7 | 37.2 | 37.7 | 38.0 | 38.5 | 38.9 | 39.3 | 39.9 | 40.6 | 41.1 | 41.8 |
Source: U.S. Census Bureau, American Community Survey 5-year estimates, Tables: B01001H; SEX BY AGE (WHITE ALONE, NOT HISPANIC OR LATINO), and B01003; TOTAL POPULATION 2023
Delta Hispanic Population
Residents age 5+ Speaking Spanish at Home in 2023
Residents age 5+ Speaking Spanish at Home
Residents age 5+ Speaking Spanish at Home
| Region | 2015 | 2016 | 2017 | 2018 | 2019 | 2020 | 2021 | 2022 | 2023 |
|---|---|---|---|---|---|---|---|---|---|
| Colorado | 11.8% | 11.9% | 11.8% | 11.8% | 11.7% | 11.2% | 11.1% | 11.0% | 11.0% |
| Delta County | 8.0% | 8.4% | 8.5% | 8.3% | 7.6% | 8.0% | 7.8% | 6.6% | 6.9% |
| Mesa County | 5.6% | 5.4% | 5.2% | 5.7% | 5.4% | 5.1% | 4.9% | 5.0% | 5.3% |
| United States | 13.0% | 13.1% | 13.2% | 13.3% | 13.4% | 13.2% | 13.3% | 13.3% | 13.4% |
Source: U.S. Census Bureau, American Community Survey 5-year estimates, Tables: S1101; HOUSEHOLDS AND FAMILIES, and S1601; LANGUAGE SPOKEN AT HOME 2023
Residents who are Hispanic or Latino in 2023
Residents who are Hispanic or Latino
Residents who are Hispanic or Latino
| Region | 2013 | 2014 | 2015 | 2016 | 2017 | 2018 | 2019 | 2020 | 2021 | 2022 | 2023 |
|---|---|---|---|---|---|---|---|---|---|---|---|
| Colorado | 20.8% | 20.9% | 21.1% | 21.1% | 21.3% | 21.4% | 21.5% | 21.7% | 21.9% | 22.1% | 22.2% |
| Delta County | 14.2% | 14.5% | 14.7% | 14.9% | 15.0% | 15.1% | 15.2% | 15.2% | 15.4% | 15.5% | 14.2% |
| Mesa County | 13.5% | 13.7% | 13.9% | 14.0% | 14.2% | 14.4% | 14.5% | 14.7% | 15.0% | 15.1% | 15.2% |
| United States | 16.6% | 16.9% | 17.1% | 17.3% | 17.6% | 17.8% | 18.0% | 18.2% | 18.4% | 18.7% | 19.0% |
Source: U.S. Census Bureau, American Community Survey 5-year estimates, Table: B03003; HISPANIC OR LATINO ORIGIN 2023
Delta Educational Attainment
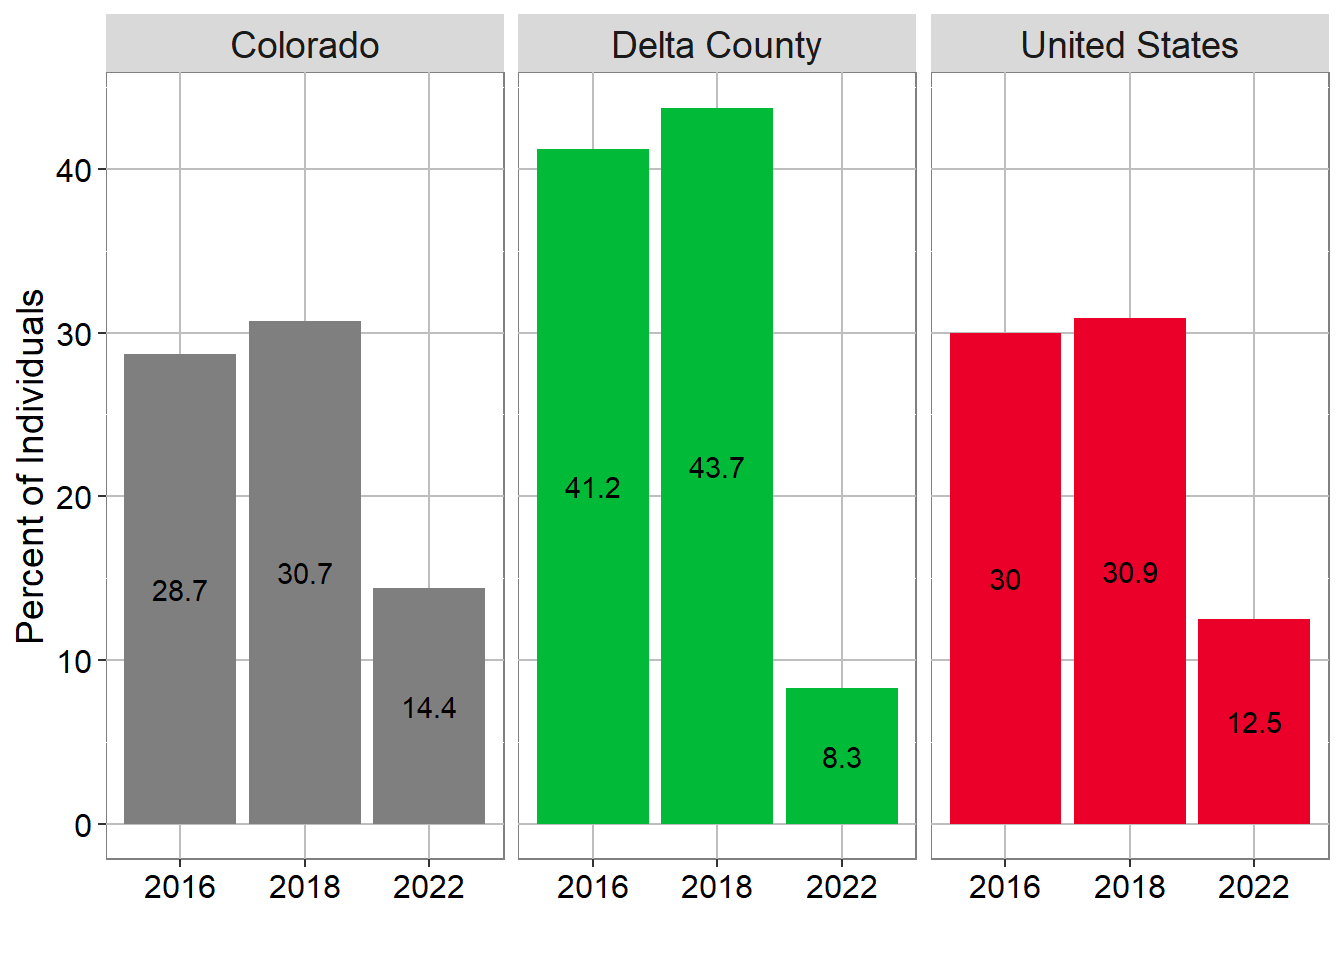
Percent of people age 18 to 24 that are Highschool Graduate’s
| 2017 | 2020 | 2023 | |
|---|---|---|---|
| Delta County | 39.3% | 36.5% | 49% |
| Mesa County | 27.2% | 29.9% | 33.2% |
| Colorado | 29.5% | 31.5% | 33.8% |
| United States | 30.5% | 31.4% | 34.6% |
Source: U.S. Census Bureau, American Community Survey 5-year estimates, Table: S1501; EDUCATIONAL ATTAINMENT 2023
Percent of people age 18 to 24 that are Bachelor’s Degree’s
| 2017 | 2020 | 2023 | |
|---|---|---|---|
| Delta County | 6.6% | 8.9% | 6.2% |
| Mesa County | 4.5% | 7.8% | 7.9% |
| Colorado | 11.5% | 13.2% | 14.3% |
| United States | 10.5% | 11.8% | 12.9% |
Source: U.S. Census Bureau, American Community Survey 5-year estimates, Table: S1501; EDUCATIONAL ATTAINMENT 2023
Percent of people age 25+ that have Bachelor’s Degree’s or higher
Source: U.S. Census Bureau, American Community Survey 5-year estimates, Table: S1501; EDUCATIONAL ATTAINMENT 2023
Over all Educational Attainment age 25+
Source: U.S. Census Bureau, American Community Survey 5-year estimates, Table: B15003; EDUCATIONAL ATTAINMENT FOR THE POPULATION 25 YEARS AND OVER 2023
Delta Economic Characteristics
Delta Median Income
Delta Median Household Income
Delta Median Household Income
| Region | 2013 | 2014 | 2015 | 2016 | 2017 | 2018 | 2019 | 2020 | 2021 | 2022 | 2023 |
|---|---|---|---|---|---|---|---|---|---|---|---|
| Colorado | 58,433 | 59,448 | 60,629 | 62,520 | 65,458 | 68,811 | 72,331 | 75,231 | 80,184 | 87,598 | 92,470 |
| Delta County | 42,078 | 42,389 | 42,452 | 42,011 | 42,487 | 44,512 | 45,269 | 47,968 | 51,803 | 56,349 | 58,330 |
| Mesa County | 49,471 | 48,610 | 49,322 | 50,070 | 51,971 | 53,683 | 55,379 | 57,157 | 62,127 | 68,077 | 71,485 |
| United States | 53,046 | 53,482 | 53,889 | 55,322 | 57,652 | 60,293 | 62,843 | 64,994 | 69,021 | 75,149 | 78,538 |
Source: U.S. Census Bureau, American Community Survey 5-year estimates, Table: S1901; INCOME IN THE PAST 12 MONTHS (IN 2023 INFLATION-ADJUSTED DOLLARS) 2023
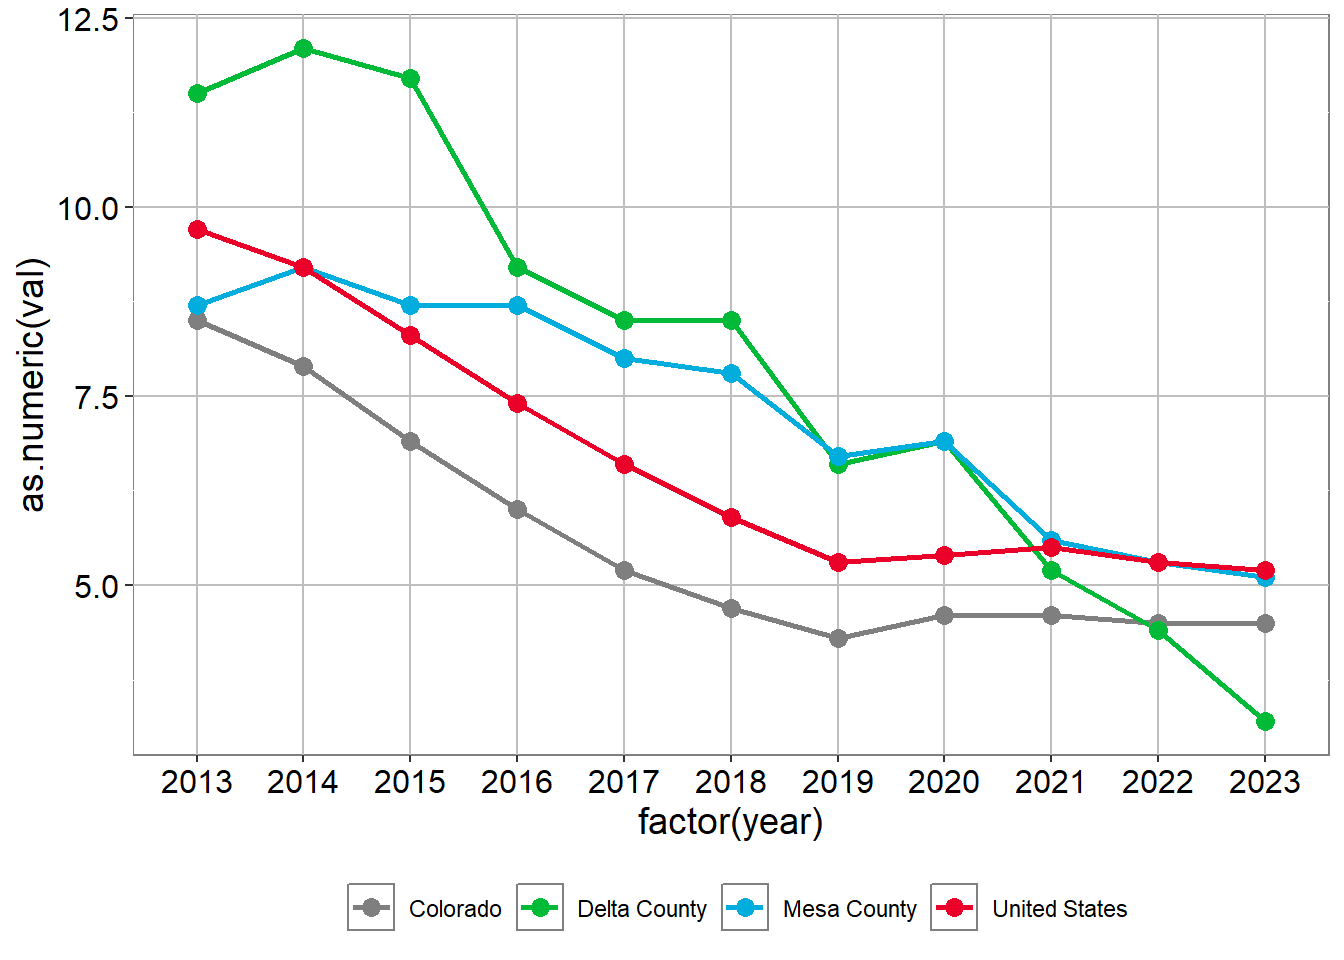
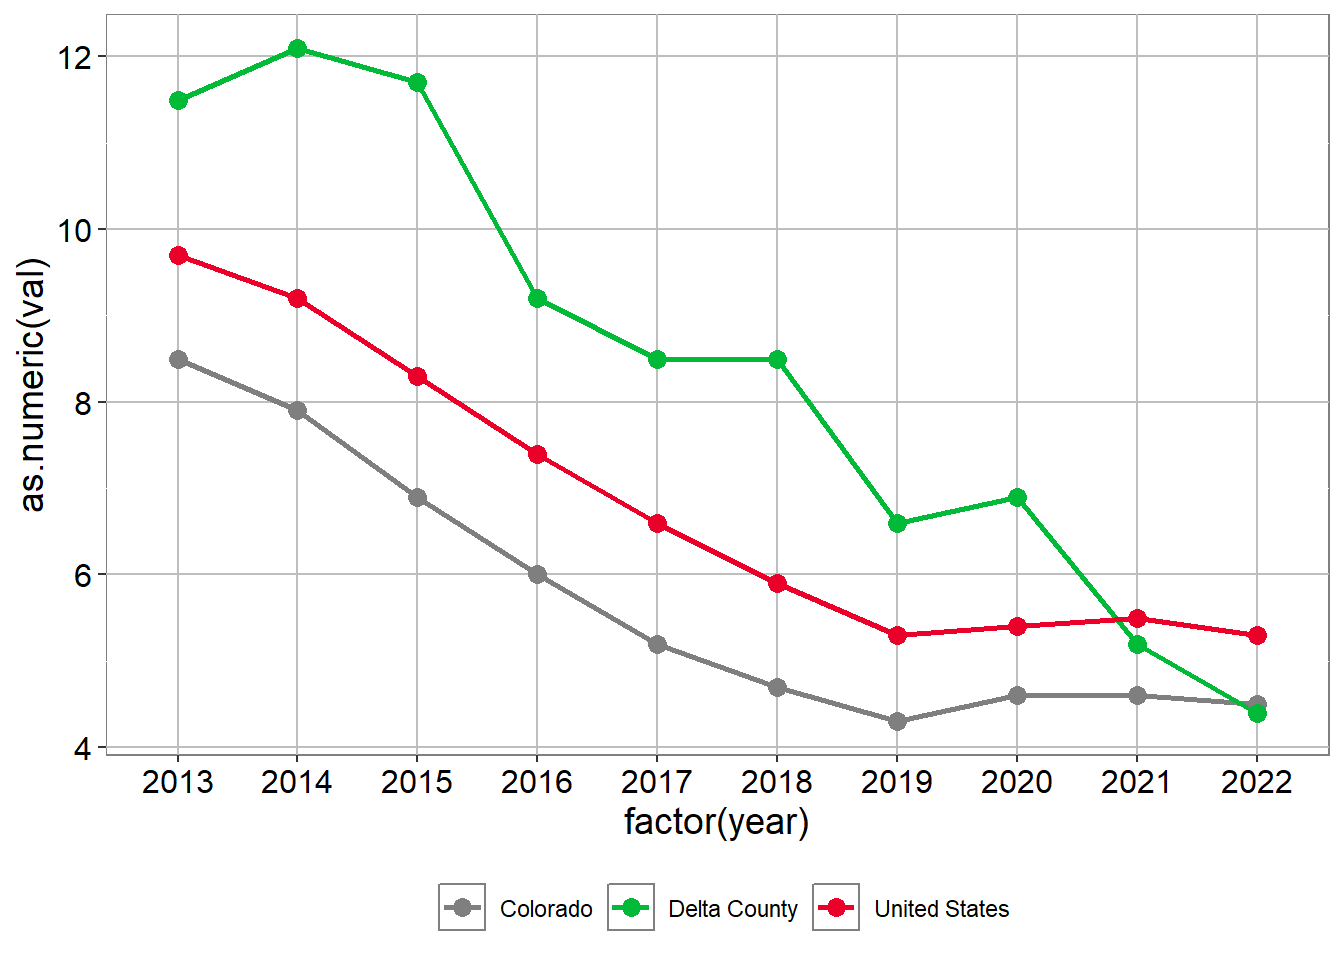
Delta Unemployment
Delta Work Force, Unemployed Adults 16+ ( 2023 )

Delta Work Force, Unemployed Adults 16+
Delta Work Force, Unemployed Adults 16+
| 2013 | 2014 | 2015 | 2016 | 2017 | 2018 | 2019 | 2020 | 2021 | 2022 | 2023 | |
|---|---|---|---|---|---|---|---|---|---|---|---|
| Colorado | 8.5% | 7.9% | 6.9% | 6% | 5.2% | 4.7% | 4.3% | 4.6% | 4.6% | 4.5% | 4.5% |
| Delta County | 11.5% | 12.1% | 11.7% | 9.2% | 8.5% | 8.5% | 6.6% | 6.9% | 5.2% | 4.4% | 3.2% |
| United States | 9.7% | 9.2% | 8.3% | 7.4% | 6.6% | 5.9% | 5.3% | 5.4% | 5.5% | 5.3% | 5.2% |
Source: U.S. Census Bureau, American Community Survey 5-year estimates, Table: S2301; EMPLOYMENT STATUS 2023
Delta SNAP Usage
Delta HOUSEHOLD SNAP USAGE (2023)
Delta HOUSEHOLD SNAP USAGE
Delta HOUSEHOLD SNAP USAGE
| Region | 2015 | 2016 | 2017 | 2018 | 2019 | 2020 | 2021 | 2022 | 2023 |
|---|---|---|---|---|---|---|---|---|---|
| Colorado | 8.7% | 8.6% | 8.2% | 8.0% | 7.5% | 7.2% | 7.4% | 7.6% | 8.0% |
| Delta County | 11.6% | 12.1% | 11.5% | 13.0% | 13.3% | 12.2% | 12.2% | 11.4% | 12.2% |
| Mesa County | 11.3% | 11.7% | 11.3% | 11.5% | 10.8% | 9.7% | 9.6% | 10.1% | 10.6% |
| United States | 13.2% | 13.0% | 12.6% | 12.2% | 11.7% | 11.4% | 11.4% | 11.5% | 11.8% |
Source: U.S. Census Bureau, American Community Survey 5-year estimates, Table: S2201; FOOD STAMPS/SUPPLEMENTAL NUTRITION ASSISTANCE PROGRAM (SNAP) 2023
Delta Poverty
Delta Poverty within a Demographic for 2023
| Demographic | Delta County | Mesa County | Colorado | US |
|---|---|---|---|---|
| All Households | 14.2% | 11.2% | 9.4% | 12.4% |
| Households with married adults with children | 18% | 11.9% | 9% | 13.5% |
| Single female households with children | 48.6% | 31.8% | 25.9% | 32.6% |
| Individuals 65 and older | 8.9% | 9.8% | 8% | 10.4% |
| Hispanics of any race | 21.4% | 19.2% | 13.6% | 16.9% |
Source: U.S. Census Bureau, American Community Survey 5-year estimates, Tables: S1701; POVERTY STATUS IN THE PAST 12 MONTHS, and S1702; POVERTY STATUS IN THE PAST 12 MONTHS OF FAMILIES 2023
Delta County Total Poverty Percent of Households
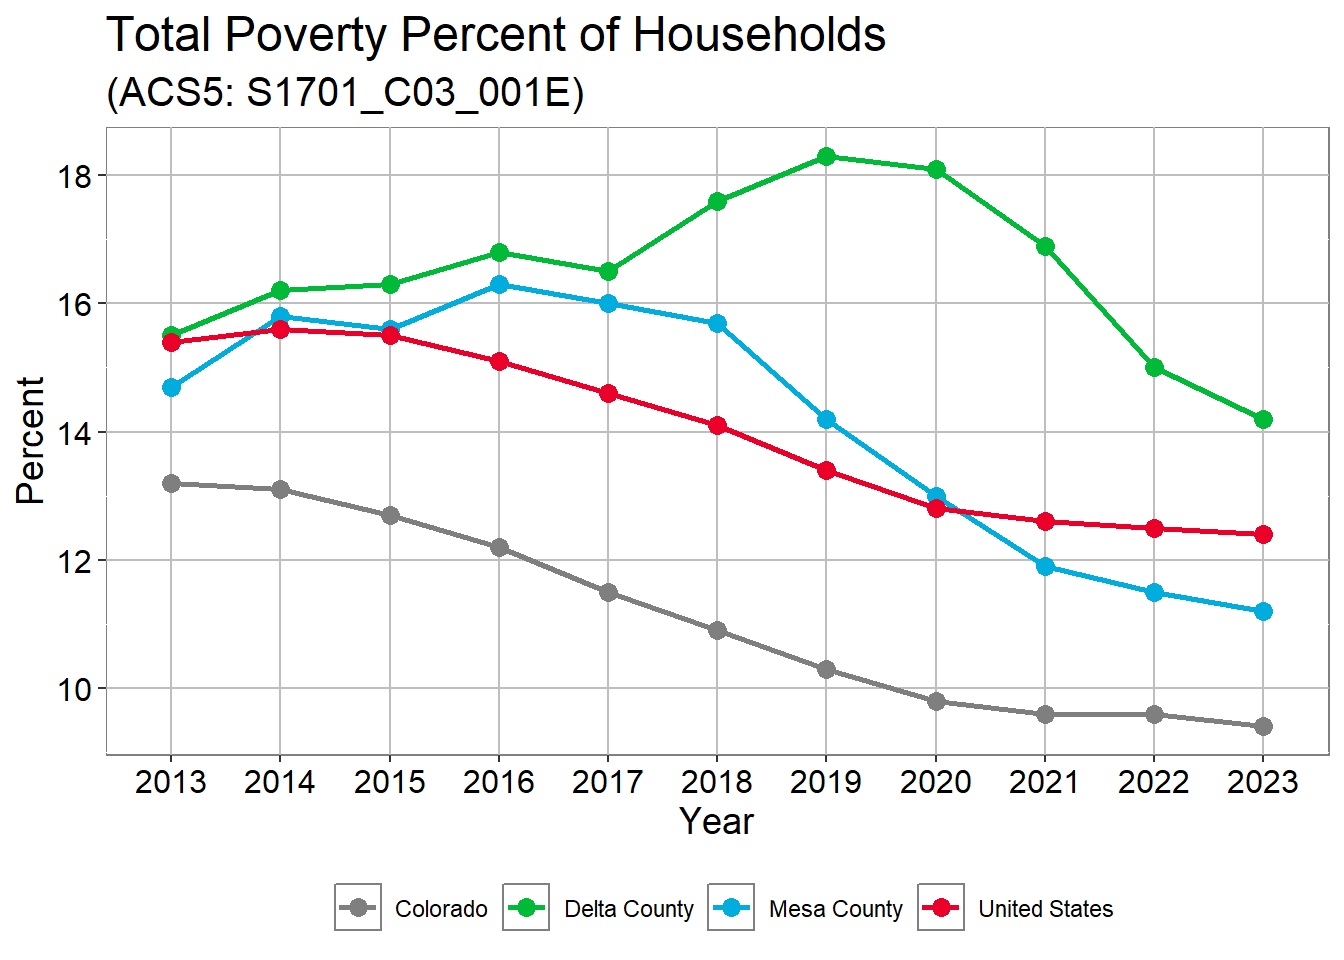
Delta County Total Poverty Percent of Households
| name | 2013 | 2014 | 2015 | 2016 | 2017 | 2018 | 2019 | 2020 | 2021 | 2022 | 2023 |
|---|---|---|---|---|---|---|---|---|---|---|---|
| Colorado | 13.2% | 13.1% | 12.7% | 12.2% | 11.5% | 10.9% | 10.3% | 9.8% | 9.6% | 9.6% | 9.4% |
| Delta County | 15.5% | 16.2% | 16.3% | 16.8% | 16.5% | 17.6% | 18.3% | 18.1% | 16.9% | 15.0% | 14.2% |
| Mesa County | 14.7% | 15.8% | 15.6% | 16.3% | 16.0% | 15.7% | 14.2% | 13.0% | 11.9% | 11.5% | 11.2% |
| United States | 15.4% | 15.6% | 15.5% | 15.1% | 14.6% | 14.1% | 13.4% | 12.8% | 12.6% | 12.5% | 12.4% |
Source: U.S. Census Bureau, American Community Survey 5-year estimates, Table: S1701; POVERTY STATUS IN THE PAST 12 MONTHS 2023
Delta Housing
Delta Percent Renter-occupied housing
Delta Percent Renter-occupied housing
| Region | 2014 | 2015 | 2016 | 2017 | 2018 | 2019 | 2020 | 2021 | 2022 | 2023 |
|---|---|---|---|---|---|---|---|---|---|---|
| Colorado | 35.2% | 35.7% | 35.6% | 35.3% | 35.1% | 34.8% | 33.8% | 33.9% | 33.8% | 33.7% |
| Delta County | 28.2% | 28.7% | 29.4% | 29.0% | 29.0% | 26.4% | 26.8% | 26.3% | 23.9% | 23.6% |
| Mesa County | 30.3% | 30.9% | 32.0% | 33.0% | 32.8% | 31.8% | 30.9% | 29.6% | 28.2% | 28.1% |
| United States | 35.6% | 36.1% | 36.4% | 36.2% | 36.2% | 36.0% | 35.6% | 35.4% | 35.2% | 35.0% |
Source: U.S. Census Bureau, American Community Survey 5-year estimates, Table: DP04; SELECTED HOUSING CHARACTERISTICS 2023
Delta Housing Burden: Percent of households where housing cost exceed 30% of income in 2023
| County | Total | Renters | Owners |
|---|---|---|---|
| Delta County | 30.5% | 55.9 ( 1,498 ) | 23.4% ( 2,261 ) |
| Mesa County | 31.6% | 49.1 ( 8,347 ) | 25.2% ( 11,696 ) |
Source: U.S. Census Bureau, American Community Survey 5-year estimates, Table: DP04; SELECTED HOUSING CHARACTERISTICS 2023
Montrose County
2023 Summary
Hispanic/Latino population: 21.2%
Median Age: 45.7
Educational Attainment
- High School Diploma: 91.0%
- Bachelor’s Degree or higher, age 25+: 28.3%
Median Household Income: $66,072
Employment Status:
- Percent of those 16+ in labor force: 55.7%
- Unemployment rate: 4.2%
SNAP Usage: 10.8%
Montrose Population Growth
Population Growth 2014 to 2023
Population Growth 2014 to 2023
Population Growth 2014 to 2023
| Region | 2013 | 2014 | 2015 | 2016 | 2017 | 2018 | 2019 | 2020 | 2021 | 2022 | 2023 |
|---|---|---|---|---|---|---|---|---|---|---|---|
| Colorado | 0.0% | 1.5% | 3.1% | 4.7% | 6.2% | 8.0% | 9.6% | 11.0% | 11.8% | 12.7% | 13.5% |
| Mesa County | 0.0% | 0.1% | 0.3% | 0.5% | 0.9% | 1.7% | 2.6% | 3.8% | 4.9% | 5.9% | 6.7% |
| Montrose County | 0.0% | -0.3% | -0.5% | -0.4% | -0.3% | 0.6% | 1.6% | 3.1% | 3.2% | 4.4% | 5.5% |
| United States | 0.0% | 0.8% | 1.6% | 2.3% | 3.0% | 3.6% | 4.2% | 4.8% | 5.8% | 6.3% | 6.7% |
Source: U.S. Census Bureau, American Community Survey 5-year estimates, Table: B01003; TOTAL POPULATION 2023
Montrose Median Age
Median Age 2023
Median Age
Median Age
| Region | 2013 | 2014 | 2015 | 2016 | 2017 | 2018 | 2019 | 2020 | 2021 | 2022 | 2023 |
|---|---|---|---|---|---|---|---|---|---|---|---|
| Colorado | 36.1 | 36.2 | 36.3 | 36.4 | 36.5 | 36.6 | 36.7 | 36.9 | 37.1 | 37.3 | 37.5 |
| Mesa County | 38.2 | 38.2 | 38.4 | 38.8 | 38.9 | 39.1 | 39.7 | 40.0 | 40.3 | 40.6 | 40.8 |
| Montrose County | 42.8 | 43.5 | 44.2 | 44.6 | 44.7 | 45.1 | 45.2 | 45.5 | 45.6 | 45.9 | 45.7 |
| United States | 37.3 | 37.4 | 37.6 | 37.7 | 37.8 | 37.9 | 38.1 | 38.2 | 38.4 | 38.5 | 38.7 |
Source: U.S. Census Bureau, American Community Survey 5-year estimates, Table: 01002; MEDIAN AGE BY SEX 2023
Montrose Race
Residents with Race other than White Alone (people of color) in 2023
Residents with Race other than White Alone (people of color)
Residents with Race other than White Alone (people of color)
| Region | 2013 | 2014 | 2015 | 2016 | 2017 | 2018 | 2019 | 2020 | 2021 | 2022 | 2023 |
|---|---|---|---|---|---|---|---|---|---|---|---|
| Colorado | 30.3 | 30.6 | 30.9 | 31.0 | 31.4 | 31.7 | 31.9 | 32.5 | 33.2 | 33.8 | 34.3 |
| Mesa County | 17.3 | 17.6 | 17.9 | 18.0 | 18.2 | 18.5 | 18.6 | 19.1 | 19.8 | 20.4 | 21.0 |
| Montrose County | 22.8 | 23.2 | 23.6 | 23.6 | 23.8 | 23.9 | 23.9 | 24.1 | 24.8 | 25.2 | 26.0 |
| United States | 36.7 | 37.2 | 37.7 | 38.0 | 38.5 | 38.9 | 39.3 | 39.9 | 40.6 | 41.1 | 41.8 |
Source: U.S. Census Bureau, American Community Survey 5-year estimates, Tables: B01001H; SEX BY AGE (WHITE ALONE, NOT HISPANIC OR LATINO), and B01003; TOTAL POPULATION 2023
Montrose Hispanic Population
Residents age 5+ Speaking Spanish at Home in 2023
Residents age 5+ Speaking Spanish at Home

Residents age 5+ Speaking Spanish at Home
| Region | 2015 | 2016 | 2017 | 2018 | 2019 | 2020 | 2021 | 2022 | 2023 |
|---|---|---|---|---|---|---|---|---|---|
| Colorado | 11.8% | 11.9% | 11.8% | 11.8% | 11.7% | 11.2% | 11.1% | 11.0% | 11.0% |
| Mesa County | 5.6% | 5.4% | 5.2% | 5.7% | 5.4% | 5.1% | 4.9% | 5.0% | 5.3% |
| Montrose County | 14.7% | 14.4% | 14.4% | 14.7% | 15.7% | 14.9% | 15.6% | 14.9% | 14.1% |
| United States | 13.0% | 13.1% | 13.2% | 13.3% | 13.4% | 13.2% | 13.3% | 13.3% | 13.4% |
Source: U.S. Census Bureau, American Community Survey 5-year estimates, Tables: S1101; HOUSEHOLDS AND FAMILIES, and S1601; LANGUAGE SPOKEN AT HOME 2023
Residents who are Hispanic or Latino in 2023
Residents who are Hispanic or Latino
Residents who are Hispanic or Latino
| Region | 2013 | 2014 | 2015 | 2016 | 2017 | 2018 | 2019 | 2020 | 2021 | 2022 | 2023 |
|---|---|---|---|---|---|---|---|---|---|---|---|
| Colorado | 20.8% | 20.9% | 21.1% | 21.1% | 21.3% | 21.4% | 21.5% | 21.7% | 21.9% | 22.1% | 22.2% |
| Mesa County | 13.5% | 13.7% | 13.9% | 14.0% | 14.2% | 14.4% | 14.5% | 14.7% | 15.0% | 15.1% | 15.2% |
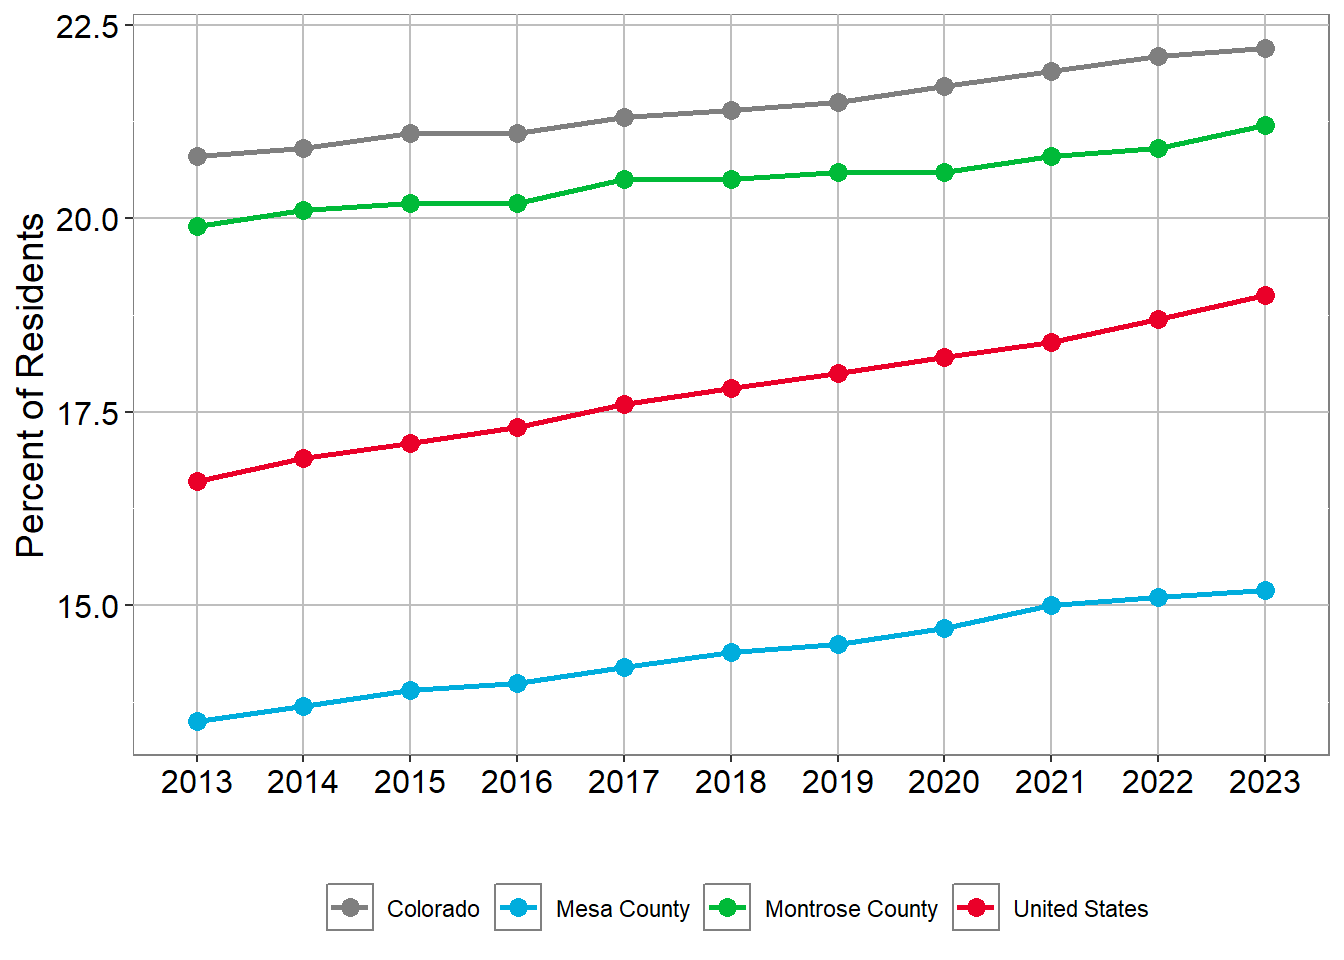
| Montrose County | 19.9% | 20.1% | 20.2% | 20.2% | 20.5% | 20.5% | 20.6% | 20.6% | 20.8% | 20.9% | 21.2% |
| United States | 16.6% | 16.9% | 17.1% | 17.3% | 17.6% | 17.8% | 18.0% | 18.2% | 18.4% | 18.7% | 19.0% |
Source: U.S. Census Bureau, American Community Survey 5-year estimates, Table: B03003; HISPANIC OR LATINO ORIGIN 2023
Montrose Educational Attainment
Percent of people age 18 to 24 that are Highschool Graduate’s
| 2017 | 2020 | 2023 | |
|---|---|---|---|
| Montrose County | 37.7% | 42.4% | 42.9% |
| Mesa County | 27.2% | 29.9% | 33.2% |
| Colorado | 29.5% | 31.5% | 33.8% |
| United States | 30.5% | 31.4% | 34.6% |
Source: U.S. Census Bureau, American Community Survey 5-year estimates, Table: S1501; EDUCATIONAL ATTAINMENT 2023
Percent of people age 18 to 24 that are Bachelor’s Degree’s
| 2017 | 2020 | 2023 | |
|---|---|---|---|
| Montrose County | 4.8% | 8.4% | 7.1% |
| Mesa County | 4.5% | 7.8% | 7.9% |
| Colorado | 11.5% | 13.2% | 14.3% |
| United States | 10.5% | 11.8% | 12.9% |
Source: U.S. Census Bureau, American Community Survey 5-year estimates, Table: S1501; EDUCATIONAL ATTAINMENT 2023
Percent of people age 25+ that have Bachelor’s Degree’s or higher
Source: U.S. Census Bureau, American Community Survey 5-year estimates, Table: S1501; EDUCATIONAL ATTAINMENT 2023
Over all Educational Attainment age 25+
Source: U.S. Census Bureau, American Community Survey 5-year estimates, Table: B15003; EDUCATIONAL ATTAINMENT FOR THE POPULATION 25 YEARS AND OVER 2023
Montrose Economic Characteristics
Montrose Median Income
Montrose Median Household Income
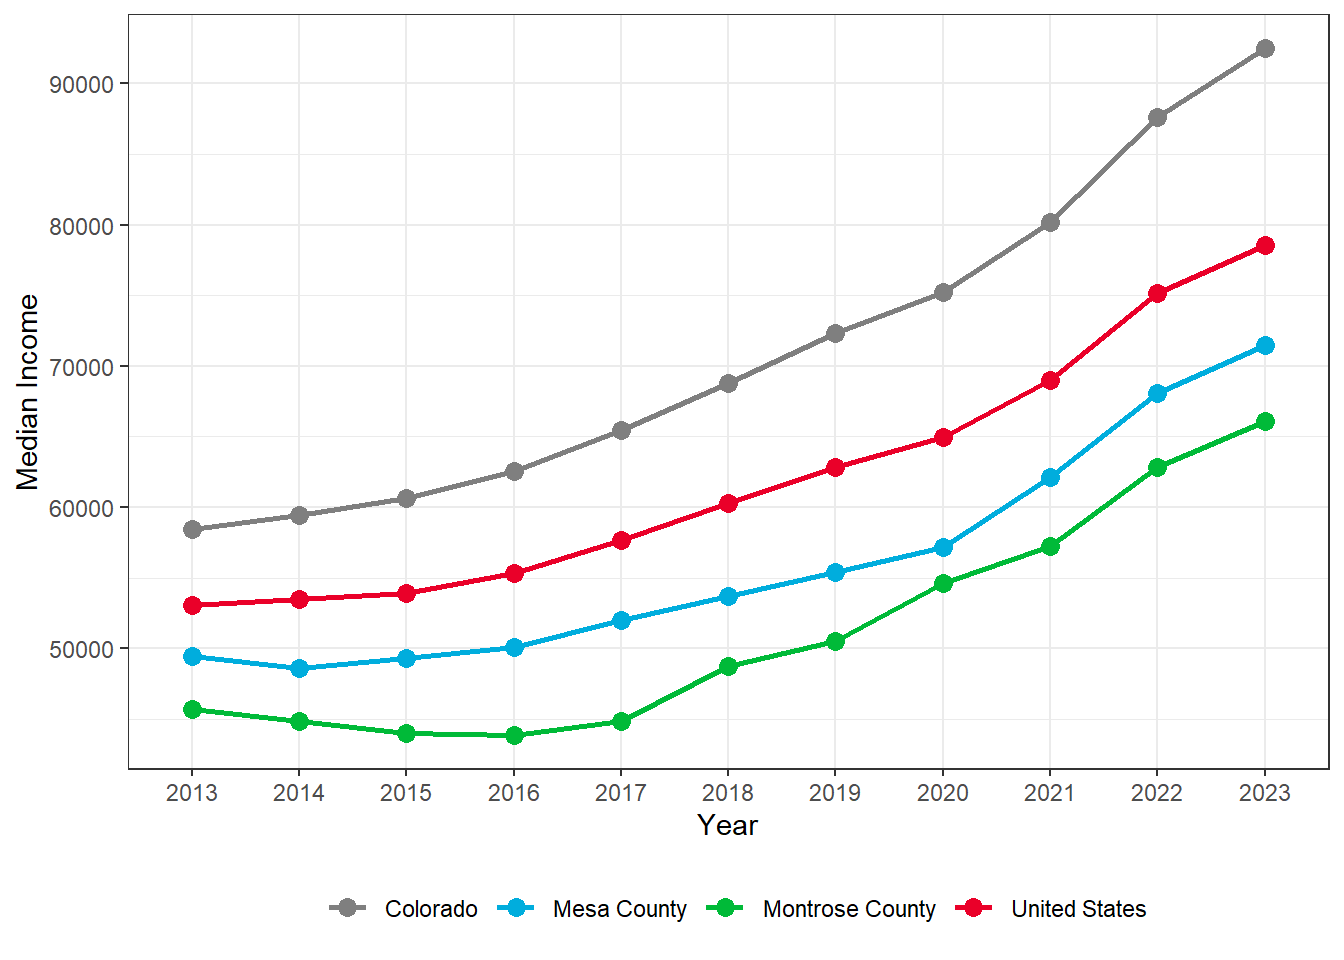
Montrose Median Household Income
| Region | 2013 | 2014 | 2015 | 2016 | 2017 | 2018 | 2019 | 2020 | 2021 | 2022 | 2023 |
|---|---|---|---|---|---|---|---|---|---|---|---|
| Colorado | 58,433 | 59,448 | 60,629 | 62,520 | 65,458 | 68,811 | 72,331 | 75,231 | 80,184 | 87,598 | 92,470 |
| Mesa County | 49,471 | 48,610 | 49,322 | 50,070 | 51,971 | 53,683 | 55,379 | 57,157 | 62,127 | 68,077 | 71,485 |
| Montrose County | 45,718 | 44,885 | 43,999 | 43,890 | 44,865 | 48,739 | 50,489 | 54,611 | 57,225 | 62,817 | 66,072 |
| United States | 53,046 | 53,482 | 53,889 | 55,322 | 57,652 | 60,293 | 62,843 | 64,994 | 69,021 | 75,149 | 78,538 |
Source: U.S. Census Bureau, American Community Survey 5-year estimates, Table: S1901; INCOME IN THE PAST 12 MONTHS (IN 2023 INFLATION-ADJUSTED DOLLARS) 2023
Montrose Unemployment
Montrose Work Force, Unemployed Adults 16+ ( 2023 )
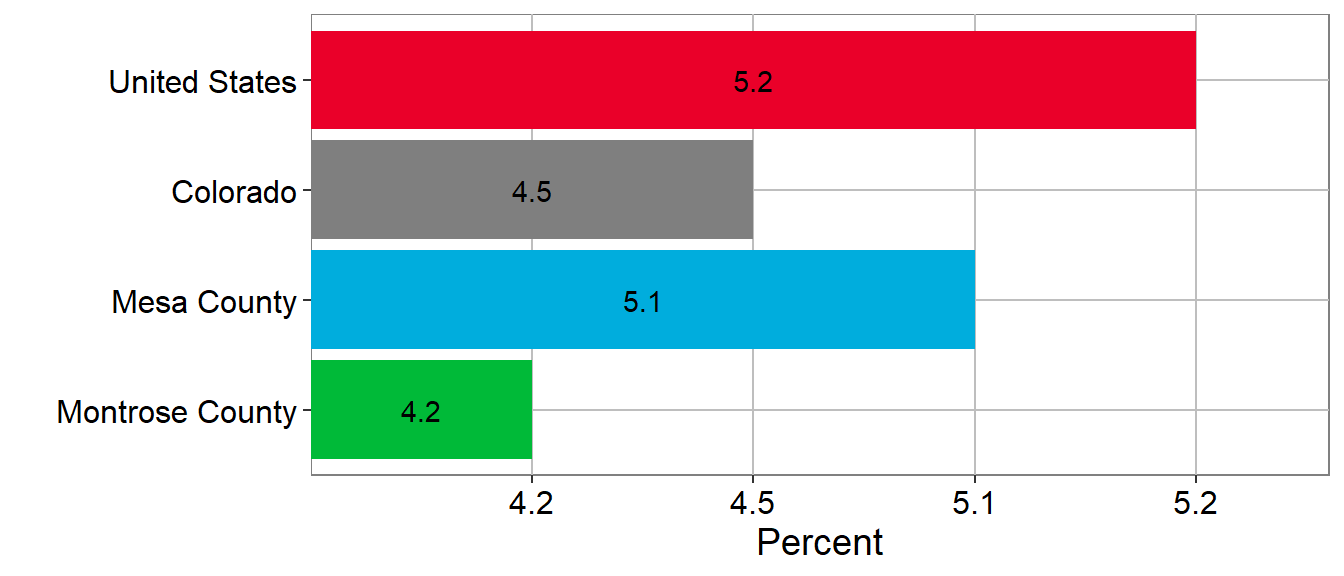
Montrose Work Force, Unemployed Adults 16+
Montrose Work Force, Unemployed Adults 16+
| 2013 | 2014 | 2015 | 2016 | 2017 | 2018 | 2019 | 2020 | 2021 | 2022 | 2023 | |
|---|---|---|---|---|---|---|---|---|---|---|---|
| Colorado | 8.5% | 7.9% | 6.9% | 6% | 5.2% | 4.7% | 4.3% | 4.6% | 4.6% | 4.5% | 4.5% |
| Montrose County | 11% | 9.9% | 10.2% | 8.6% | 8% | 7% | 6.3% | 5.3% | 5.3% | 4.3% | 4.2% |
| United States | 9.7% | 9.2% | 8.3% | 7.4% | 6.6% | 5.9% | 5.3% | 5.4% | 5.5% | 5.3% | 5.2% |
Source: U.S. Census Bureau, American Community Survey 5-year estimates, Table: S2301; EMPLOYMENT STATUS 2023
Montrose SNAP Usage
Montrose HOUSEHOLD SNAP USAGE (2023)
Montrose HOUSEHOLD SNAP USAGE
Montrose HOUSEHOLD SNAP USAGE
| Region | 2015 | 2016 | 2017 | 2018 | 2019 | 2020 | 2021 | 2022 | 2023 |
|---|---|---|---|---|---|---|---|---|---|
| Colorado | 8.7% | 8.6% | 8.2% | 8.0% | 7.5% | 7.2% | 7.4% | 7.6% | 8.0% |
| Mesa County | 11.3% | 11.7% | 11.3% | 11.5% | 10.8% | 9.7% | 9.6% | 10.1% | 10.6% |
| Montrose County | 14.3% | 13.3% | 12.6% | 11.9% | 10.9% | 10.4% | 10.2% | 10.1% | 10.8% |
| United States | 13.2% | 13.0% | 12.6% | 12.2% | 11.7% | 11.4% | 11.4% | 11.5% | 11.8% |
Source: U.S. Census Bureau, American Community Survey 5-year estimates, Table: S2201; FOOD STAMPS/SUPPLEMENTAL NUTRITION ASSISTANCE PROGRAM (SNAP) 2023
Montrose Poverty
Montrose Poverty within a Demographic for 2023
| Demographic | Montrose County | Mesa County | Colorado | US |
|---|---|---|---|---|
| All Households | 11.9% | 11.2% | 9.4% | 12.4% |
| Households with married adults with children | 12.9% | 11.9% | 9% | 13.5% |
| Single female households with children | 32.8% | 31.8% | 25.9% | 32.6% |
| Individuals 65 and older | 8.3% | 9.8% | 8% | 10.4% |
| Hispanics of any race | 16.3% | 19.2% | 13.6% | 16.9% |
Source: U.S. Census Bureau, American Community Survey 5-year estimates, Tables: S1701; POVERTY STATUS IN THE PAST 12 MONTHS, and S1702; POVERTY STATUS IN THE PAST 12 MONTHS OF FAMILIES 2023
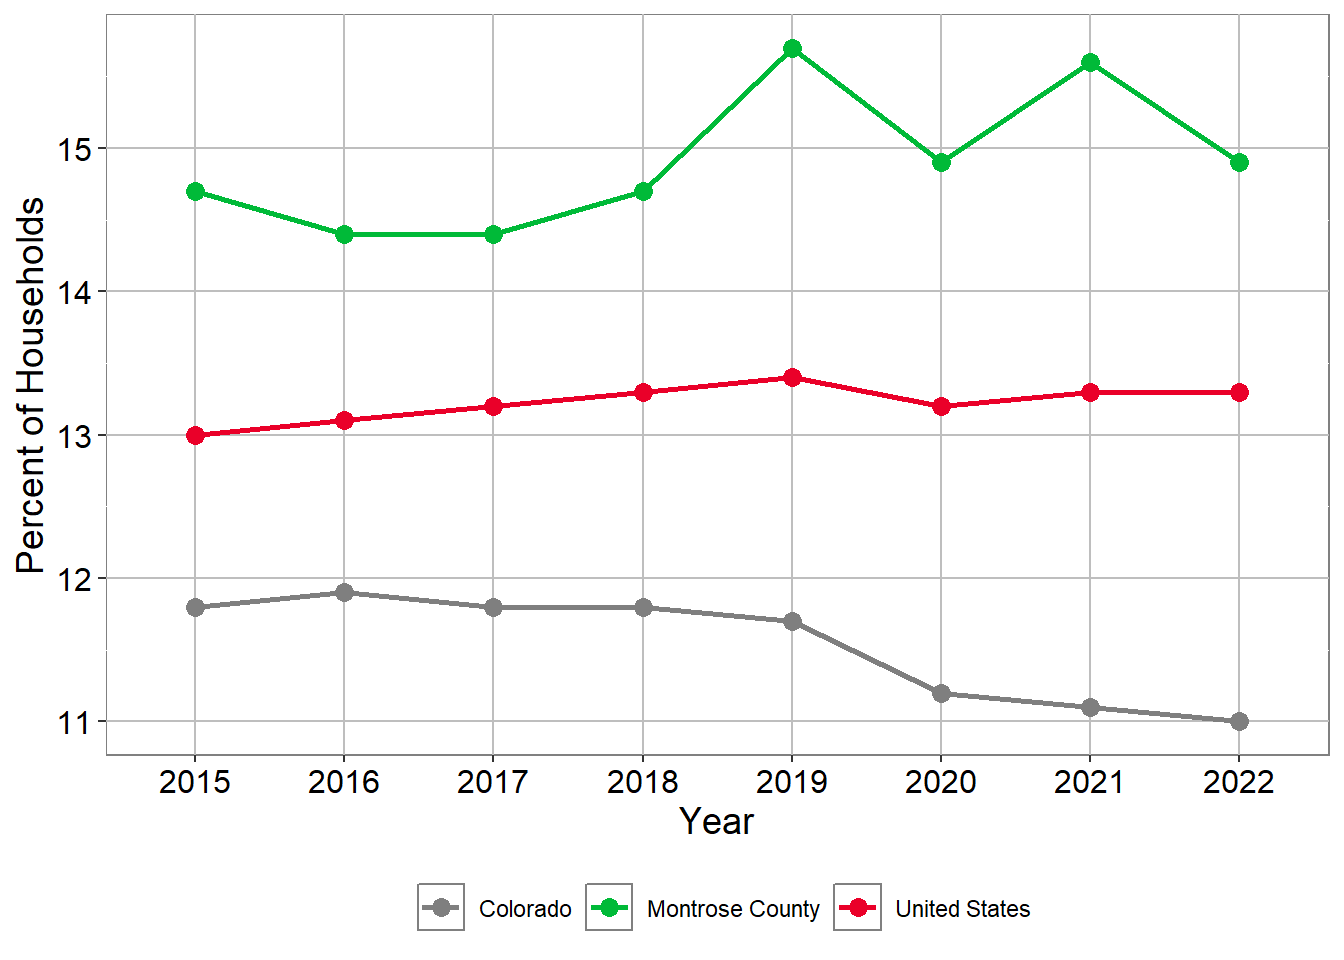
Montrose County Total Poverty Percent of Households

Montrose County Total Poverty Percent of Households
| name | 2013 | 2014 | 2015 | 2016 | 2017 | 2018 | 2019 | 2020 | 2021 | 2022 | 2023 |
|---|---|---|---|---|---|---|---|---|---|---|---|
| Colorado | 13.2% | 13.1% | 12.7% | 12.2% | 11.5% | 10.9% | 10.3% | 9.8% | 9.6% | 9.6% | 9.4% |
| Mesa County | 14.7% | 15.8% | 15.6% | 16.3% | 16.0% | 15.7% | 14.2% | 13.0% | 11.9% | 11.5% | 11.2% |
| Montrose County | 16.0% | 17.2% | 19.0% | 18.0% | 17.8% | 16.7% | 15.1% | 12.3% | 11.6% | 11.6% | 11.9% |
| United States | 15.4% | 15.6% | 15.5% | 15.1% | 14.6% | 14.1% | 13.4% | 12.8% | 12.6% | 12.5% | 12.4% |
Source: U.S. Census Bureau, American Community Survey 5-year estimates, Table: S1701; POVERTY STATUS IN THE PAST 12 MONTHS 2023
Montrose Housing
Montrose Percent Renter-occupied housing
Montrose Percent Renter-occupied housing
| Region | 2014 | 2015 | 2016 | 2017 | 2018 | 2019 | 2020 | 2021 | 2022 | 2023 |
|---|---|---|---|---|---|---|---|---|---|---|
| Colorado | 35.2% | 35.7% | 35.6% | 35.3% | 35.1% | 34.8% | 33.8% | 33.9% | 33.8% | 33.7% |
| Mesa County | 30.3% | 30.9% | 32.0% | 33.0% | 32.8% | 31.8% | 30.9% | 29.6% | 28.2% | 28.1% |
| Montrose County | 29.9% | 29.9% | 30.4% | 30.8% | 29.3% | 27.3% | 26.1% | 24.8% | 23.9% | 25.4% |
| United States | 35.6% | 36.1% | 36.4% | 36.2% | 36.2% | 36.0% | 35.6% | 35.4% | 35.2% | 35.0% |
Source: U.S. Census Bureau, American Community Survey 5-year estimates, Table: DP04; SELECTED HOUSING CHARACTERISTICS 2023
Montrose Housing Burden: Percent of households where housing cost exceed 30% of income in 2023
| County | Total | Renters | Owners |
|---|---|---|---|
| Montrose County | 28.2% | 49.8 ( 2,086 ) | 21.3% ( 2,787 ) |
| Mesa County | 31.6% | 49.1 ( 8,347 ) | 25.2% ( 11,696 ) |
Source: U.S. Census Bureau, American Community Survey 5-year estimates, Table: DP04; SELECTED HOUSING CHARACTERISTICS 2023
Gunnison County
2023 Summary
Hispanic/Latino population: 9.9%
Median Age: 37
Educational Attainment
- High School Diploma: 98.3%
- Bachelor’s Degree or higher, age 25+: 59.3%
Median Household Income: $77,358
Employment Status:
- Percent of those 16+ in labor force: 72.6%
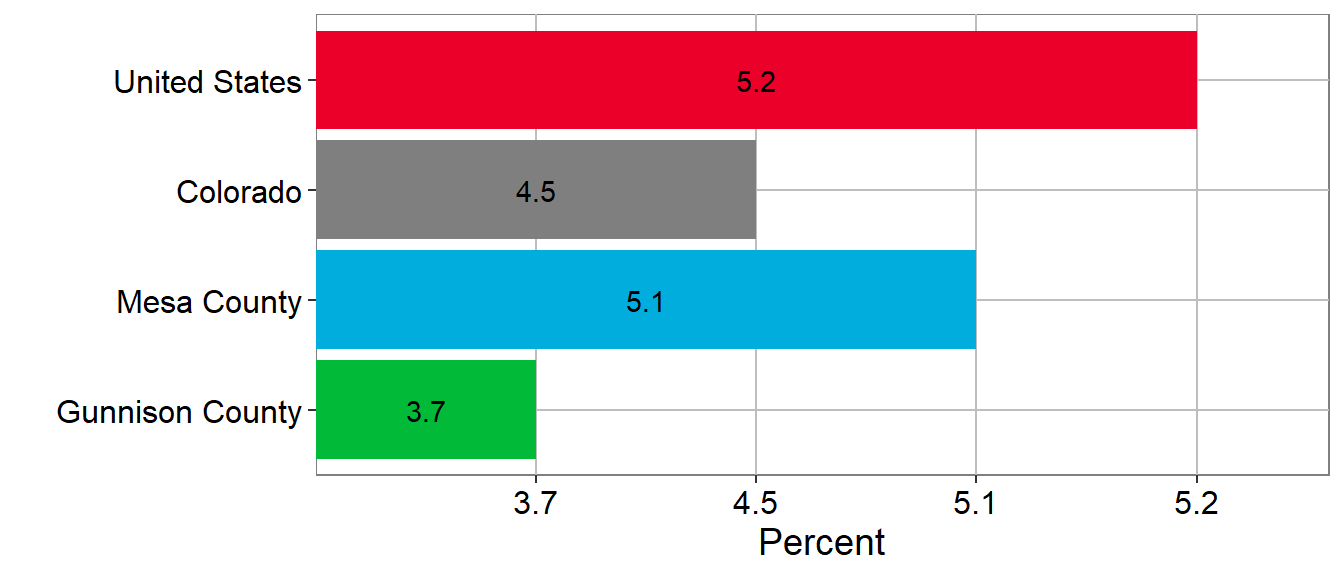
- Unemployment rate: 3.7%
SNAP Usage: 6.2%
Gunnison Population Growth
Population Growth 2014 to 2023
Population Growth 2014 to 2023
Population Growth 2014 to 2023
| Region | 2013 | 2014 | 2015 | 2016 | 2017 | 2018 | 2019 | 2020 | 2021 | 2022 | 2023 |
|---|---|---|---|---|---|---|---|---|---|---|---|
| Colorado | 0.0% | 1.5% | 3.1% | 4.7% | 6.2% | 8.0% | 9.6% | 11.0% | 11.8% | 12.7% | 13.5% |
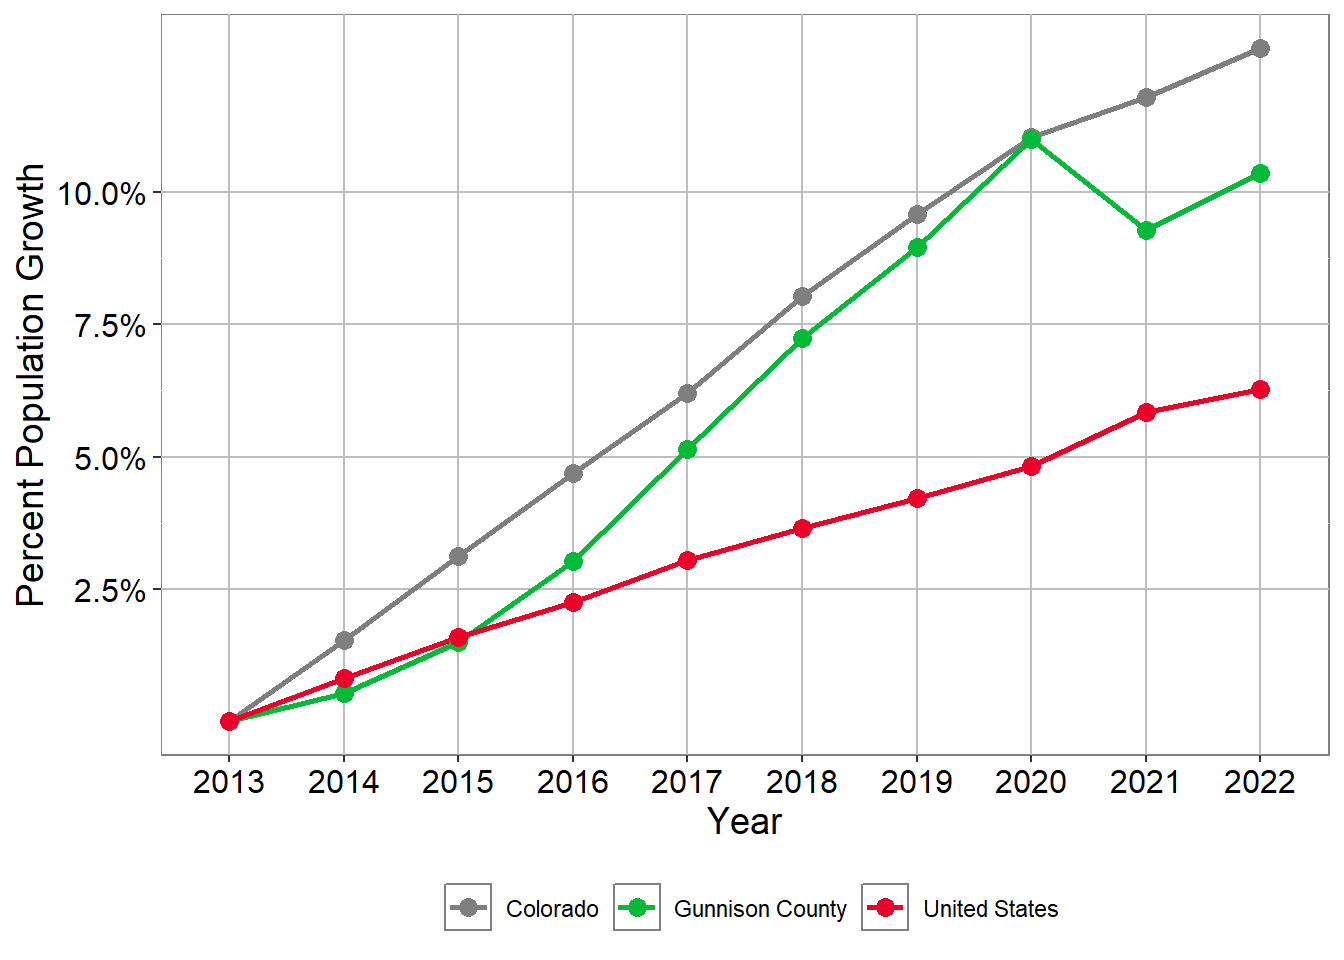
| Gunnison County | 0.0% | 0.5% | 1.5% | 3.0% | 5.1% | 7.2% | 9.0% | 11.0% | 9.3% | 10.4% | 11.3% |
| Mesa County | 0.0% | 0.1% | 0.3% | 0.5% | 0.9% | 1.7% | 2.6% | 3.8% | 4.9% | 5.9% | 6.7% |
| United States | 0.0% | 0.8% | 1.6% | 2.3% | 3.0% | 3.6% | 4.2% | 4.8% | 5.8% | 6.3% | 6.7% |
Source: U.S. Census Bureau, American Community Survey 5-year estimates, Table: B01003; TOTAL POPULATION 2023
Gunnison Median Age
Median Age 2023
Median Age
Median Age
| Region | 2013 | 2014 | 2015 | 2016 | 2017 | 2018 | 2019 | 2020 | 2021 | 2022 | 2023 |
|---|---|---|---|---|---|---|---|---|---|---|---|
| Colorado | 36.1 | 36.2 | 36.3 | 36.4 | 36.5 | 36.6 | 36.7 | 36.9 | 37.1 | 37.3 | 37.5 |
| Gunnison County | 34.1 | 34.2 | 34.3 | 34.4 | 34.5 | 34.5 | 34.5 | 34.8 | 36.1 | 36.4 | 37.0 |
| Mesa County | 38.2 | 38.2 | 38.4 | 38.8 | 38.9 | 39.1 | 39.7 | 40.0 | 40.3 | 40.6 | 40.8 |
| United States | 37.3 | 37.4 | 37.6 | 37.7 | 37.8 | 37.9 | 38.1 | 38.2 | 38.4 | 38.5 | 38.7 |
Source: U.S. Census Bureau, American Community Survey 5-year estimates, Table: 01002; MEDIAN AGE BY SEX 2023
Gunnison Race
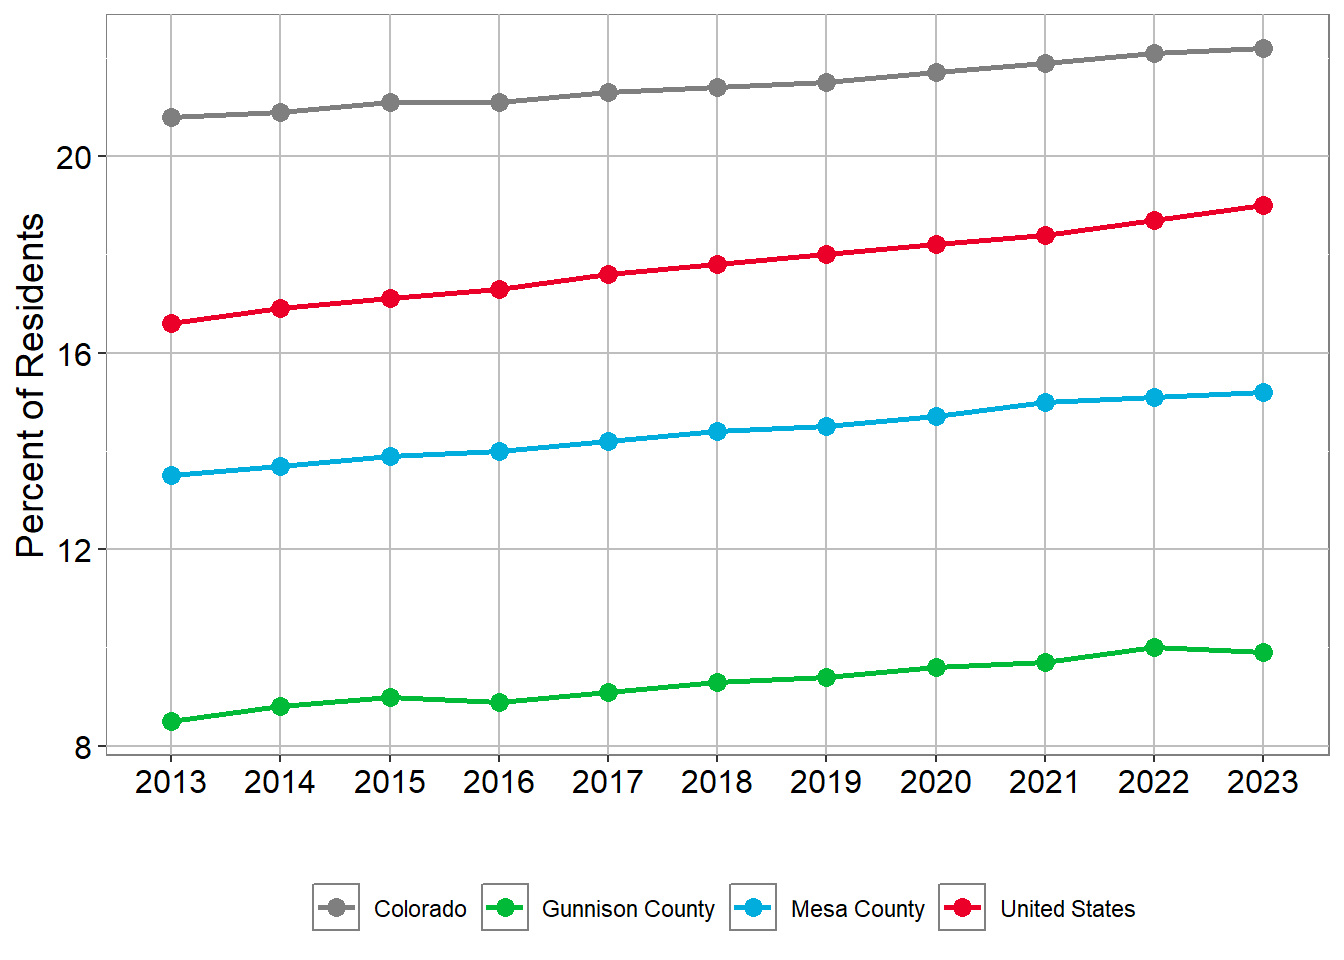
Residents with Race other than White Alone (people of color) in 2023
Residents with Race other than White Alone (people of color)
Residents with Race other than White Alone (people of color)
| Region | 2013 | 2014 | 2015 | 2016 | 2017 | 2018 | 2019 | 2020 | 2021 | 2022 | 2023 |
|---|---|---|---|---|---|---|---|---|---|---|---|
| Colorado | 30.3 | 30.6 | 30.9 | 31.0 | 31.4 | 31.7 | 31.9 | 32.5 | 33.2 | 33.8 | 34.3 |
| Gunnison County | 11.5 | 11.8 | 12.1 | 12.1 | 12.6 | 12.8 | 13.1 | 13.5 | 14.4 | 14.9 | 15.3 |
| Mesa County | 17.3 | 17.6 | 17.9 | 18.0 | 18.2 | 18.5 | 18.6 | 19.1 | 19.8 | 20.4 | 21.0 |
| United States | 36.7 | 37.2 | 37.7 | 38.0 | 38.5 | 38.9 | 39.3 | 39.9 | 40.6 | 41.1 | 41.8 |
Source: U.S. Census Bureau, American Community Survey 5-year estimates, Tables: B01001H; SEX BY AGE (WHITE ALONE, NOT HISPANIC OR LATINO), and B01003; TOTAL POPULATION 2023
Gunnison Hispanic Population
Residents age 5+ Speaking Spanish at Home in 2023
Residents age 5+ Speaking Spanish at Home
Residents age 5+ Speaking Spanish at Home
| Region | 2015 | 2016 | 2017 | 2018 | 2019 | 2020 | 2021 | 2022 | 2023 |
|---|---|---|---|---|---|---|---|---|---|
| Colorado | 11.8% | 11.9% | 11.8% | 11.8% | 11.7% | 11.2% | 11.1% | 11.0% | 11.0% |
| Gunnison County | 6.7% | 6.5% | 7.1% | 7.7% | 8.2% | 7.1% | 6.0% | 5.1% | 5.0% |
| Mesa County | 5.6% | 5.4% | 5.2% | 5.7% | 5.4% | 5.1% | 4.9% | 5.0% | 5.3% |
| United States | 13.0% | 13.1% | 13.2% | 13.3% | 13.4% | 13.2% | 13.3% | 13.3% | 13.4% |
Source: U.S. Census Bureau, American Community Survey 5-year estimates, Tables: S1101; HOUSEHOLDS AND FAMILIES, and S1601; LANGUAGE SPOKEN AT HOME 2023
Residents who are Hispanic or Latino in 2023
Residents who are Hispanic or Latino
Residents who are Hispanic or Latino
| Region | 2013 | 2014 | 2015 | 2016 | 2017 | 2018 | 2019 | 2020 | 2021 | 2022 | 2023 |
|---|---|---|---|---|---|---|---|---|---|---|---|
| Colorado | 20.8% | 20.9% | 21.1% | 21.1% | 21.3% | 21.4% | 21.5% | 21.7% | 21.9% | 22.1% | 22.2% |
| Gunnison County | 8.5% | 8.8% | 9.0% | 8.9% | 9.1% | 9.3% | 9.4% | 9.6% | 9.7% | 10.0% | 9.9% |
| Mesa County | 13.5% | 13.7% | 13.9% | 14.0% | 14.2% | 14.4% | 14.5% | 14.7% | 15.0% | 15.1% | 15.2% |
| United States | 16.6% | 16.9% | 17.1% | 17.3% | 17.6% | 17.8% | 18.0% | 18.2% | 18.4% | 18.7% | 19.0% |
Source: U.S. Census Bureau, American Community Survey 5-year estimates, Table: B03003; HISPANIC OR LATINO ORIGIN 2023
Gunnison Educational Attainment
Percent of people age 18 to 24 that are Highschool Graduate’s
| 2017 | 2020 | 2023 | |
|---|---|---|---|
| Gunnison County | 20.9% | 22.7% | 17.1% |
| Mesa County | 27.2% | 29.9% | 33.2% |
| Colorado | 29.5% | 31.5% | 33.8% |
| United States | 30.5% | 31.4% | 34.6% |
Source: U.S. Census Bureau, American Community Survey 5-year estimates, Table: S1501; EDUCATIONAL ATTAINMENT 2023
Percent of people age 18 to 24 that are Bachelor’s Degree’s
| 2017 | 2020 | 2023 | |
|---|---|---|---|
| Gunnison County | 7.1% | 14.3% | 17.4% |
| Mesa County | 4.5% | 7.8% | 7.9% |
| Colorado | 11.5% | 13.2% | 14.3% |
| United States | 10.5% | 11.8% | 12.9% |
Source: U.S. Census Bureau, American Community Survey 5-year estimates, Table: S1501; EDUCATIONAL ATTAINMENT 2023
Percent of people age 25+ that have Bachelor’s Degree’s or higher
Source: U.S. Census Bureau, American Community Survey 5-year estimates, Table: S1501; EDUCATIONAL ATTAINMENT 2023
Over all Educational Attainment age 25+
Source: U.S. Census Bureau, American Community Survey 5-year estimates, Table: B15003; EDUCATIONAL ATTAINMENT FOR THE POPULATION 25 YEARS AND OVER 2023
Gunnison Economic Characteristics
Gunnison Median Income
Gunnison Median Household Income
Gunnison Median Household Income
| Region | 2013 | 2014 | 2015 | 2016 | 2017 | 2018 | 2019 | 2020 | 2021 | 2022 | 2023 |
|---|---|---|---|---|---|---|---|---|---|---|---|
| Colorado | 58,433 | 59,448 | 60,629 | 62,520 | 65,458 | 68,811 | 72,331 | 75,231 | 80,184 | 87,598 | 92,470 |
| Gunnison County | 52,332 | 51,371 | 48,071 | 50,746 | 52,651 | 54,979 | 56,577 | 60,557 | 63,341 | 76,538 | 77,358 |
| Mesa County | 49,471 | 48,610 | 49,322 | 50,070 | 51,971 | 53,683 | 55,379 | 57,157 | 62,127 | 68,077 | 71,485 |
| United States | 53,046 | 53,482 | 53,889 | 55,322 | 57,652 | 60,293 | 62,843 | 64,994 | 69,021 | 75,149 | 78,538 |
Source: U.S. Census Bureau, American Community Survey 5-year estimates, Table: S1901; INCOME IN THE PAST 12 MONTHS (IN 2023 INFLATION-ADJUSTED DOLLARS) 2023
Gunnison Unemployment
Gunnison Work Force, Unemployed Adults 16+ ( 2023 )
Gunnison Work Force, Unemployed Adults 16+
Gunnison Work Force, Unemployed Adults 16+
| 2013 | 2014 | 2015 | 2016 | 2017 | 2018 | 2019 | 2020 | 2021 | 2022 | 2023 | |
|---|---|---|---|---|---|---|---|---|---|---|---|
| Colorado | 8.5% | 7.9% | 6.9% | 6% | 5.2% | 4.7% | 4.3% | 4.6% | 4.6% | 4.5% | 4.5% |
| Gunnison County | 8.3% | 8.8% | 7.8% | 7.1% | 7.3% | 5.8% | 5.1% | 4.2% | 4.2% | 3.6% | 3.7% |
| United States | 9.7% | 9.2% | 8.3% | 7.4% | 6.6% | 5.9% | 5.3% | 5.4% | 5.5% | 5.3% | 5.2% |
Source: U.S. Census Bureau, American Community Survey 5-year estimates, Table: S2301; EMPLOYMENT STATUS 2023
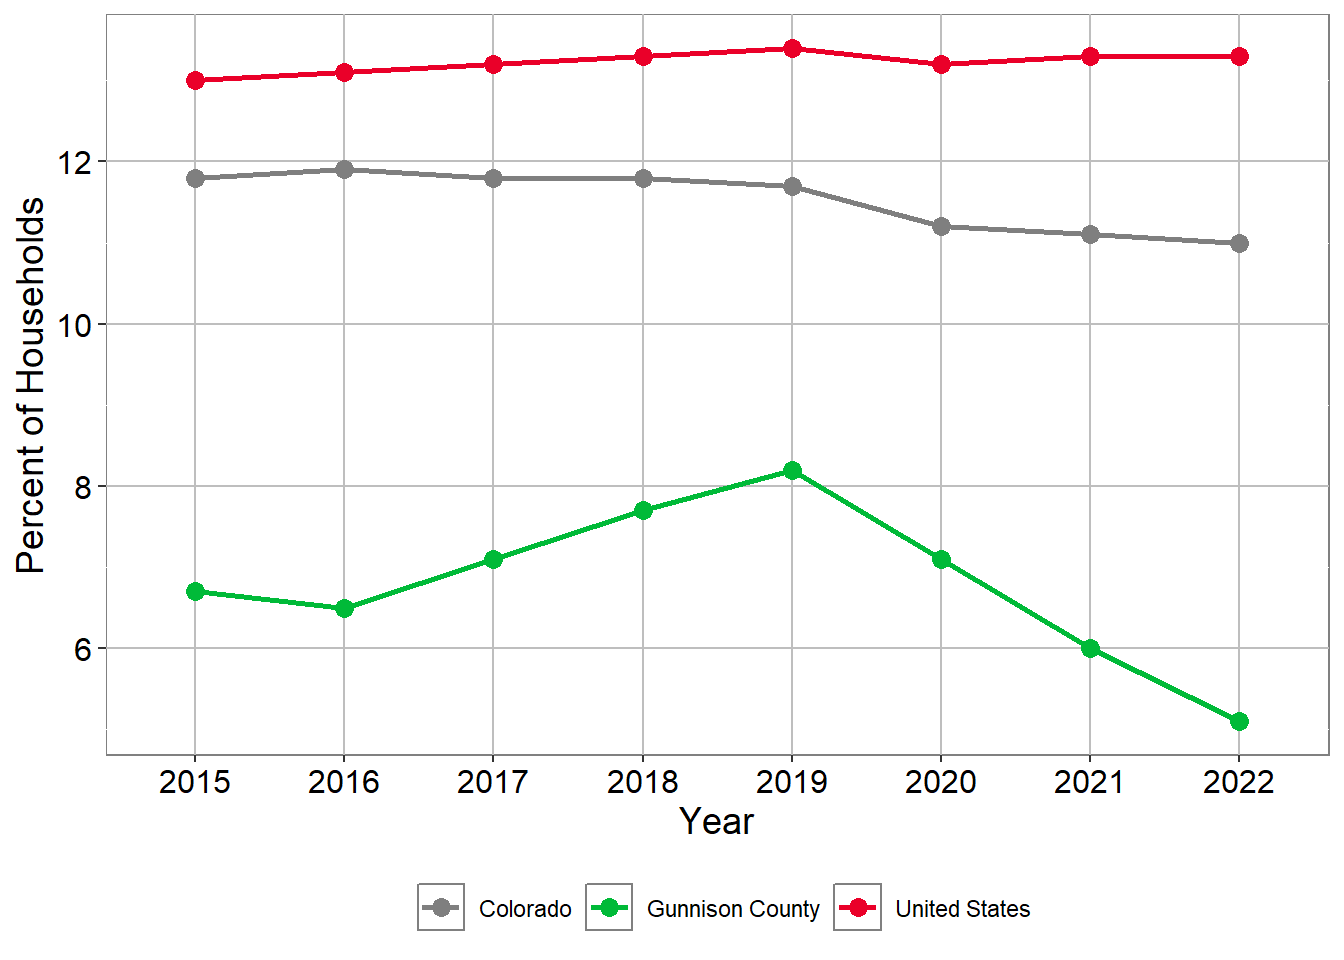
Gunnison SNAP Usage
Gunnison HOUSEHOLD SNAP USAGE (2023)
Gunnison HOUSEHOLD SNAP USAGE
Gunnison HOUSEHOLD SNAP USAGE
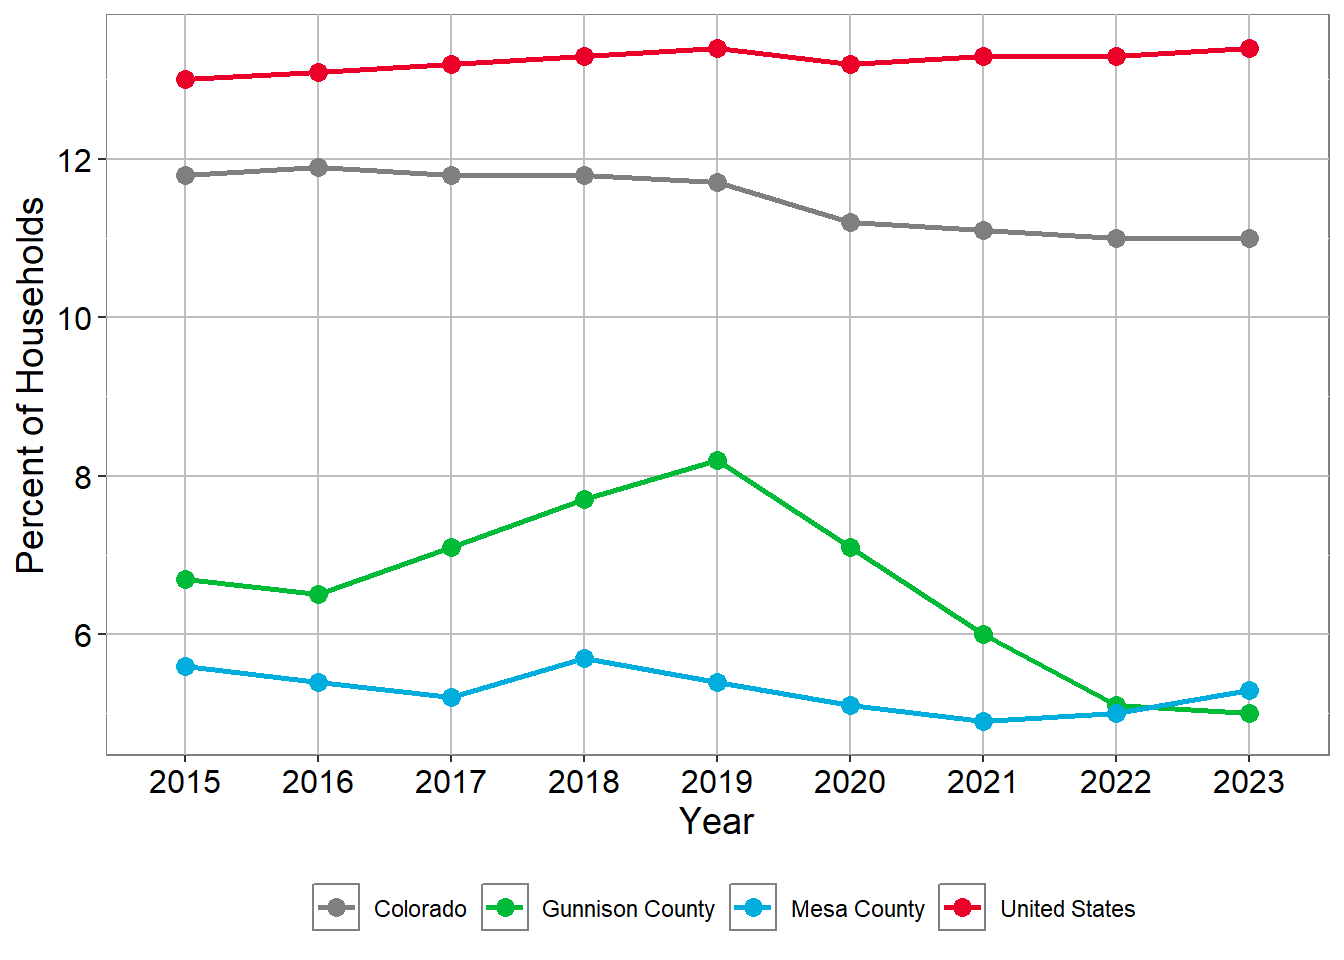
| Region | 2015 | 2016 | 2017 | 2018 | 2019 | 2020 | 2021 | 2022 | 2023 |
|---|---|---|---|---|---|---|---|---|---|
| Colorado | 8.7% | 8.6% | 8.2% | 8.0% | 7.5% | 7.2% | 7.4% | 7.6% | 8.0% |
| Gunnison County | 6.4% | 6.9% | 7.6% | 6.7% | 6.8% | 7.1% | 7.3% | 6.3% | 6.2% |
| Mesa County | 11.3% | 11.7% | 11.3% | 11.5% | 10.8% | 9.7% | 9.6% | 10.1% | 10.6% |
| United States | 13.2% | 13.0% | 12.6% | 12.2% | 11.7% | 11.4% | 11.4% | 11.5% | 11.8% |
Source: U.S. Census Bureau, American Community Survey 5-year estimates, Table: S2201; FOOD STAMPS/SUPPLEMENTAL NUTRITION ASSISTANCE PROGRAM (SNAP) 2023
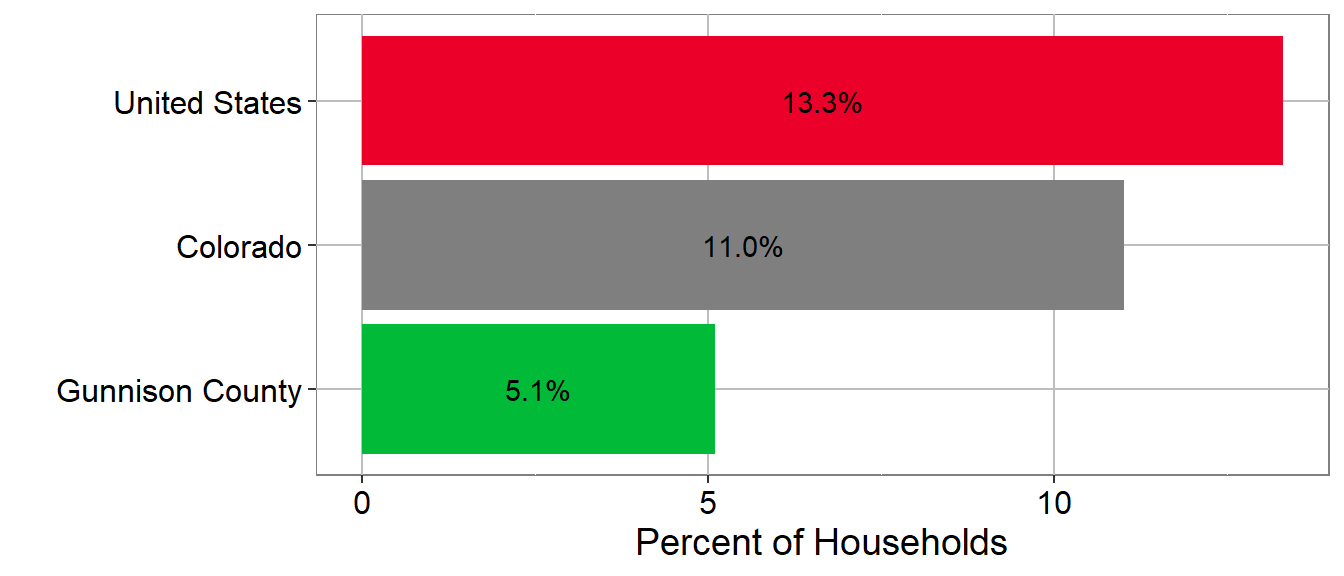
Gunnison Poverty
Gunnison Poverty within a Demographic for 2023
| Demographic | Gunnison County | Mesa County | Colorado | US |
|---|---|---|---|---|
| All Households | 13.1% | 11.2% | 9.4% | 12.4% |
| Households with married adults with children | 6.5% | 11.9% | 9% | 13.5% |
| Single female households with children | 23.9% | 31.8% | 25.9% | 32.6% |
| Individuals 65 and older | 7.1% | 9.8% | 8% | 10.4% |
| Hispanics of any race | 18% | 19.2% | 13.6% | 16.9% |
Source: U.S. Census Bureau, American Community Survey 5-year estimates, Tables: S1701; POVERTY STATUS IN THE PAST 12 MONTHS, and S1702; POVERTY STATUS IN THE PAST 12 MONTHS OF FAMILIES 2023
Gunnison County Total Poverty Percent of Households
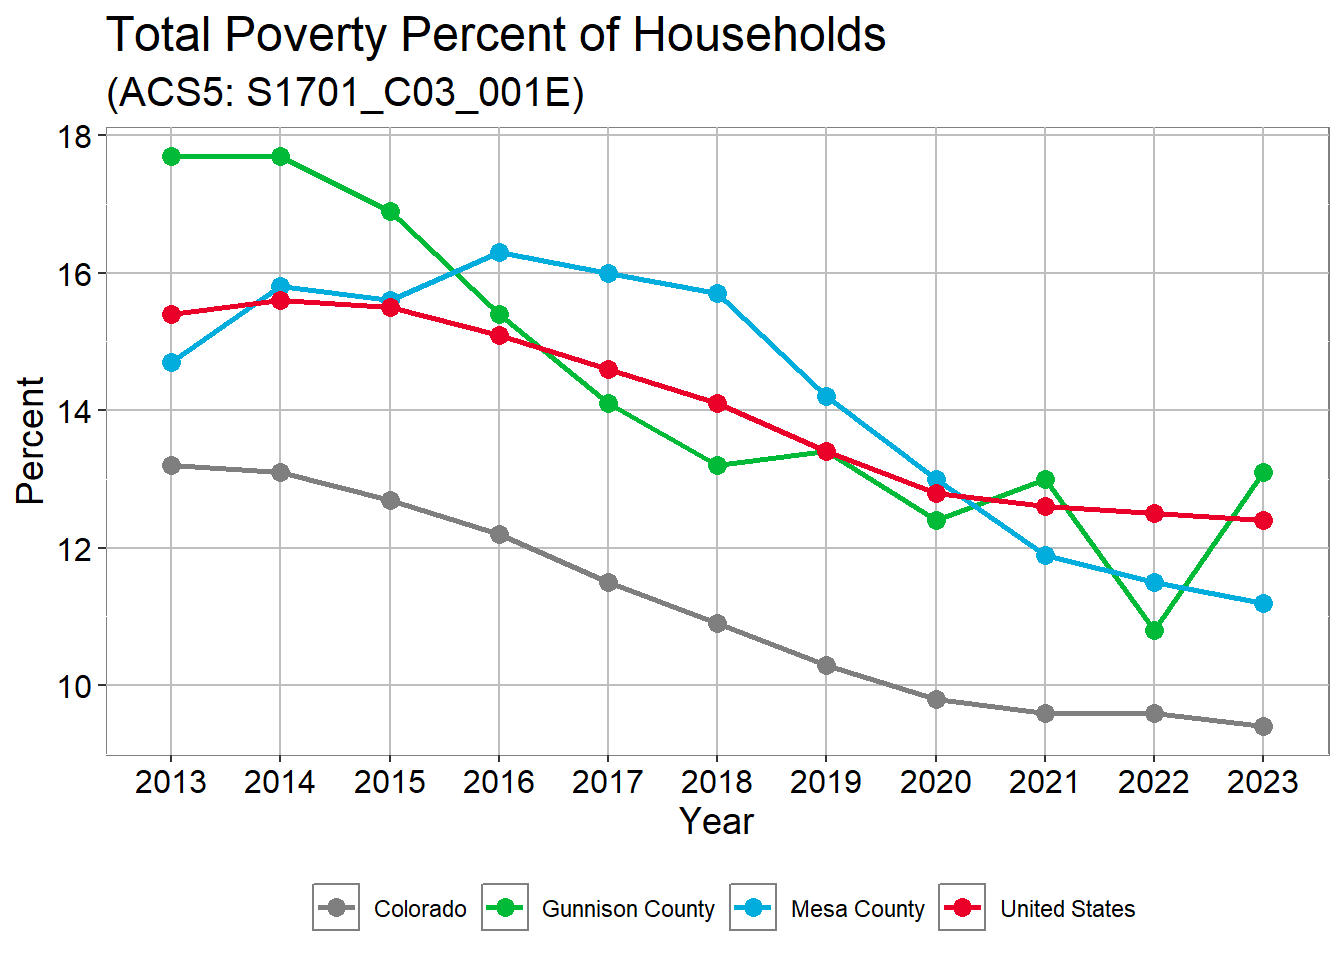
Gunnison County Total Poverty Percent of Households
| name | 2013 | 2014 | 2015 | 2016 | 2017 | 2018 | 2019 | 2020 | 2021 | 2022 | 2023 |
|---|---|---|---|---|---|---|---|---|---|---|---|
| Colorado | 13.2% | 13.1% | 12.7% | 12.2% | 11.5% | 10.9% | 10.3% | 9.8% | 9.6% | 9.6% | 9.4% |
| Gunnison County | 17.7% | 17.7% | 16.9% | 15.4% | 14.1% | 13.2% | 13.4% | 12.4% | 13.0% | 10.8% | 13.1% |
| Mesa County | 14.7% | 15.8% | 15.6% | 16.3% | 16.0% | 15.7% | 14.2% | 13.0% | 11.9% | 11.5% | 11.2% |
| United States | 15.4% | 15.6% | 15.5% | 15.1% | 14.6% | 14.1% | 13.4% | 12.8% | 12.6% | 12.5% | 12.4% |
Source: U.S. Census Bureau, American Community Survey 5-year estimates, Table: S1701; POVERTY STATUS IN THE PAST 12 MONTHS 2023
Gunnison Housing
Gunnison Percent Renter-occupied housing
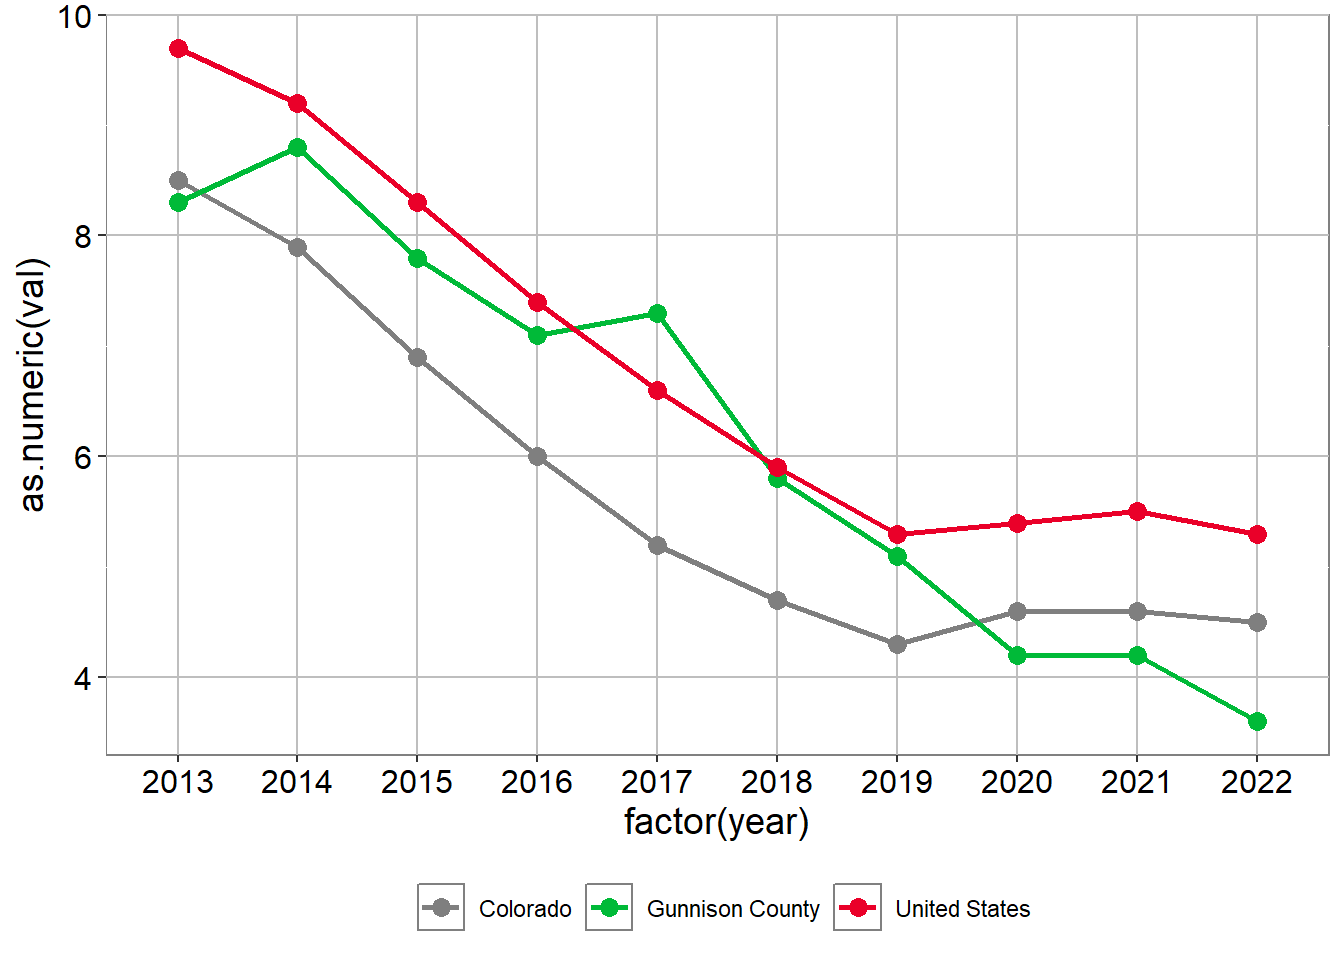
Gunnison Percent Renter-occupied housing
| Region | 2014 | 2015 | 2016 | 2017 | 2018 | 2019 | 2020 | 2021 | 2022 | 2023 |
|---|---|---|---|---|---|---|---|---|---|---|
| Colorado | 35.2% | 35.7% | 35.6% | 35.3% | 35.1% | 34.8% | 33.8% | 33.9% | 33.8% | 33.7% |
| Gunnison County | 41.1% | 40.7% | 41.4% | 41.3% | 38.9% | 38.6% | 34.6% | 36.1% | 36.9% | 33.1% |
| Mesa County | 30.3% | 30.9% | 32.0% | 33.0% | 32.8% | 31.8% | 30.9% | 29.6% | 28.2% | 28.1% |
| United States | 35.6% | 36.1% | 36.4% | 36.2% | 36.2% | 36.0% | 35.6% | 35.4% | 35.2% | 35.0% |
Source: U.S. Census Bureau, American Community Survey 5-year estimates, Table: DP04; SELECTED HOUSING CHARACTERISTICS 2023
Gunnison Housing Burden: Percent of households where housing cost exceed 30% of income in 2023
| County | Total | Renters | Owners |
|---|---|---|---|
| Gunnison County | 34.2% | 51.4 ( 1,293 ) | 26% ( 1,375 ) |
| Mesa County | 31.6% | 49.1 ( 8,347 ) | 25.2% ( 11,696 ) |
Source: U.S. Census Bureau, American Community Survey 5-year estimates, Table: DP04; SELECTED HOUSING CHARACTERISTICS 2023
Garfield County
2023 Summary
Hispanic/Latino population: 32.0%
Median Age: 37.2
Educational Attainment
- High School Diploma: 88.4%
- Bachelor’s Degree or higher, age 25+: 33.4%
Median Household Income: $86,172
Employment Status:
- Percent of those 16+ in labor force: 73.0%
- Unemployment rate: 3.6%
SNAP Usage: 8.6%
Garfield Population Growth
Population Growth 2014 to 2023
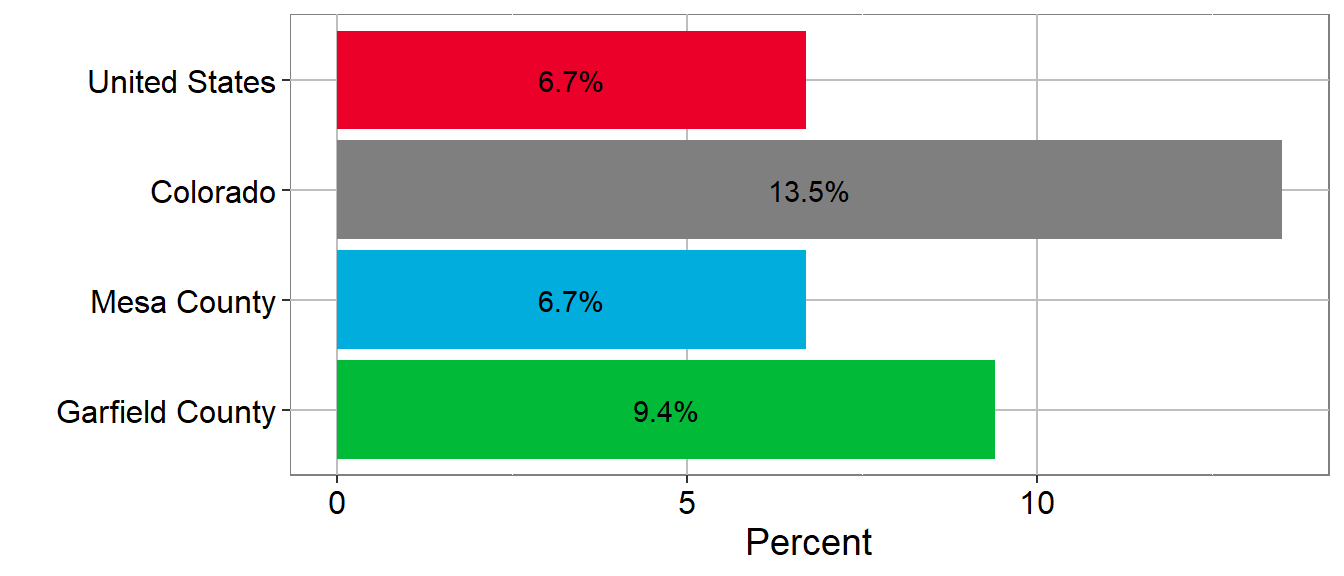
Population Growth 2014 to 2023
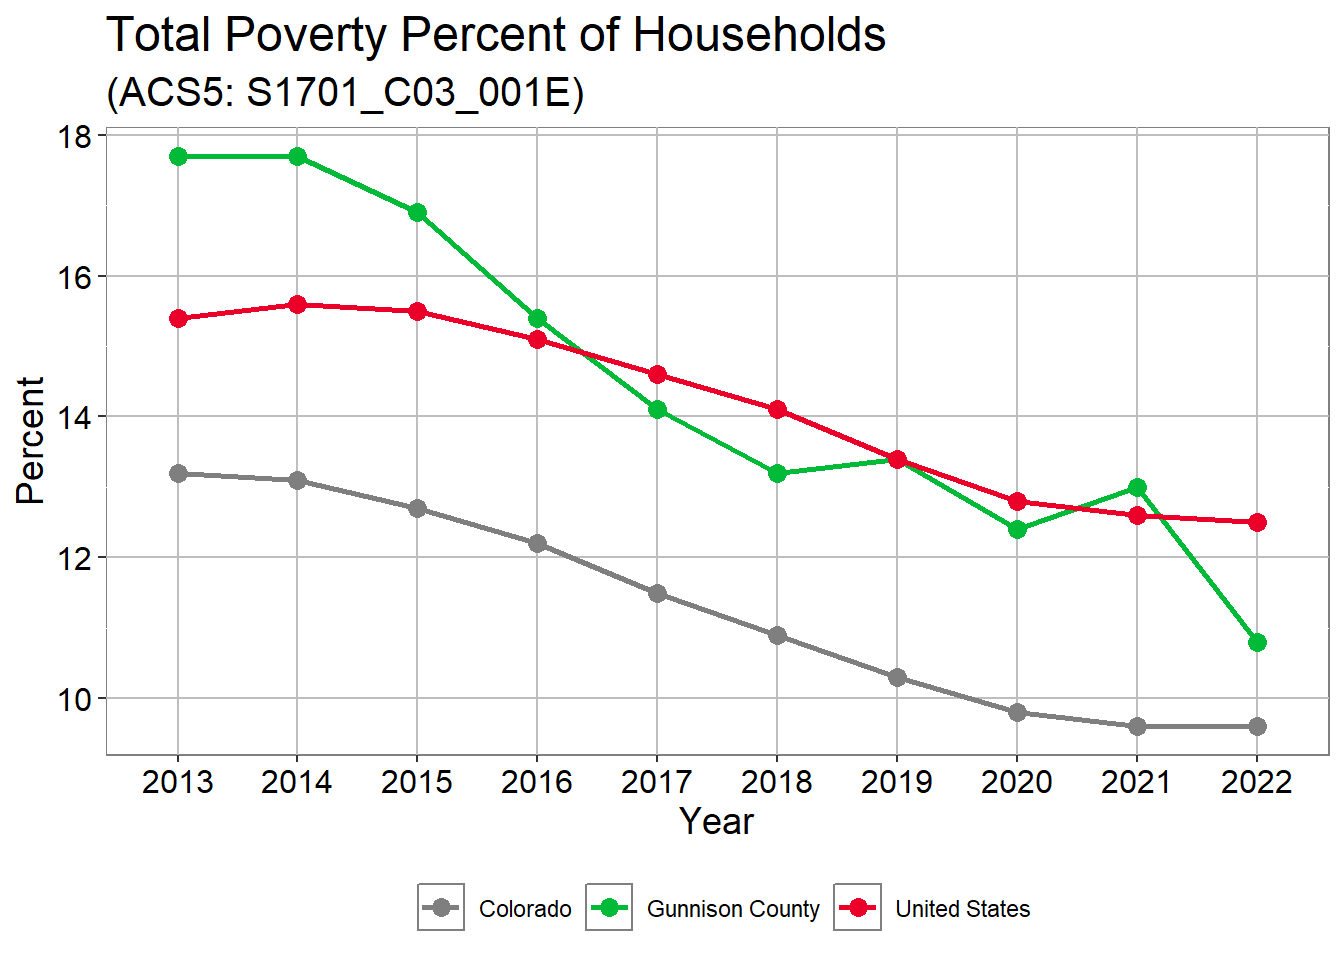
Population Growth 2014 to 2023
| Region | 2013 | 2014 | 2015 | 2016 | 2017 | 2018 | 2019 | 2020 | 2021 | 2022 | 2023 |
|---|---|---|---|---|---|---|---|---|---|---|---|
| Colorado | 0.0% | 1.5% | 3.1% | 4.7% | 6.2% | 8.0% | 9.6% | 11.0% | 11.8% | 12.7% | 13.5% |
| Garfield County | 0.0% | -0.0% | 0.7% | 1.4% | 2.2% | 3.3% | 4.2% | 5.1% | 8.0% | 8.8% | 9.4% |
| Mesa County | 0.0% | 0.1% | 0.3% | 0.5% | 0.9% | 1.7% | 2.6% | 3.8% | 4.9% | 5.9% | 6.7% |
| United States | 0.0% | 0.8% | 1.6% | 2.3% | 3.0% | 3.6% | 4.2% | 4.8% | 5.8% | 6.3% | 6.7% |
Source: U.S. Census Bureau, American Community Survey 5-year estimates, Table: B01003; TOTAL POPULATION 2023
Garfield Median Age
Median Age 2023
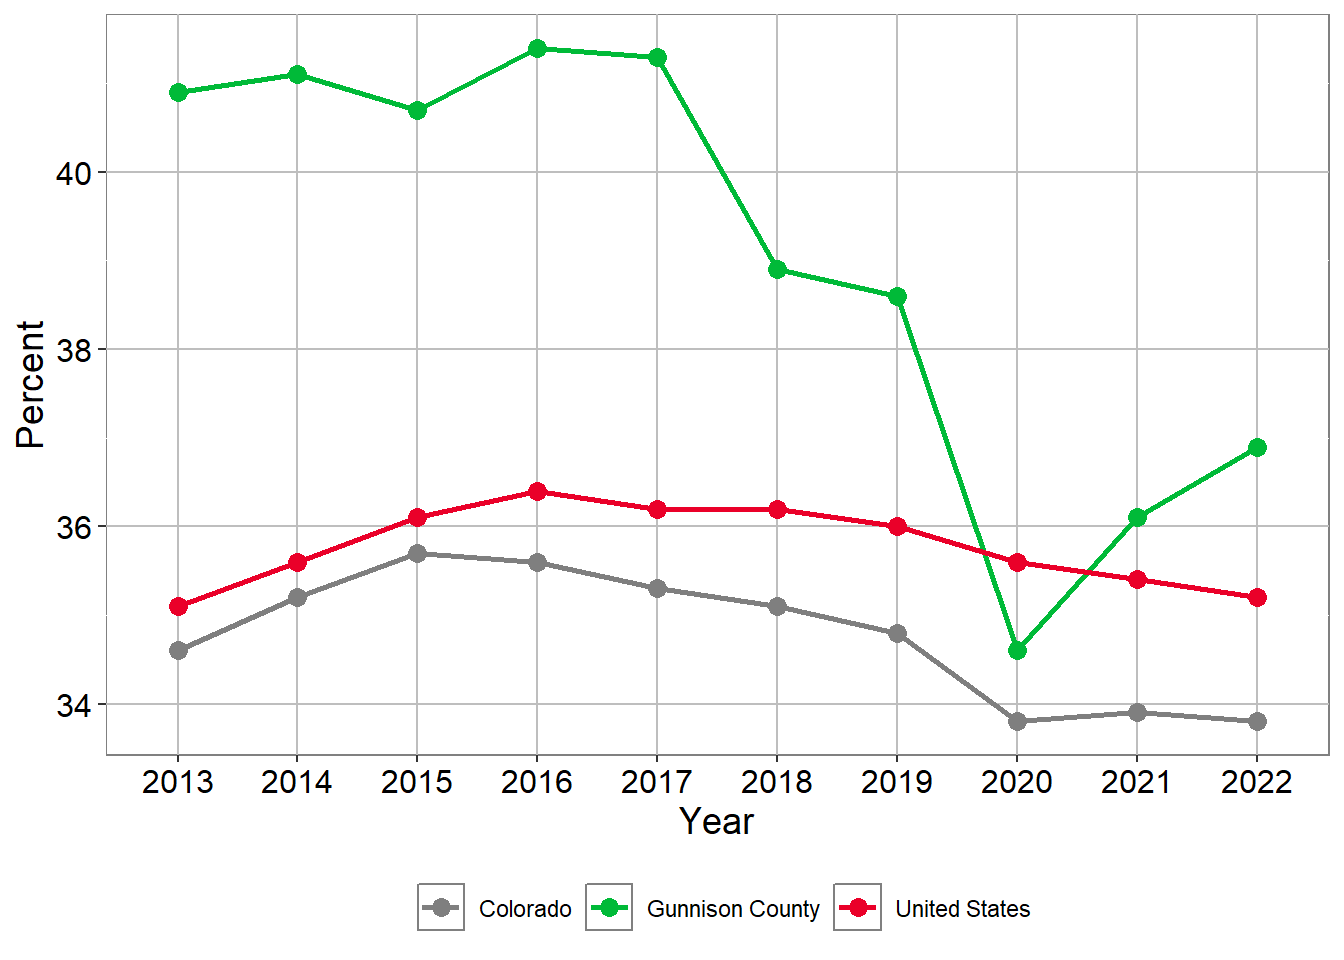
Median Age
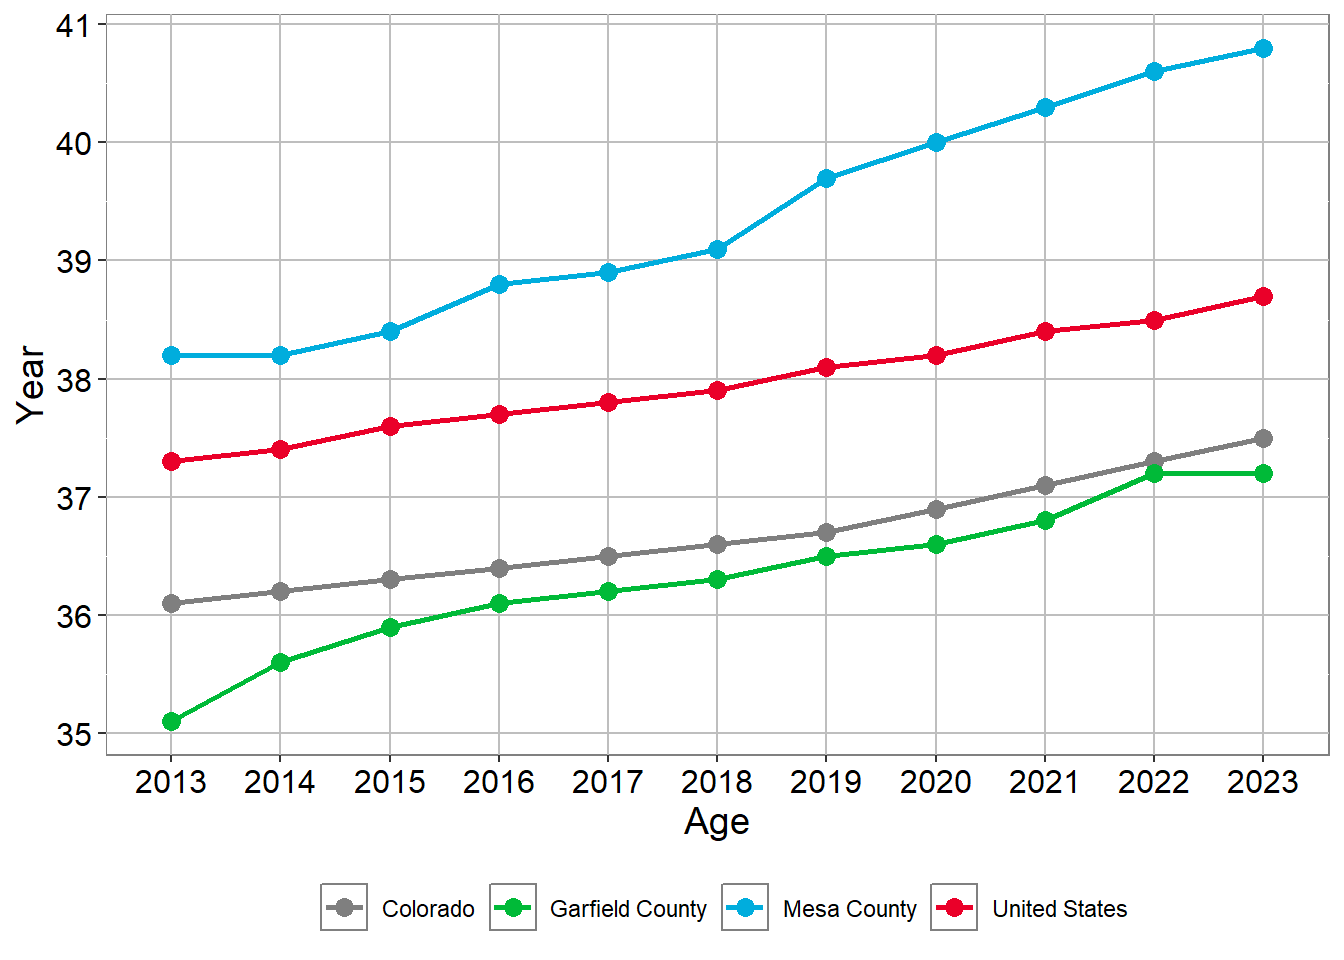
Median Age
| Region | 2013 | 2014 | 2015 | 2016 | 2017 | 2018 | 2019 | 2020 | 2021 | 2022 | 2023 |
|---|---|---|---|---|---|---|---|---|---|---|---|
| Colorado | 36.1 | 36.2 | 36.3 | 36.4 | 36.5 | 36.6 | 36.7 | 36.9 | 37.1 | 37.3 | 37.5 |
| Garfield County | 35.1 | 35.6 | 35.9 | 36.1 | 36.2 | 36.3 | 36.5 | 36.6 | 36.8 | 37.2 | 37.2 |
| Mesa County | 38.2 | 38.2 | 38.4 | 38.8 | 38.9 | 39.1 | 39.7 | 40.0 | 40.3 | 40.6 | 40.8 |
| United States | 37.3 | 37.4 | 37.6 | 37.7 | 37.8 | 37.9 | 38.1 | 38.2 | 38.4 | 38.5 | 38.7 |
Source: U.S. Census Bureau, American Community Survey 5-year estimates, Table: 01002; MEDIAN AGE BY SEX 2023
Garfield Race
Residents with Race other than White Alone (people of color) in 2023
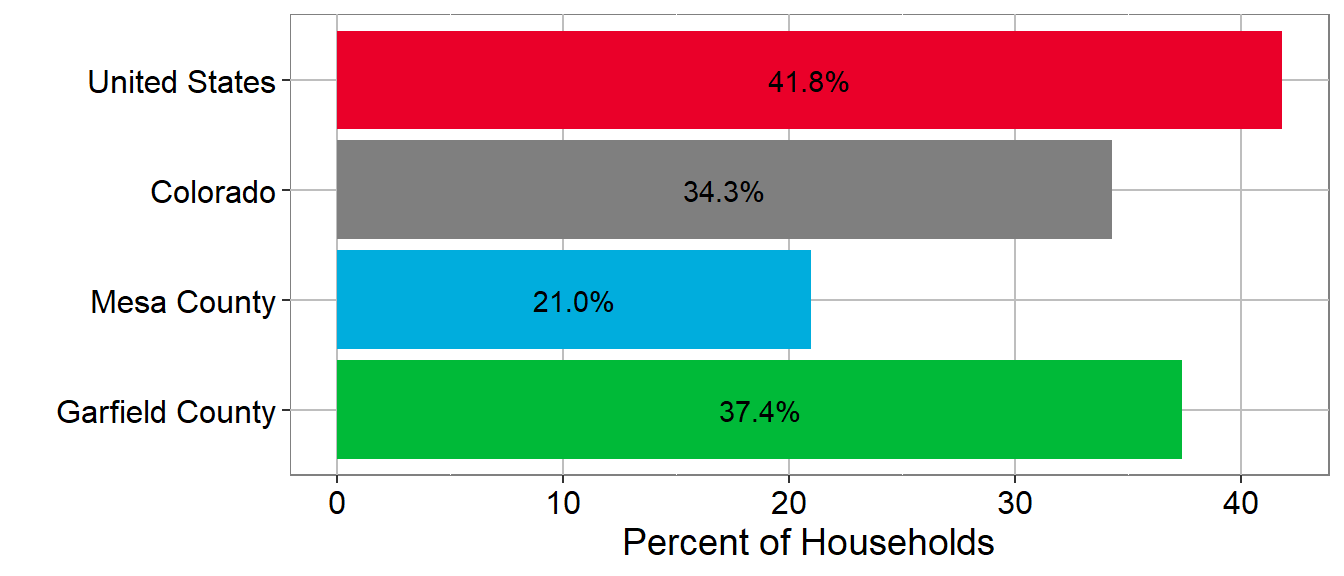
Residents with Race other than White Alone (people of color)
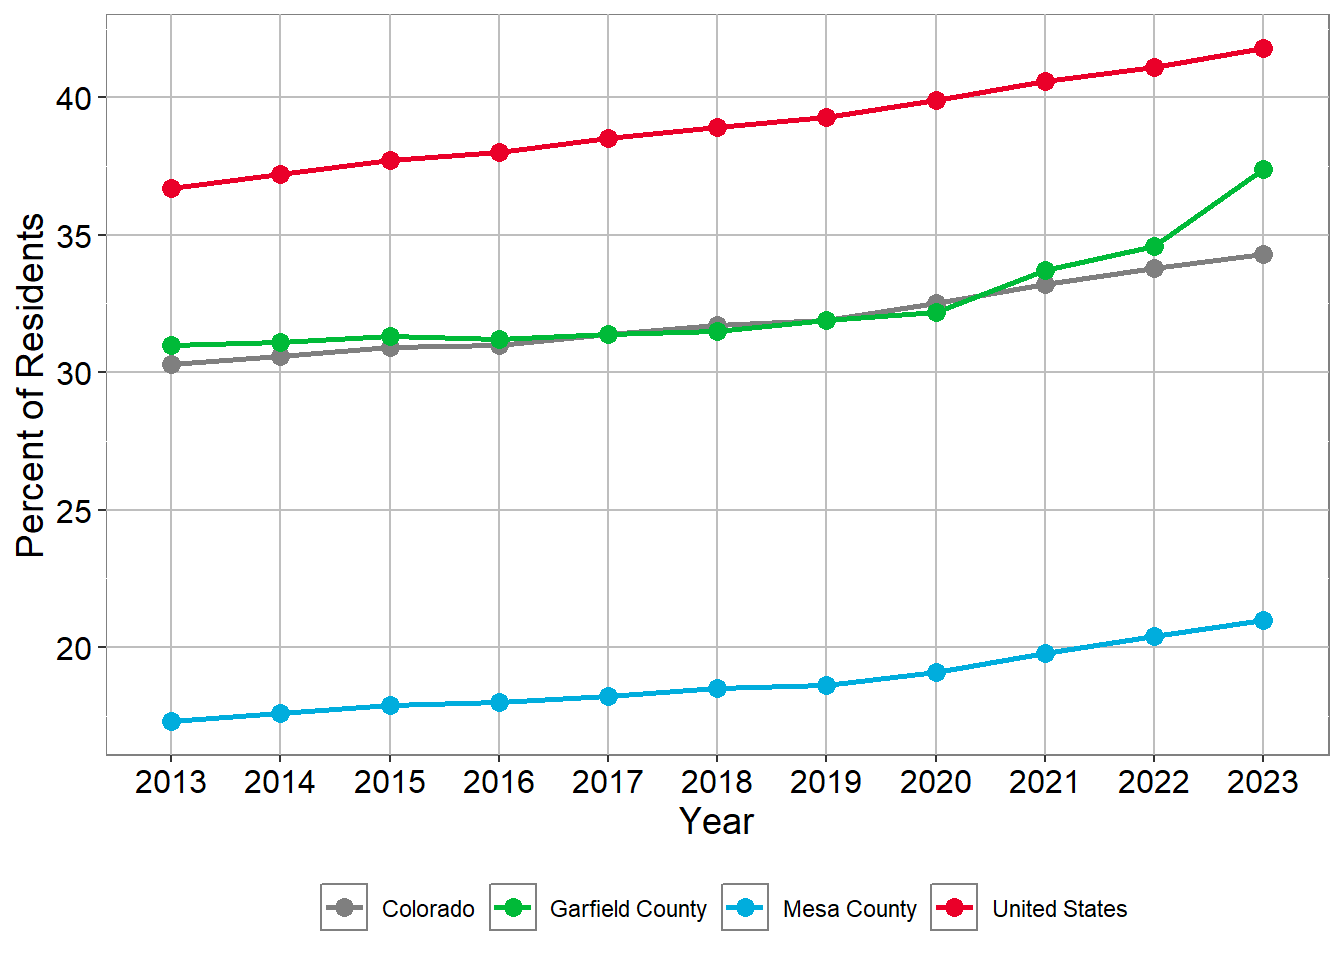
Residents with Race other than White Alone (people of color)
| Region | 2013 | 2014 | 2015 | 2016 | 2017 | 2018 | 2019 | 2020 | 2021 | 2022 | 2023 |
|---|---|---|---|---|---|---|---|---|---|---|---|
| Colorado | 30.3 | 30.6 | 30.9 | 31.0 | 31.4 | 31.7 | 31.9 | 32.5 | 33.2 | 33.8 | 34.3 |
| Garfield County | 31.0 | 31.1 | 31.3 | 31.2 | 31.4 | 31.5 | 31.9 | 32.2 | 33.7 | 34.6 | 37.4 |
| Mesa County | 17.3 | 17.6 | 17.9 | 18.0 | 18.2 | 18.5 | 18.6 | 19.1 | 19.8 | 20.4 | 21.0 |
| United States | 36.7 | 37.2 | 37.7 | 38.0 | 38.5 | 38.9 | 39.3 | 39.9 | 40.6 | 41.1 | 41.8 |
Source: U.S. Census Bureau, American Community Survey 5-year estimates, Tables: B01001H; SEX BY AGE (WHITE ALONE, NOT HISPANIC OR LATINO), and B01003; TOTAL POPULATION 2023
Garfield Hispanic Population
Residents age 5+ Speaking Spanish at Home in 2023
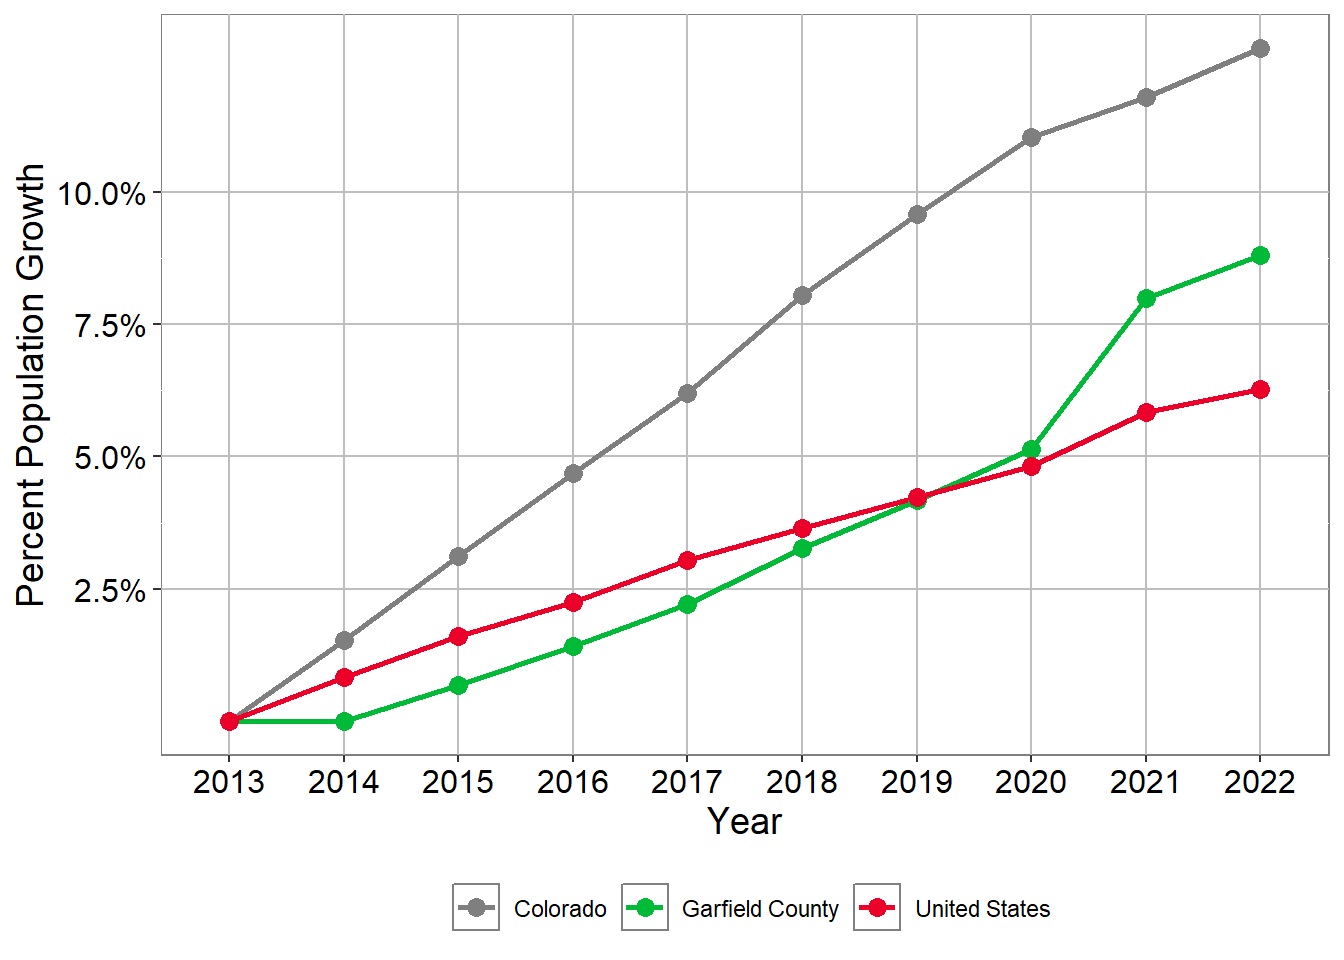
Residents age 5+ Speaking Spanish at Home
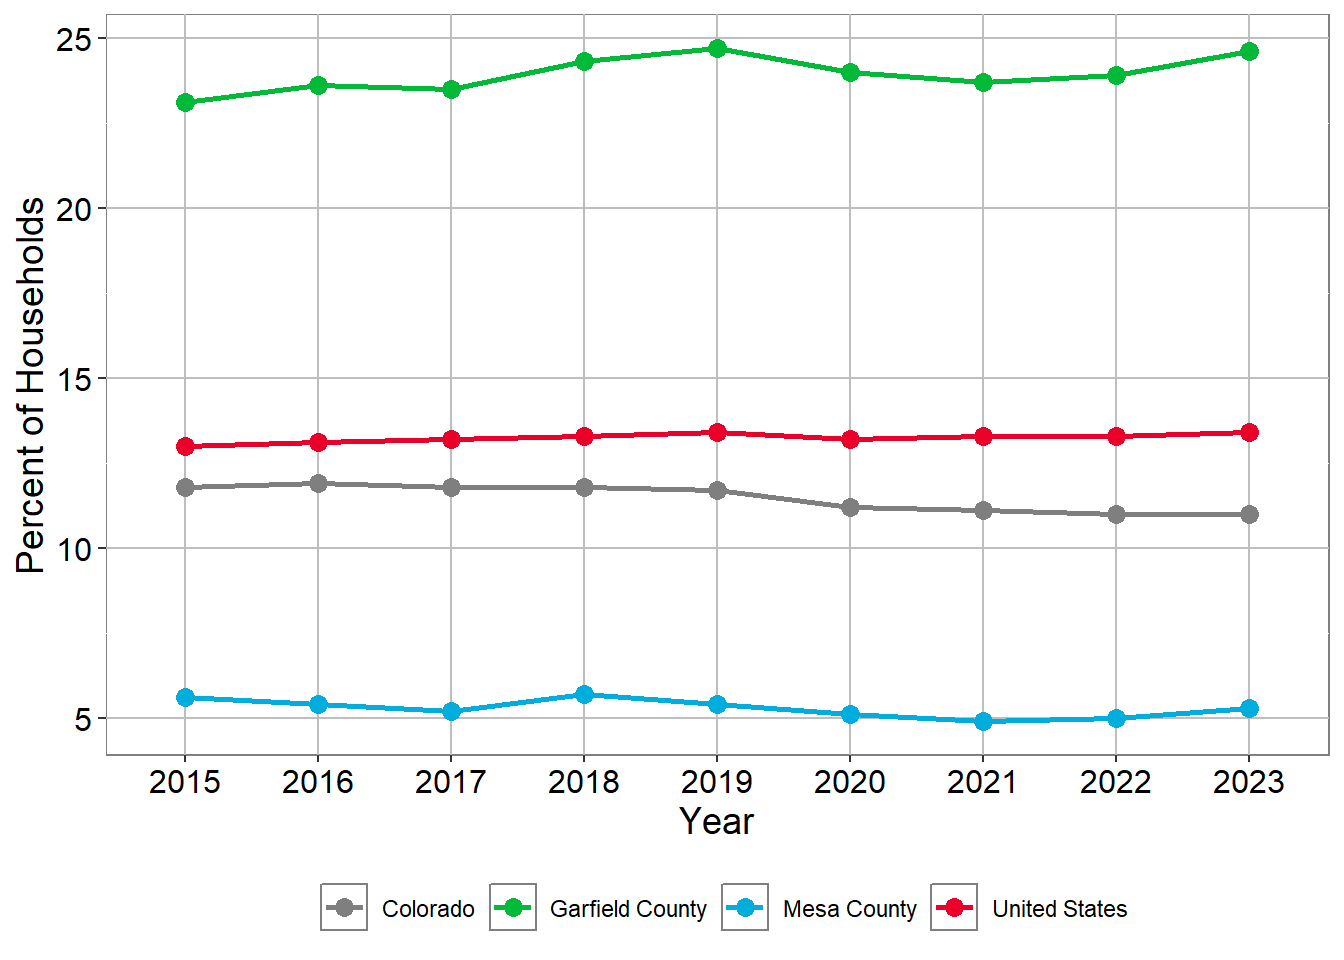
Residents age 5+ Speaking Spanish at Home
| Region | 2015 | 2016 | 2017 | 2018 | 2019 | 2020 | 2021 | 2022 | 2023 |
|---|---|---|---|---|---|---|---|---|---|
| Colorado | 11.8% | 11.9% | 11.8% | 11.8% | 11.7% | 11.2% | 11.1% | 11.0% | 11.0% |
| Garfield County | 23.1% | 23.6% | 23.5% | 24.3% | 24.7% | 24.0% | 23.7% | 23.9% | 24.6% |
| Mesa County | 5.6% | 5.4% | 5.2% | 5.7% | 5.4% | 5.1% | 4.9% | 5.0% | 5.3% |
| United States | 13.0% | 13.1% | 13.2% | 13.3% | 13.4% | 13.2% | 13.3% | 13.3% | 13.4% |
Source: U.S. Census Bureau, American Community Survey 5-year estimates, Tables: S1101; HOUSEHOLDS AND FAMILIES, and S1601; LANGUAGE SPOKEN AT HOME 2023
Residents who are Hispanic or Latino in 2023
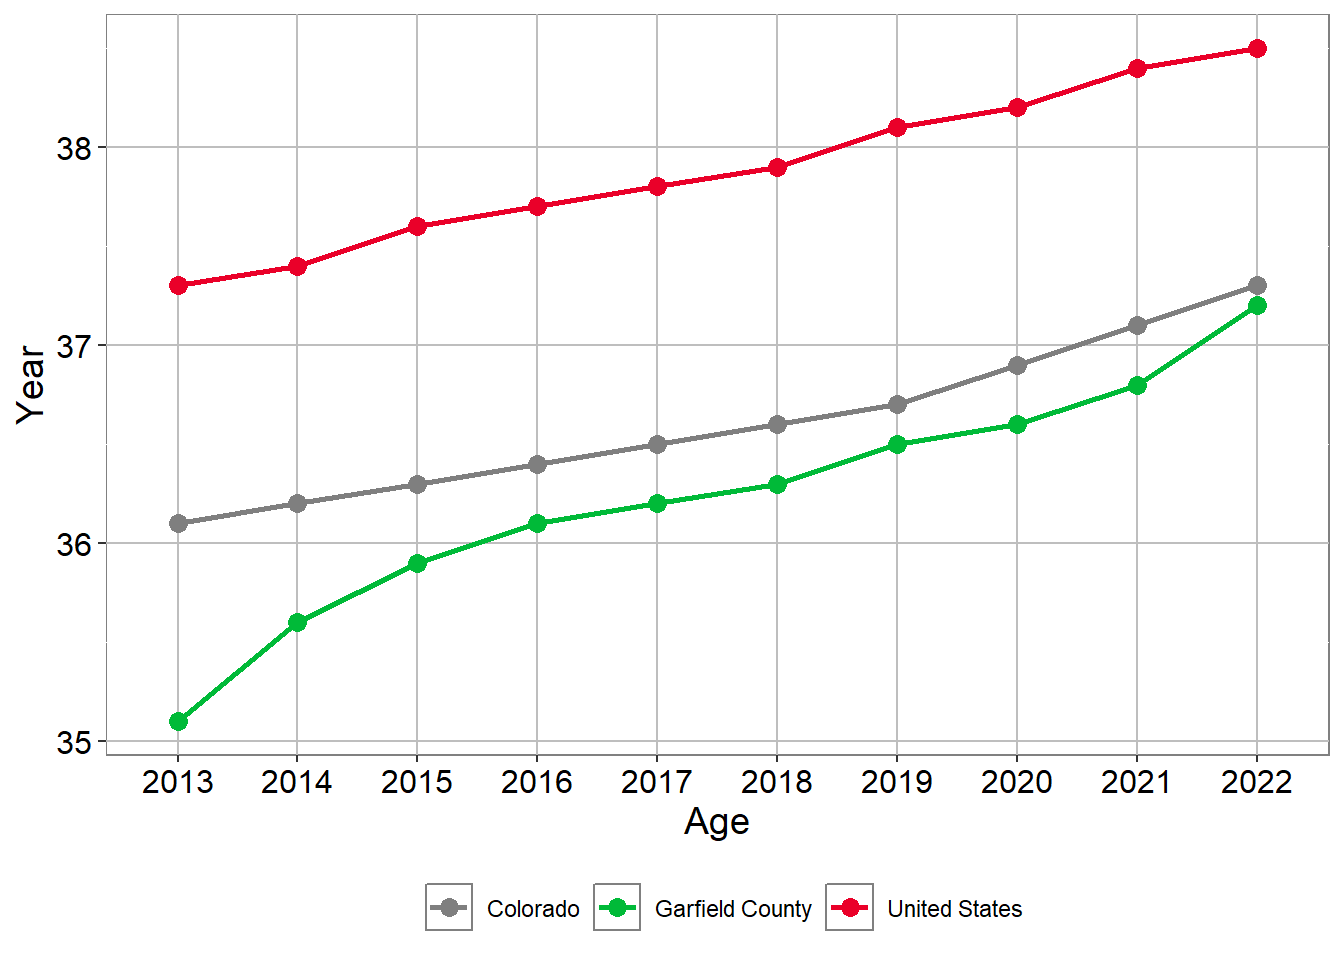
Residents who are Hispanic or Latino
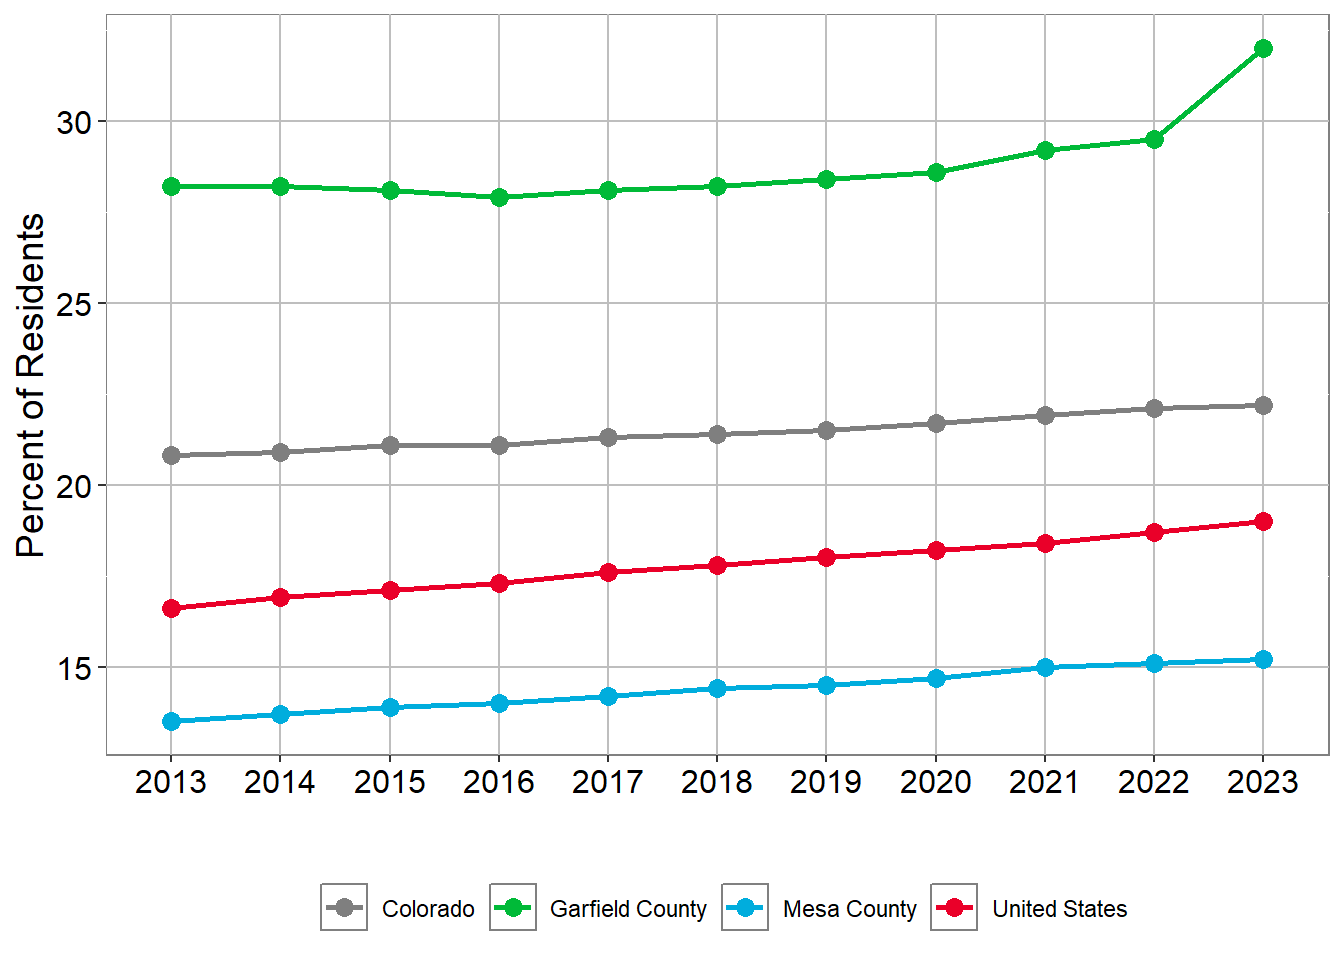
Residents who are Hispanic or Latino
| Region | 2013 | 2014 | 2015 | 2016 | 2017 | 2018 | 2019 | 2020 | 2021 | 2022 | 2023 |
|---|---|---|---|---|---|---|---|---|---|---|---|
| Colorado | 20.8% | 20.9% | 21.1% | 21.1% | 21.3% | 21.4% | 21.5% | 21.7% | 21.9% | 22.1% | 22.2% |
| Garfield County | 28.2% | 28.2% | 28.1% | 27.9% | 28.1% | 28.2% | 28.4% | 28.6% | 29.2% | 29.5% | 32.0% |
| Mesa County | 13.5% | 13.7% | 13.9% | 14.0% | 14.2% | 14.4% | 14.5% | 14.7% | 15.0% | 15.1% | 15.2% |
| United States | 16.6% | 16.9% | 17.1% | 17.3% | 17.6% | 17.8% | 18.0% | 18.2% | 18.4% | 18.7% | 19.0% |
Source: U.S. Census Bureau, American Community Survey 5-year estimates, Table: B03003; HISPANIC OR LATINO ORIGIN 2023
Garfield Educational Attainment
Percent of people age 18 to 24 that are Highschool Graduate’s
| 2017 | 2020 | 2023 | |
|---|---|---|---|
| Garfield County | 35.9% | 37.5% | 43.8% |
| Mesa County | 27.2% | 29.9% | 33.2% |
| Colorado | 29.5% | 31.5% | 33.8% |
| United States | 30.5% | 31.4% | 34.6% |
Source: U.S. Census Bureau, American Community Survey 5-year estimates, Table: S1501; EDUCATIONAL ATTAINMENT 2023
Percent of people age 18 to 24 that are Bachelor’s Degree’s
| 2017 | 2020 | 2023 | |
|---|---|---|---|
| Garfield County | 5.7% | 7.5% | 9.4% |
| Mesa County | 4.5% | 7.8% | 7.9% |
| Colorado | 11.5% | 13.2% | 14.3% |
| United States | 10.5% | 11.8% | 12.9% |
Source: U.S. Census Bureau, American Community Survey 5-year estimates, Table: S1501; EDUCATIONAL ATTAINMENT 2023
Percent of people age 25+ that have Bachelor’s Degree’s or higher
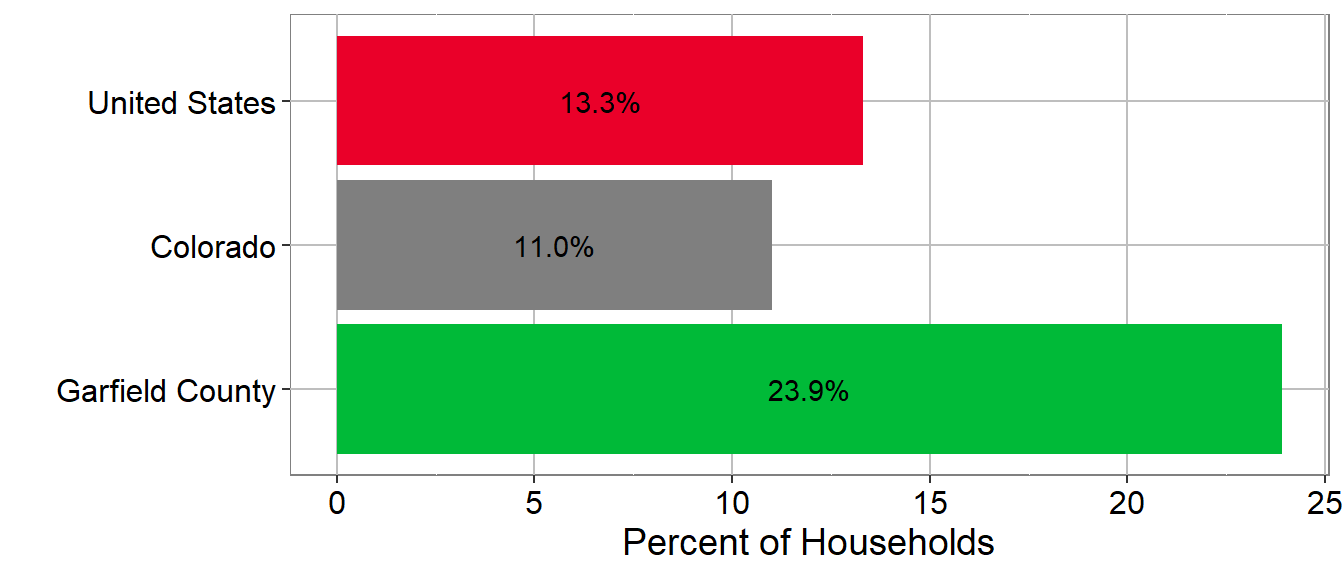
Source: U.S. Census Bureau, American Community Survey 5-year estimates, Table: S1501; EDUCATIONAL ATTAINMENT 2023
Over all Educational Attainment age 25+
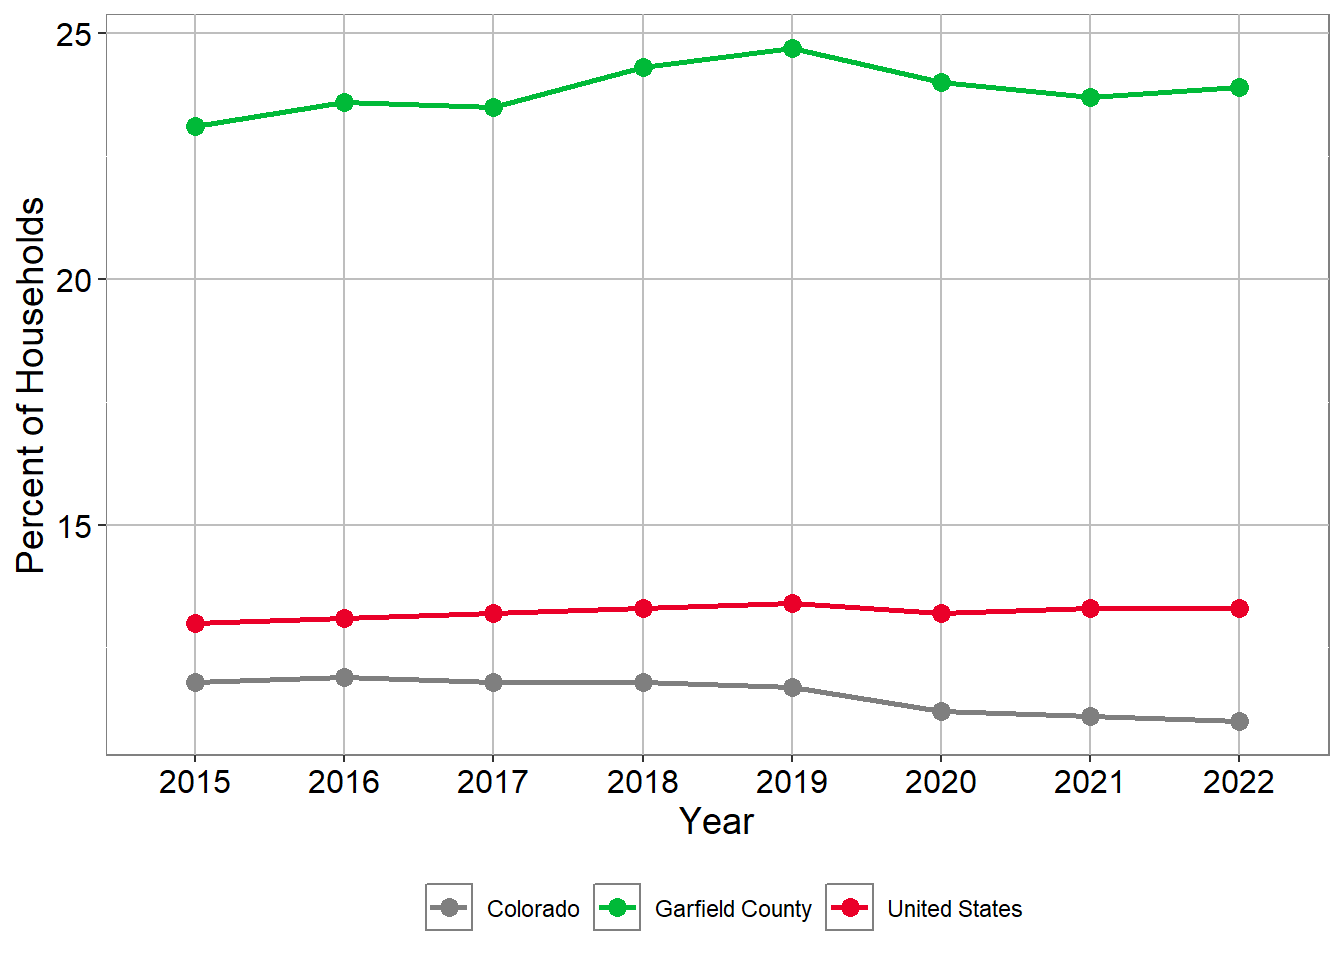
Source: U.S. Census Bureau, American Community Survey 5-year estimates, Table: B15003; EDUCATIONAL ATTAINMENT FOR THE POPULATION 25 YEARS AND OVER 2023
Garfield Economic Characteristics
Garfield Median Income
Garfield Median Household Income
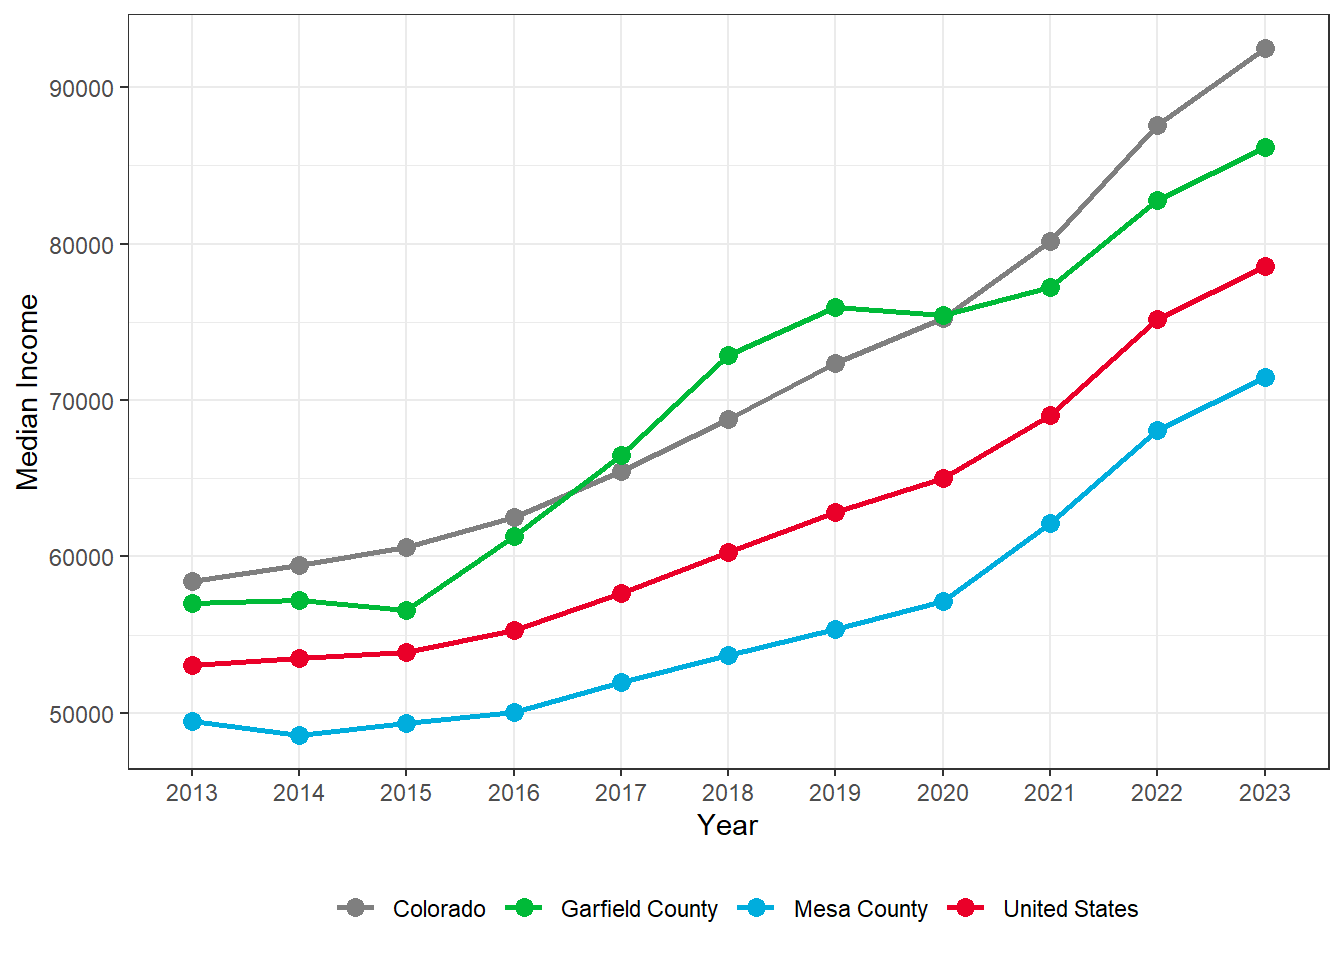
Garfield Median Household Income
| Region | 2013 | 2014 | 2015 | 2016 | 2017 | 2018 | 2019 | 2020 | 2021 | 2022 | 2023 |
|---|---|---|---|---|---|---|---|---|---|---|---|
| Colorado | 58,433 | 59,448 | 60,629 | 62,520 | 65,458 | 68,811 | 72,331 | 75,231 | 80,184 | 87,598 | 92,470 |
| Garfield County | 57,022 | 57,214 | 56,590 | 61,300 | 66,503 | 72,898 | 75,937 | 75,435 | 77,212 | 82,772 | 86,172 |
| Mesa County | 49,471 | 48,610 | 49,322 | 50,070 | 51,971 | 53,683 | 55,379 | 57,157 | 62,127 | 68,077 | 71,485 |
| United States | 53,046 | 53,482 | 53,889 | 55,322 | 57,652 | 60,293 | 62,843 | 64,994 | 69,021 | 75,149 | 78,538 |
Source: U.S. Census Bureau, American Community Survey 5-year estimates, Table: S1901; INCOME IN THE PAST 12 MONTHS (IN 2023 INFLATION-ADJUSTED DOLLARS) 2023
Garfield Unemployment
Garfield Work Force, Unemployed Adults 16+ ( 2023 )
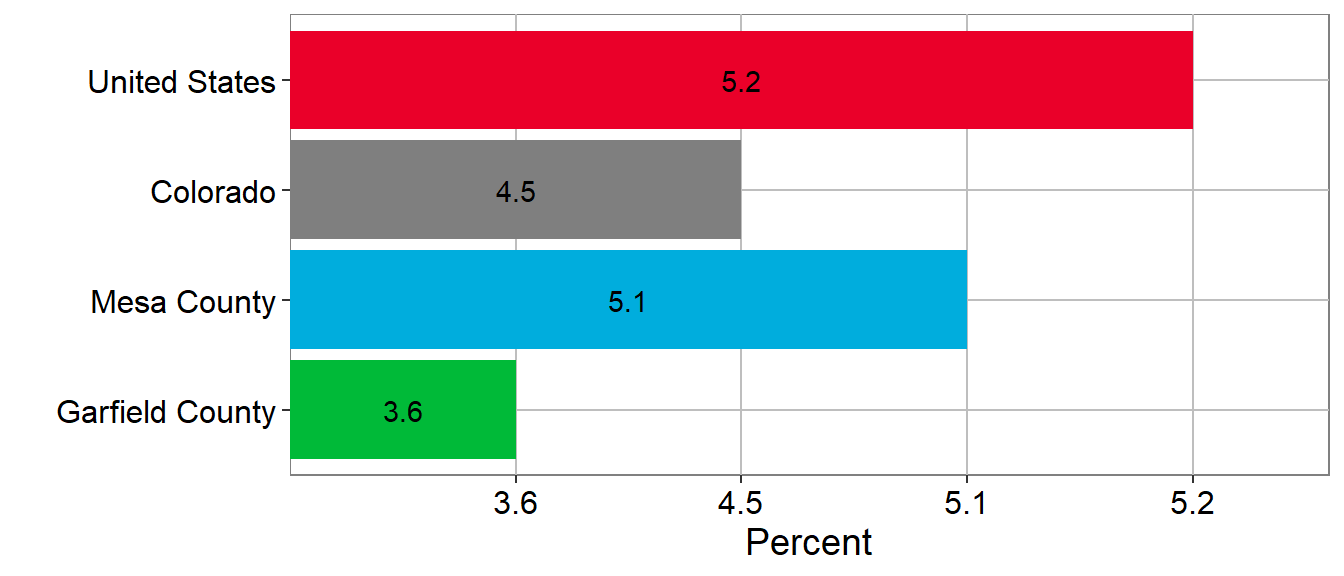
Garfield Work Force, Unemployed Adults 16+
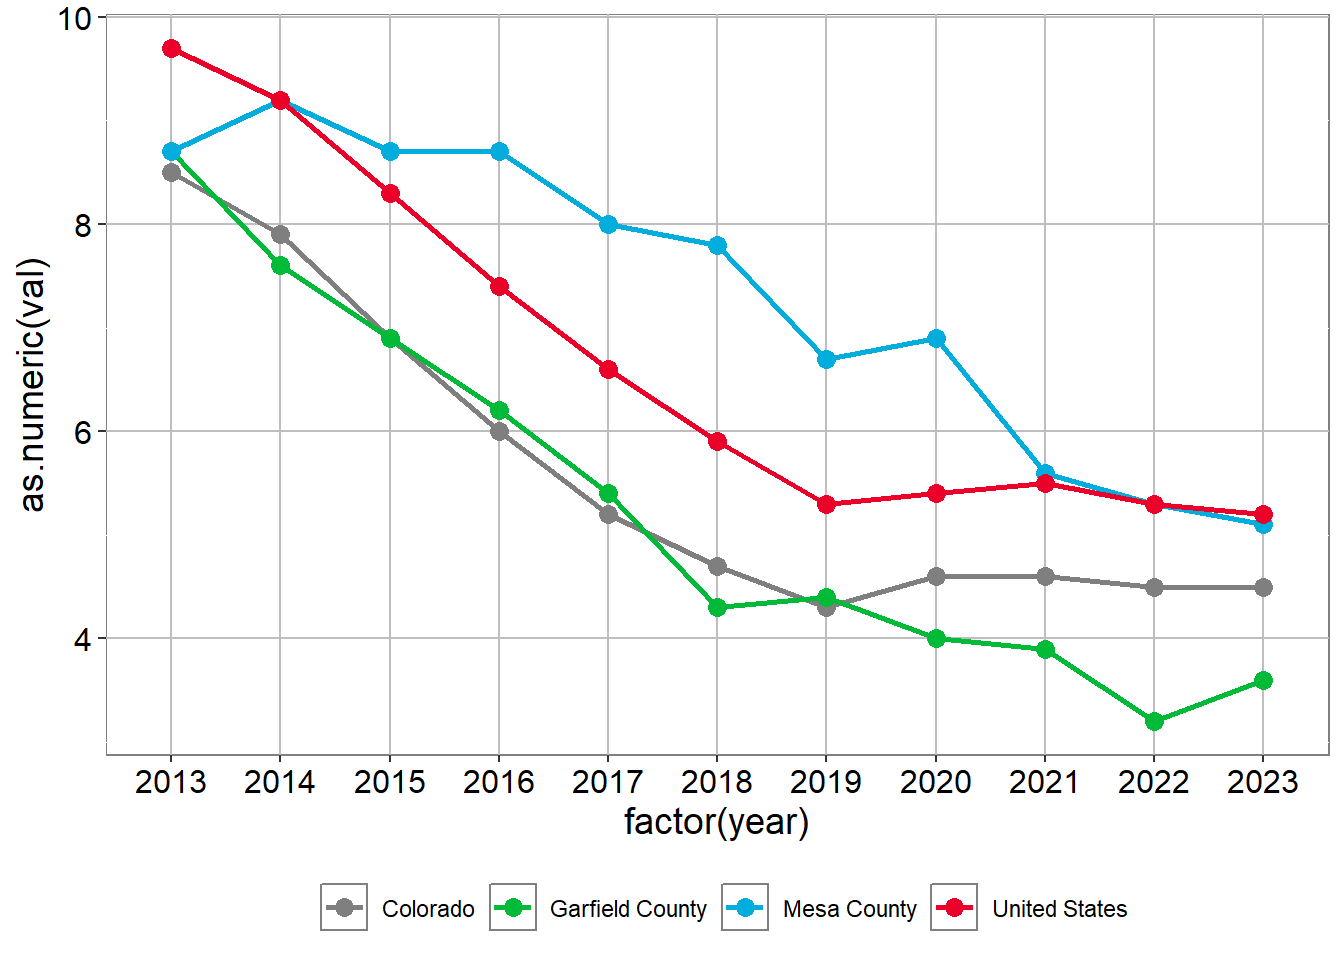
Garfield Work Force, Unemployed Adults 16+
| 2013 | 2014 | 2015 | 2016 | 2017 | 2018 | 2019 | 2020 | 2021 | 2022 | 2023 | |
|---|---|---|---|---|---|---|---|---|---|---|---|
| Colorado | 8.5% | 7.9% | 6.9% | 6% | 5.2% | 4.7% | 4.3% | 4.6% | 4.6% | 4.5% | 4.5% |
| Garfield County | 8.7% | 7.6% | 6.9% | 6.2% | 5.4% | 4.3% | 4.4% | 4% | 3.9% | 3.2% | 3.6% |
| United States | 9.7% | 9.2% | 8.3% | 7.4% | 6.6% | 5.9% | 5.3% | 5.4% | 5.5% | 5.3% | 5.2% |
Source: U.S. Census Bureau, American Community Survey 5-year estimates, Table: S2301; EMPLOYMENT STATUS 2023
Garfield SNAP Usage
Garfield HOUSEHOLD SNAP USAGE (2023)
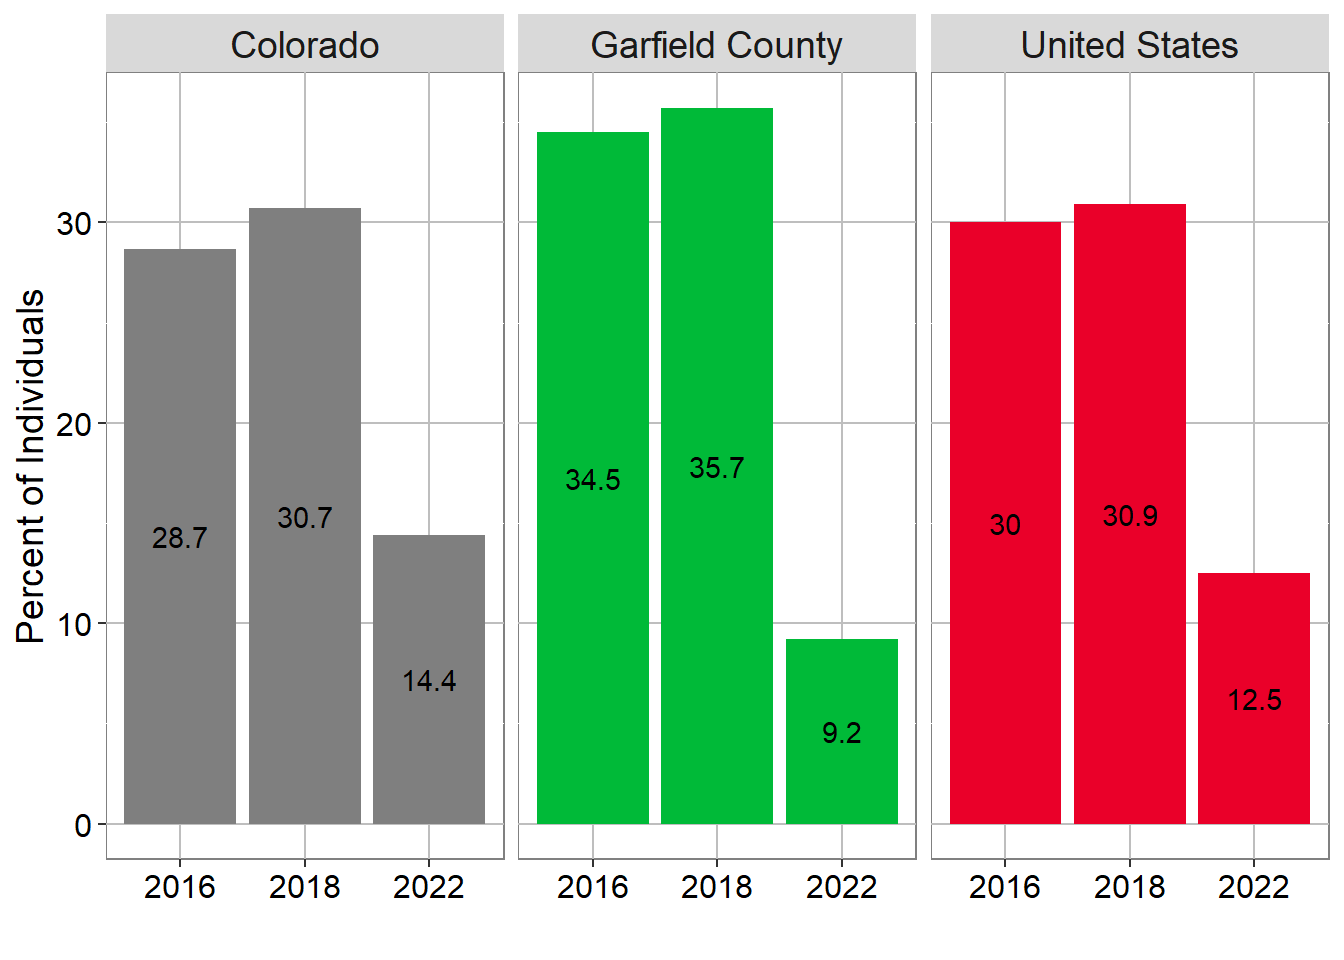
Garfield HOUSEHOLD SNAP USAGE
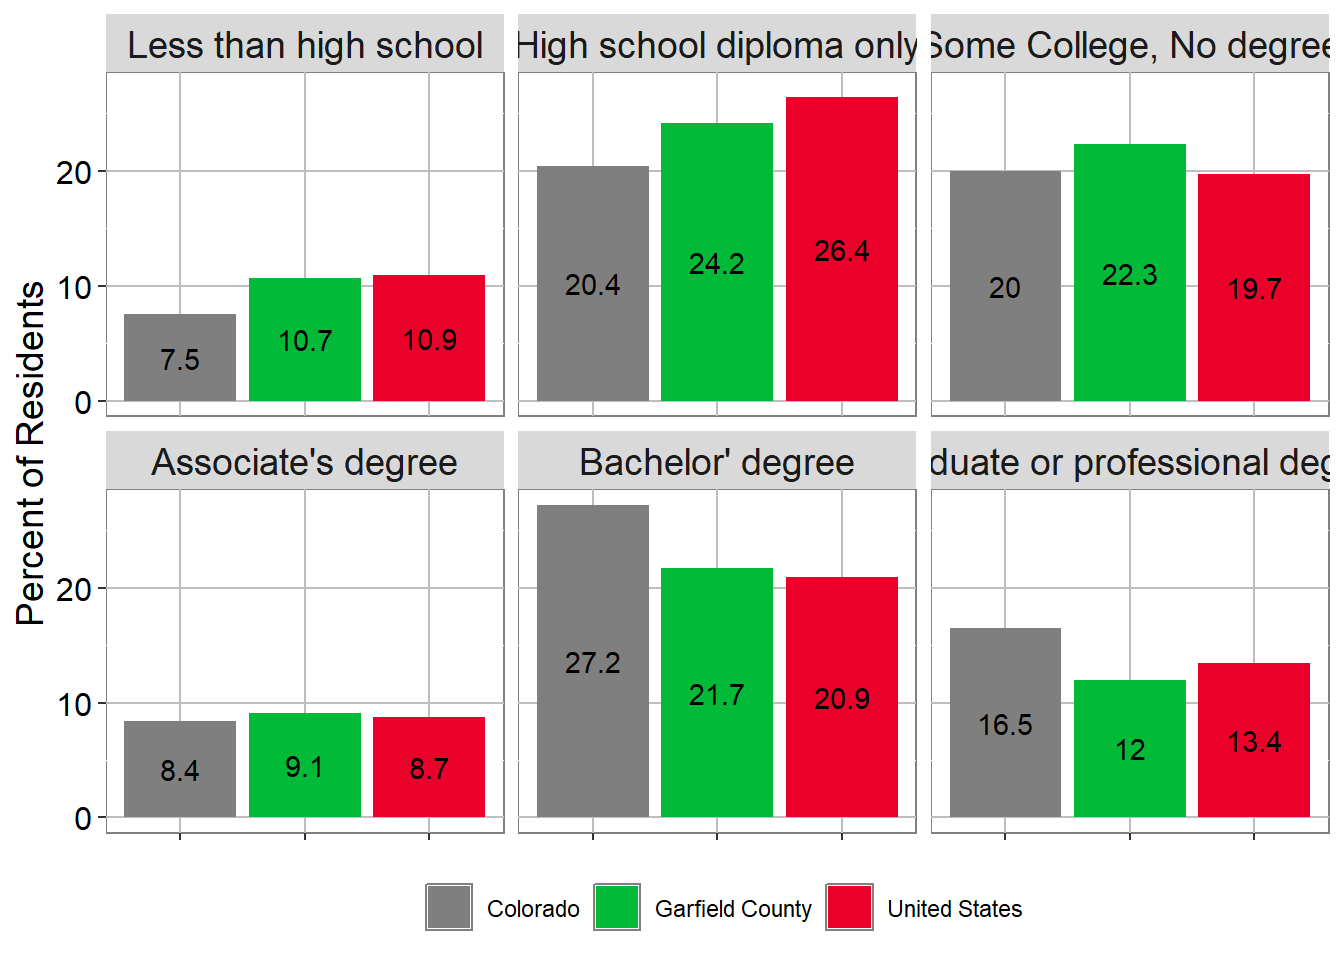
Garfield HOUSEHOLD SNAP USAGE
| Region | 2015 | 2016 | 2017 | 2018 | 2019 | 2020 | 2021 | 2022 | 2023 |
|---|---|---|---|---|---|---|---|---|---|
| Colorado | 8.7% | 8.6% | 8.2% | 8.0% | 7.5% | 7.2% | 7.4% | 7.6% | 8.0% |
| Garfield County | 7.6% | 8.4% | 7.0% | 6.0% | 6.2% | 6.6% | 7.5% | 6.9% | 8.6% |
| Mesa County | 11.3% | 11.7% | 11.3% | 11.5% | 10.8% | 9.7% | 9.6% | 10.1% | 10.6% |
| United States | 13.2% | 13.0% | 12.6% | 12.2% | 11.7% | 11.4% | 11.4% | 11.5% | 11.8% |
Source: U.S. Census Bureau, American Community Survey 5-year estimates, Table: S2201; FOOD STAMPS/SUPPLEMENTAL NUTRITION ASSISTANCE PROGRAM (SNAP) 2023
Garfield Poverty
Garfield Poverty within a Demographic for 2023
| Demographic | Garfield County | Mesa County | Colorado | US |
|---|---|---|---|---|
| All Households | 9.1% | 11.2% | 9.4% | 12.4% |
| Households with married adults with children | 7.6% | 11.9% | 9% | 13.5% |
| Single female households with children | 27.6% | 31.8% | 25.9% | 32.6% |
| Individuals 65 and older | 8.7% | 9.8% | 8% | 10.4% |
| Hispanics of any race | 13% | 19.2% | 13.6% | 16.9% |
Source: U.S. Census Bureau, American Community Survey 5-year estimates, Tables: S1701; POVERTY STATUS IN THE PAST 12 MONTHS, and S1702; POVERTY STATUS IN THE PAST 12 MONTHS OF FAMILIES 2023
Garfield County Total Poverty Percent of Households
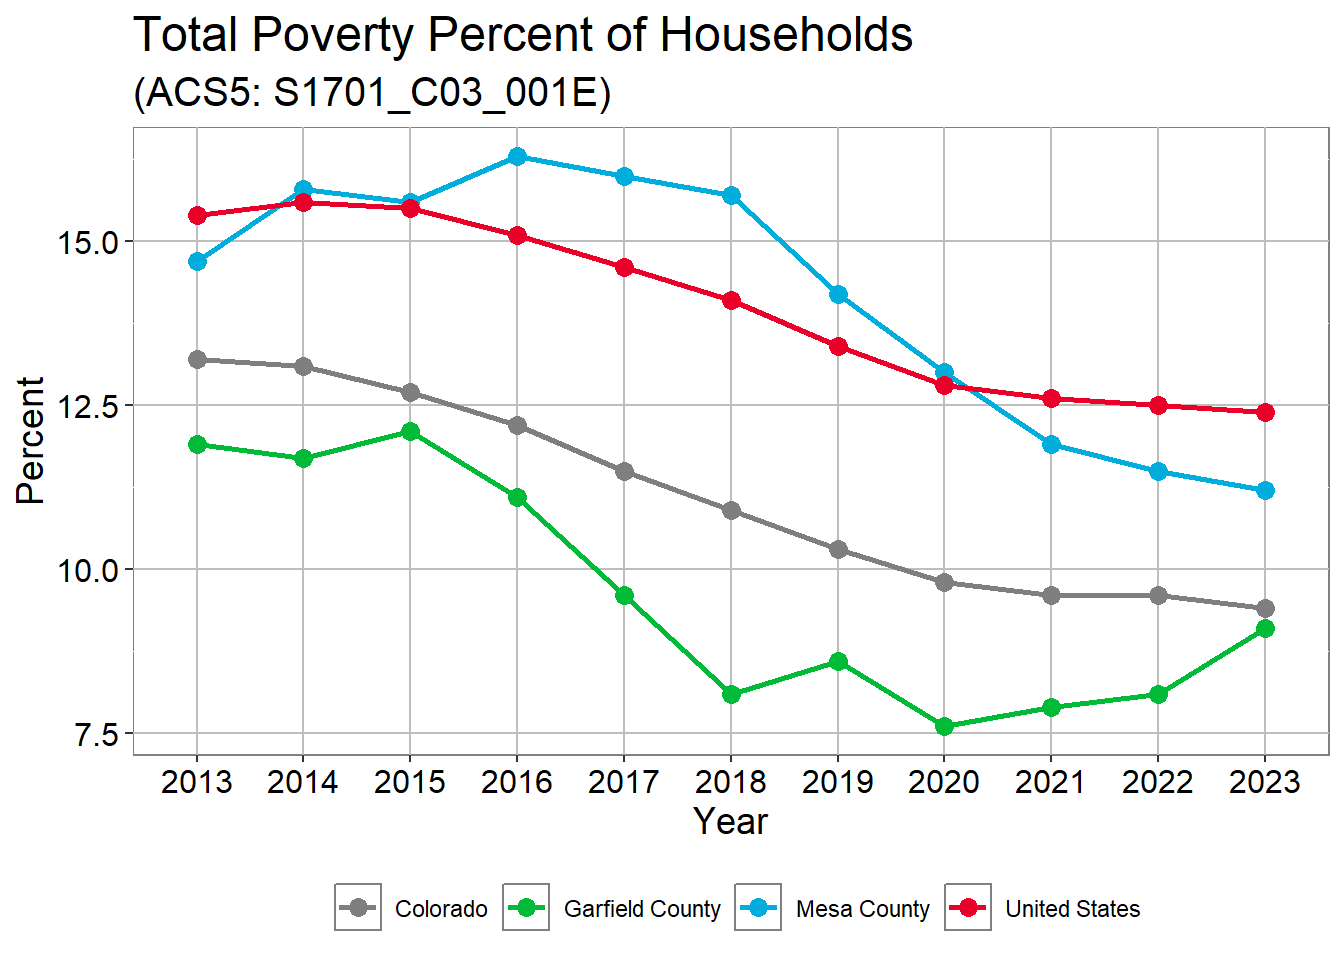
Garfield County Total Poverty Percent of Households
| name | 2013 | 2014 | 2015 | 2016 | 2017 | 2018 | 2019 | 2020 | 2021 | 2022 | 2023 |
|---|---|---|---|---|---|---|---|---|---|---|---|
| Colorado | 13.2% | 13.1% | 12.7% | 12.2% | 11.5% | 10.9% | 10.3% | 9.8% | 9.6% | 9.6% | 9.4% |
| Garfield County | 11.9% | 11.7% | 12.1% | 11.1% | 9.6% | 8.1% | 8.6% | 7.6% | 7.9% | 8.1% | 9.1% |
| Mesa County | 14.7% | 15.8% | 15.6% | 16.3% | 16.0% | 15.7% | 14.2% | 13.0% | 11.9% | 11.5% | 11.2% |
| United States | 15.4% | 15.6% | 15.5% | 15.1% | 14.6% | 14.1% | 13.4% | 12.8% | 12.6% | 12.5% | 12.4% |
Source: U.S. Census Bureau, American Community Survey 5-year estimates, Table: S1701; POVERTY STATUS IN THE PAST 12 MONTHS 2023
Garfield Housing
Garfield Percent Renter-occupied housing
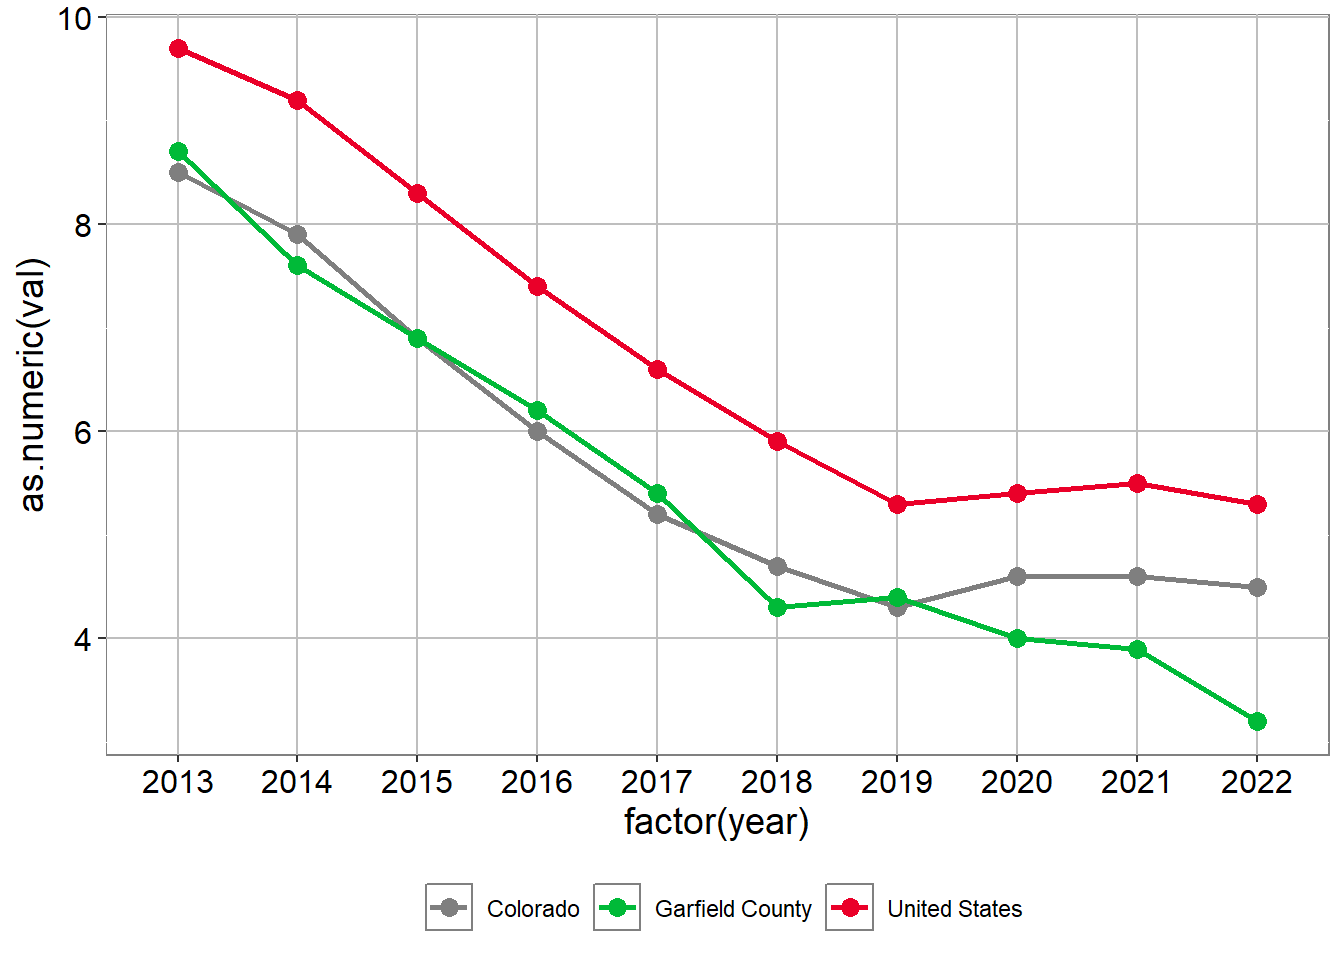
Garfield Percent Renter-occupied housing
| Region | 2014 | 2015 | 2016 | 2017 | 2018 | 2019 | 2020 | 2021 | 2022 | 2023 |
|---|---|---|---|---|---|---|---|---|---|---|
| Colorado | 35.2% | 35.7% | 35.6% | 35.3% | 35.1% | 34.8% | 33.8% | 33.9% | 33.8% | 33.7% |
| Garfield County | 34.6% | 35.4% | 34.1% | 33.9% | 33.1% | 33.1% | 32.5% | 31.3% | 30.1% | 30.3% |
| Mesa County | 30.3% | 30.9% | 32.0% | 33.0% | 32.8% | 31.8% | 30.9% | 29.6% | 28.2% | 28.1% |
| United States | 35.6% | 36.1% | 36.4% | 36.2% | 36.2% | 36.0% | 35.6% | 35.4% | 35.2% | 35.0% |
Source: U.S. Census Bureau, American Community Survey 5-year estimates, Table: DP04; SELECTED HOUSING CHARACTERISTICS 2023
Garfield Housing Burden: Percent of households where housing cost exceed 30% of income in 2023
| County | Total | Renters | Owners |
|---|---|---|---|
| Garfield County | 35.5% | 50.6 ( 3,455 ) | 29.1% ( 4,680 ) |
| Mesa County | 31.6% | 49.1 ( 8,347 ) | 25.2% ( 11,696 ) |
Source: U.S. Census Bureau, American Community Survey 5-year estimates, Table: DP04; SELECTED HOUSING CHARACTERISTICS 2023
Pitkin County
2023 Summary
Hispanic/Latino population: 11.1%
Median Age: 47.3
Educational Attainment
- High School Diploma: 97.0%
- Bachelor’s Degree or higher, age 25+: 64.0%
Median Household Income: $100,318
Employment Status:
- Percent of those 16+ in labor force: 69.3%
- Unemployment rate: 1.5%
SNAP Usage: 1.5%
Pitkin Population Growth
Population Growth 2014 to 2023
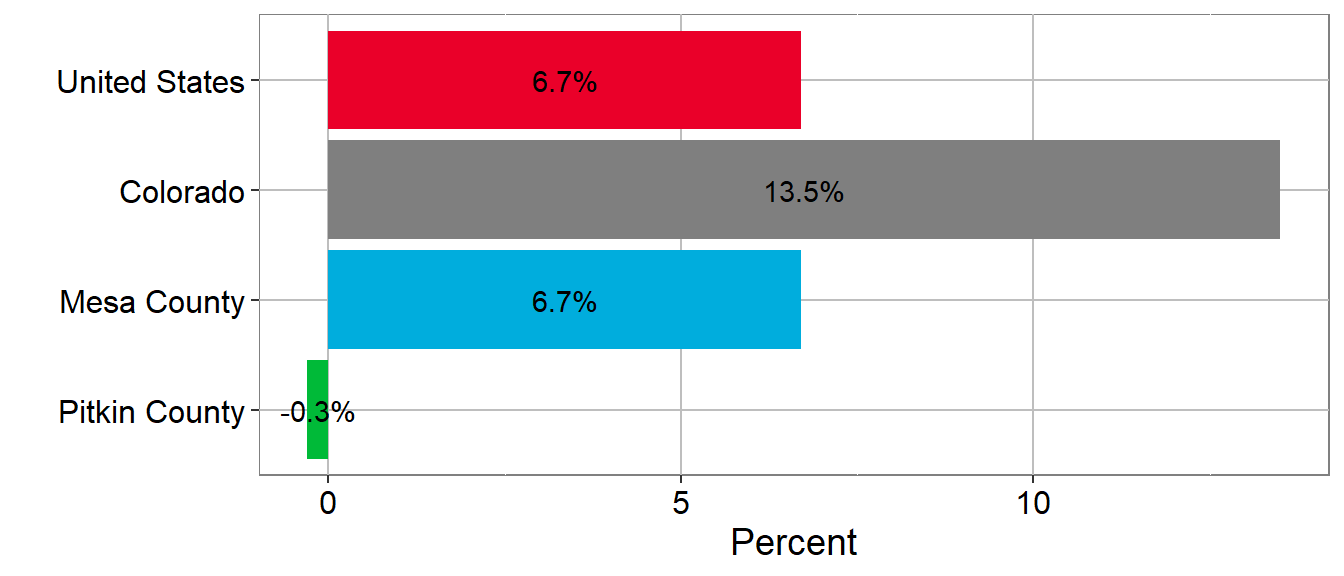
Population Growth 2014 to 2023
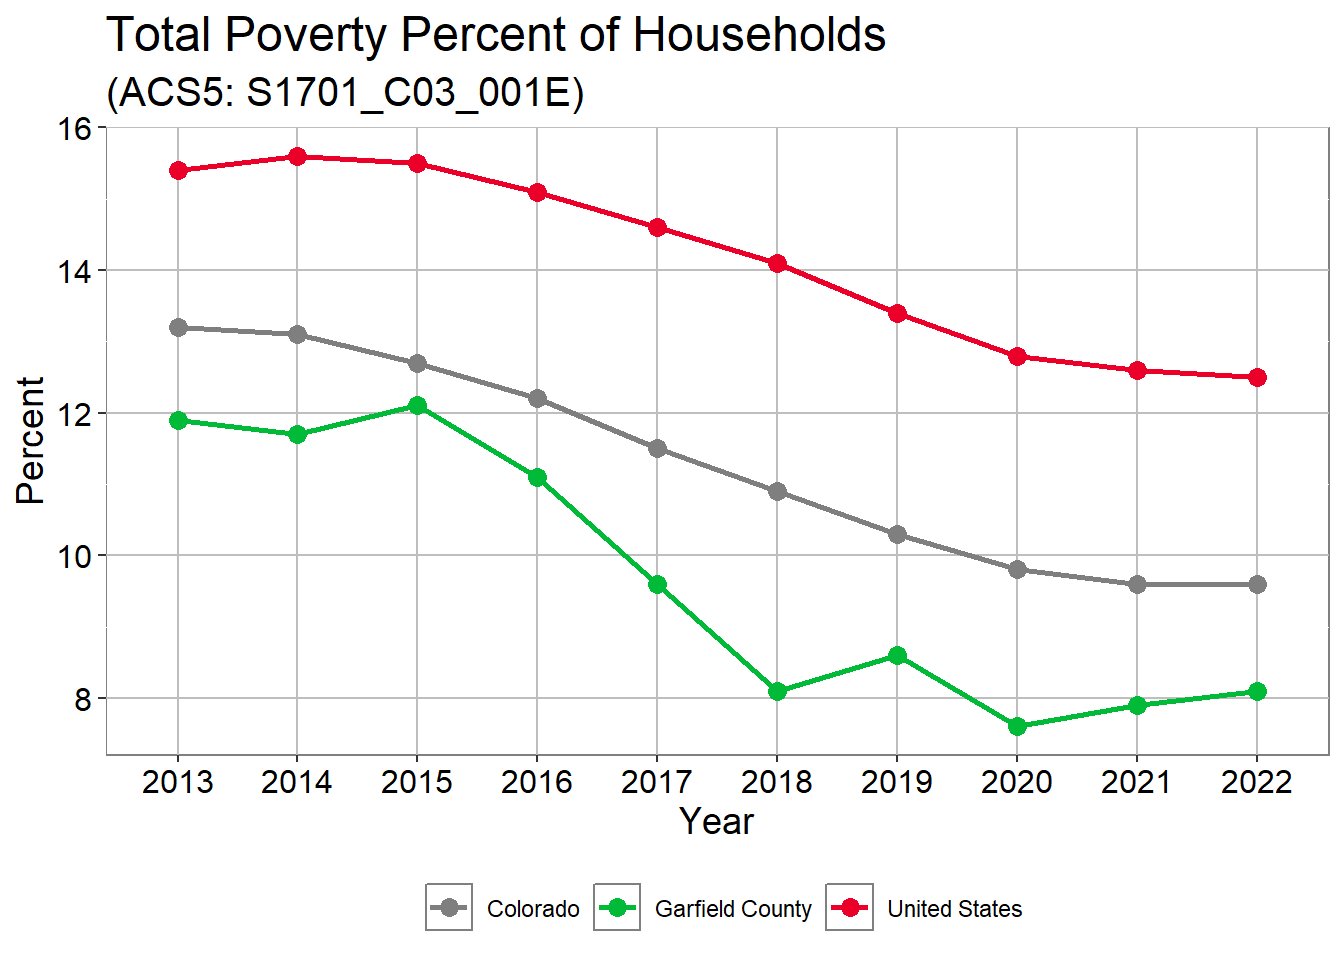
Population Growth 2014 to 2023
| Region | 2013 | 2014 | 2015 | 2016 | 2017 | 2018 | 2019 | 2020 | 2021 | 2022 | 2023 |
|---|---|---|---|---|---|---|---|---|---|---|---|
| Colorado | 0.0% | 1.5% | 3.1% | 4.7% | 6.2% | 8.0% | 9.6% | 11.0% | 11.8% | 12.7% | 13.5% |
| Mesa County | 0.0% | 0.1% | 0.3% | 0.5% | 0.9% | 1.7% | 2.6% | 3.8% | 4.9% | 5.9% | 6.7% |
| Pitkin County | 0.0% | 0.8% | 1.4% | 2.2% | 3.3% | 4.3% | 4.4% | 4.7% | 1.7% | 0.9% | -0.3% |
| United States | 0.0% | 0.8% | 1.6% | 2.3% | 3.0% | 3.6% | 4.2% | 4.8% | 5.8% | 6.3% | 6.7% |
Source: U.S. Census Bureau, American Community Survey 5-year estimates, Table: B01003; TOTAL POPULATION 2023
Pitkin Median Age
Median Age 2023
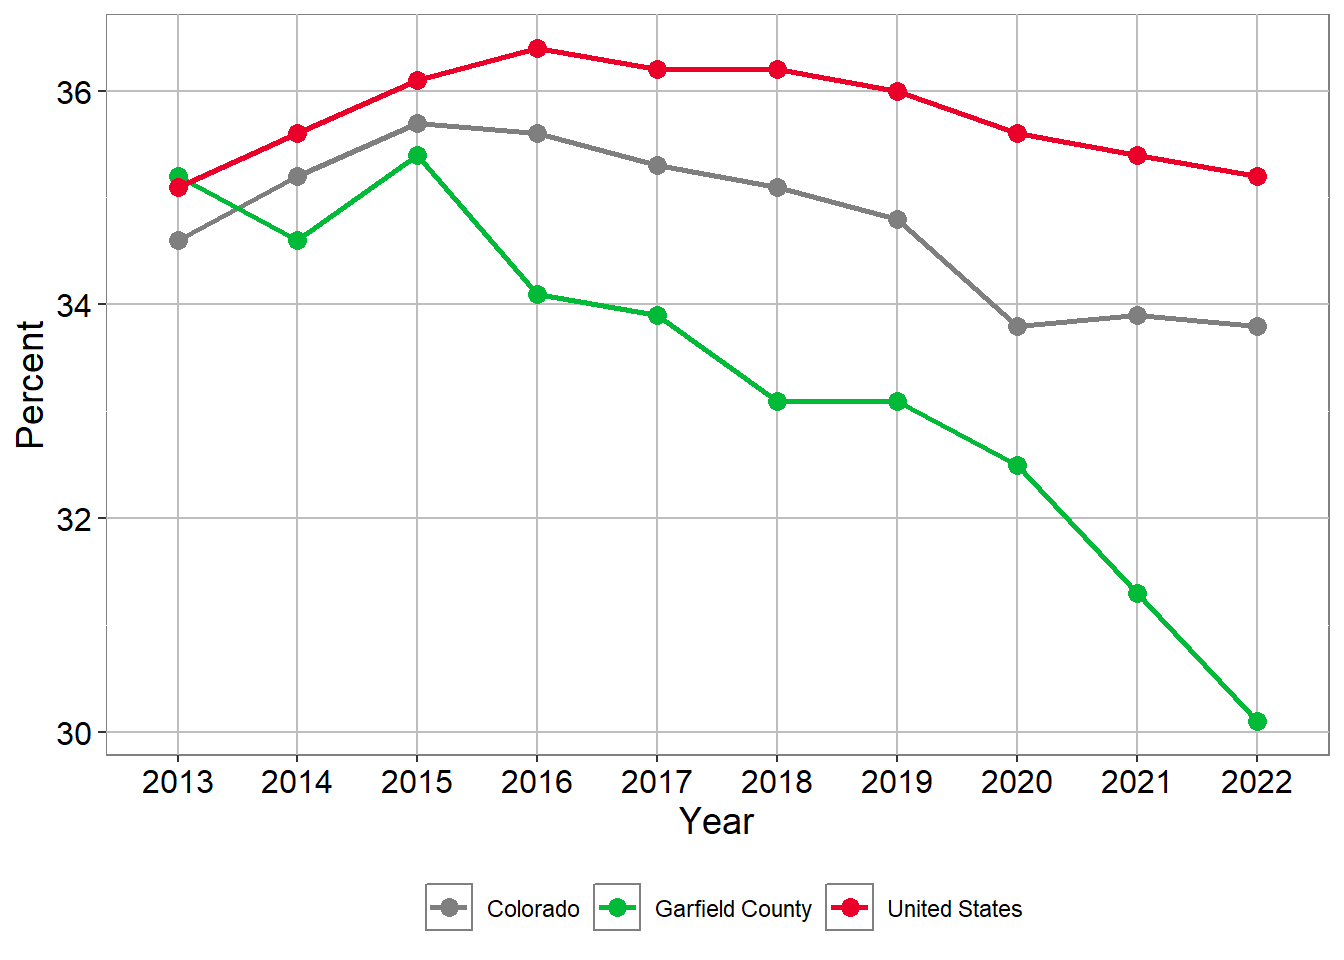
Median Age
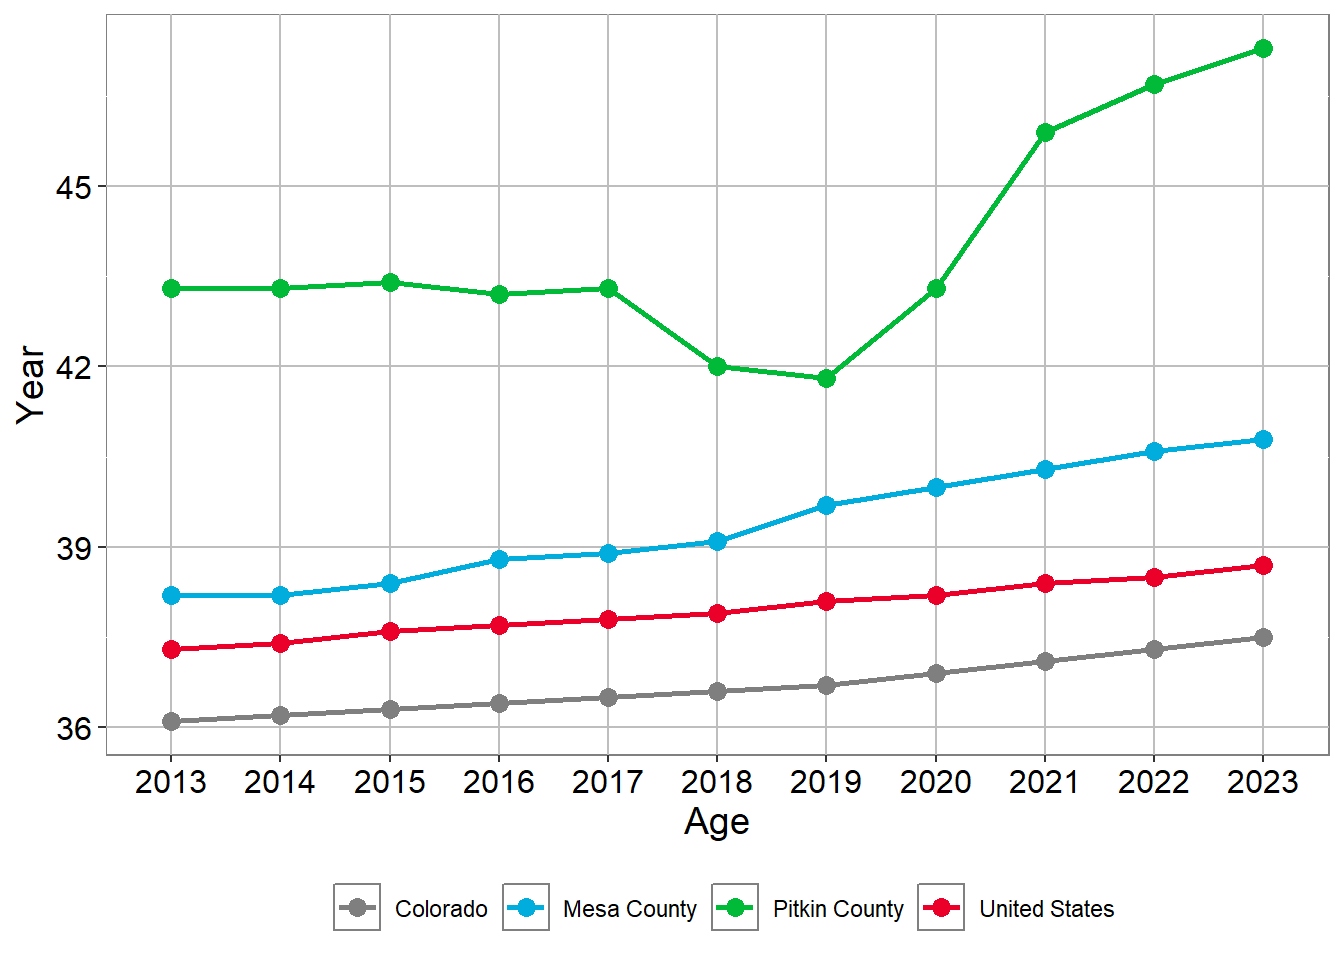
Median Age
| Region | 2013 | 2014 | 2015 | 2016 | 2017 | 2018 | 2019 | 2020 | 2021 | 2022 | 2023 |
|---|---|---|---|---|---|---|---|---|---|---|---|
| Colorado | 36.1 | 36.2 | 36.3 | 36.4 | 36.5 | 36.6 | 36.7 | 36.9 | 37.1 | 37.3 | 37.5 |
| Mesa County | 38.2 | 38.2 | 38.4 | 38.8 | 38.9 | 39.1 | 39.7 | 40.0 | 40.3 | 40.6 | 40.8 |
| Pitkin County | 43.3 | 43.3 | 43.4 | 43.2 | 43.3 | 42.0 | 41.8 | 43.3 | 45.9 | 46.7 | 47.3 |
| United States | 37.3 | 37.4 | 37.6 | 37.7 | 37.8 | 37.9 | 38.1 | 38.2 | 38.4 | 38.5 | 38.7 |
Source: U.S. Census Bureau, American Community Survey 5-year estimates, Table: 01002; MEDIAN AGE BY SEX 2023
Pitkin Race
Residents with Race other than White Alone (people of color) in 2023
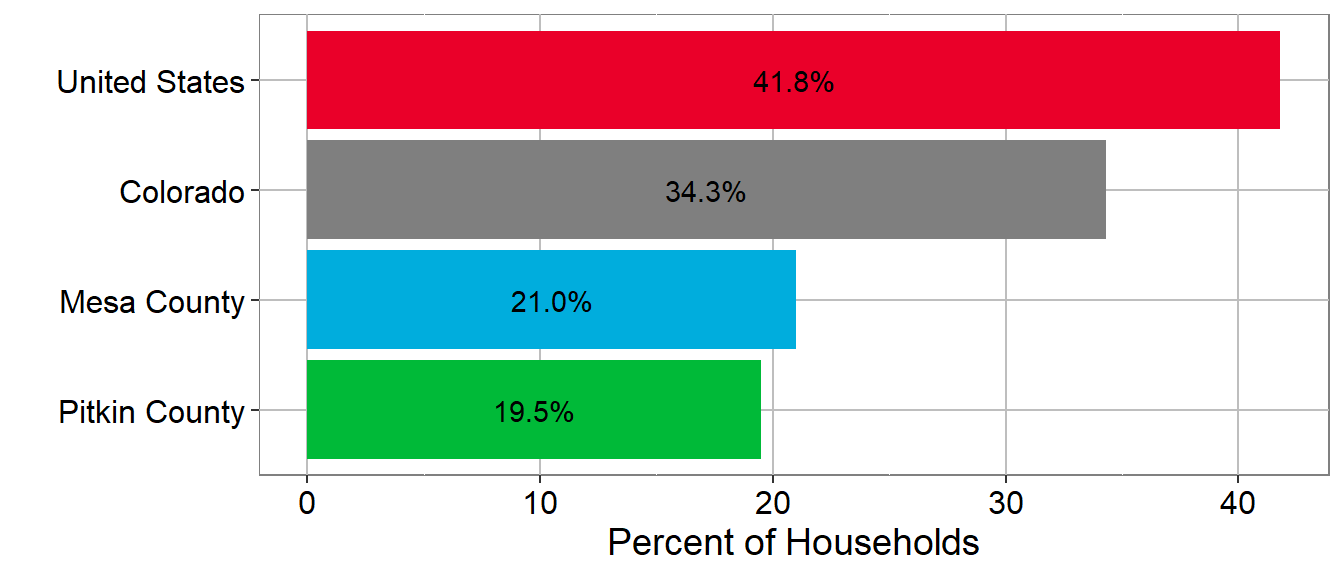
Residents with Race other than White Alone (people of color)
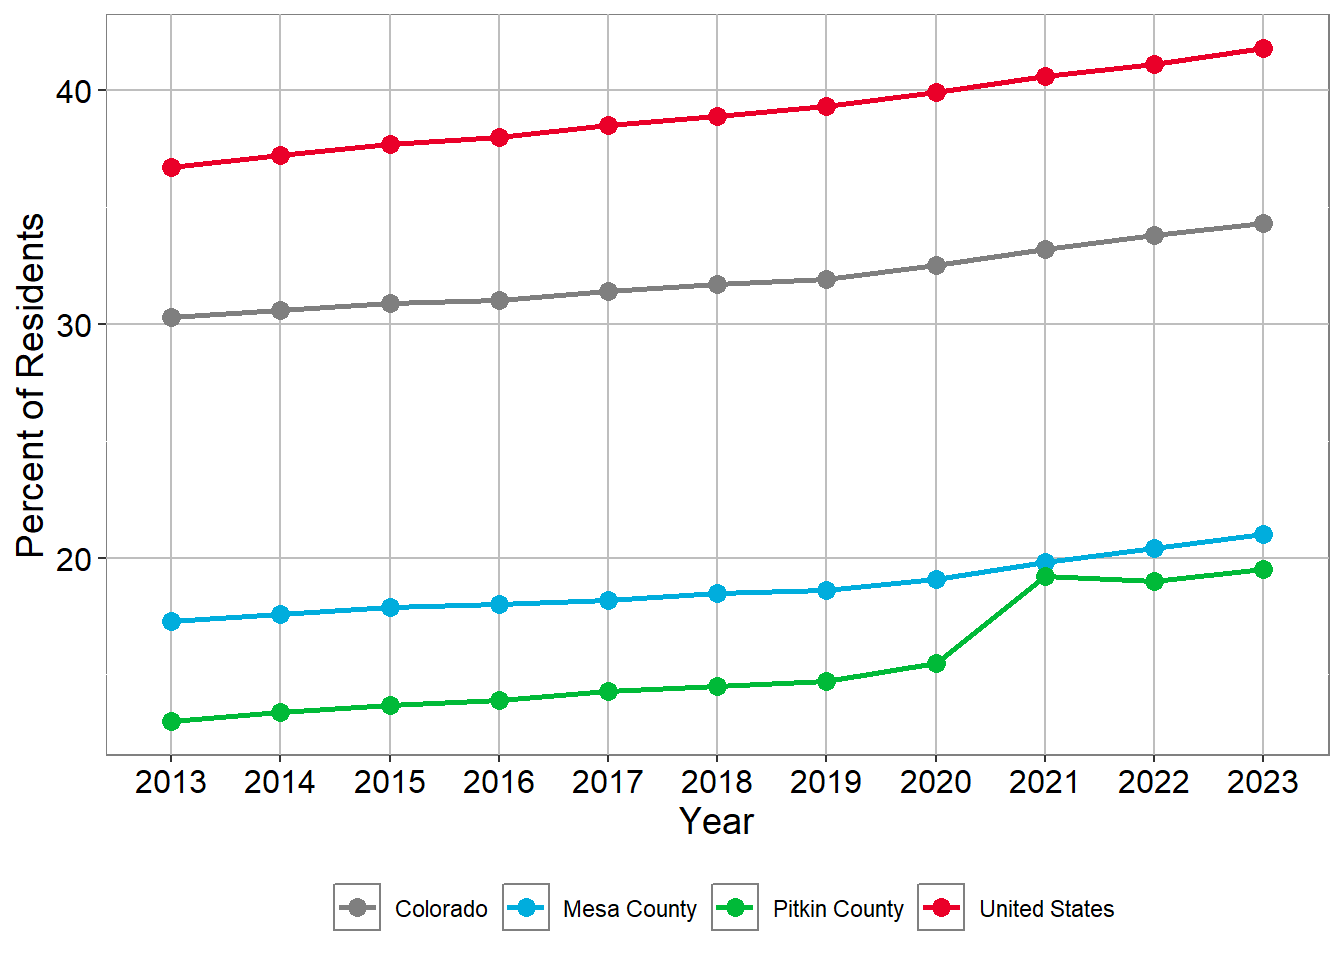
Residents with Race other than White Alone (people of color)
| Region | 2013 | 2014 | 2015 | 2016 | 2017 | 2018 | 2019 | 2020 | 2021 | 2022 | 2023 |
|---|---|---|---|---|---|---|---|---|---|---|---|
| Colorado | 30.3 | 30.6 | 30.9 | 31.0 | 31.4 | 31.7 | 31.9 | 32.5 | 33.2 | 33.8 | 34.3 |
| Mesa County | 17.3 | 17.6 | 17.9 | 18.0 | 18.2 | 18.5 | 18.6 | 19.1 | 19.8 | 20.4 | 21.0 |
| Pitkin County | 13.0 | 13.4 | 13.7 | 13.9 | 14.3 | 14.5 | 14.7 | 15.5 | 19.2 | 19.0 | 19.5 |
| United States | 36.7 | 37.2 | 37.7 | 38.0 | 38.5 | 38.9 | 39.3 | 39.9 | 40.6 | 41.1 | 41.8 |
Source: U.S. Census Bureau, American Community Survey 5-year estimates, Tables: B01001H; SEX BY AGE (WHITE ALONE, NOT HISPANIC OR LATINO), and B01003; TOTAL POPULATION 2023
Pitkin Hispanic Population
Residents age 5+ Speaking Spanish at Home in 2023
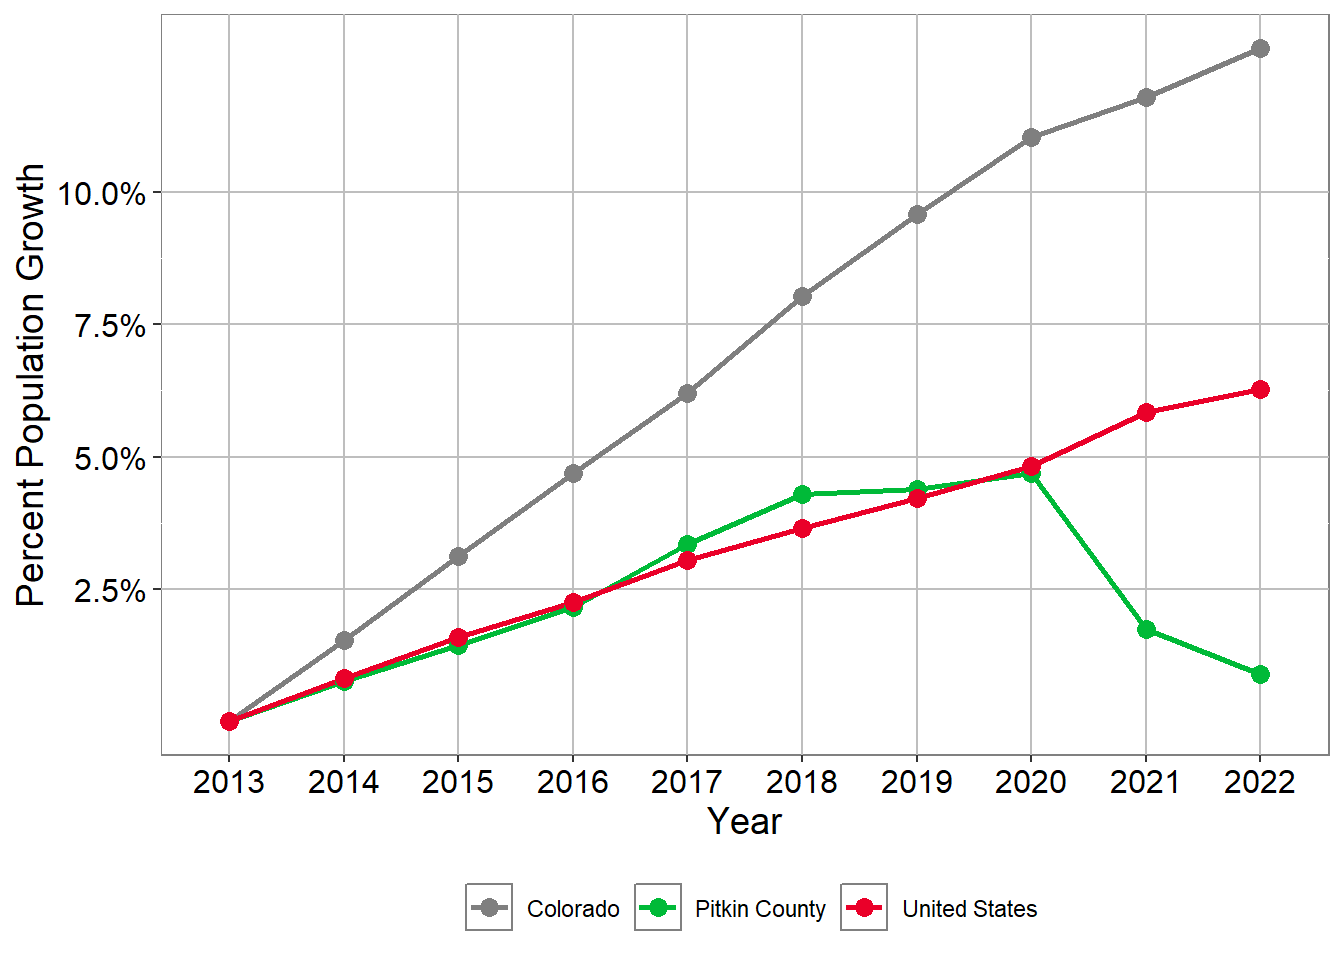
Residents age 5+ Speaking Spanish at Home
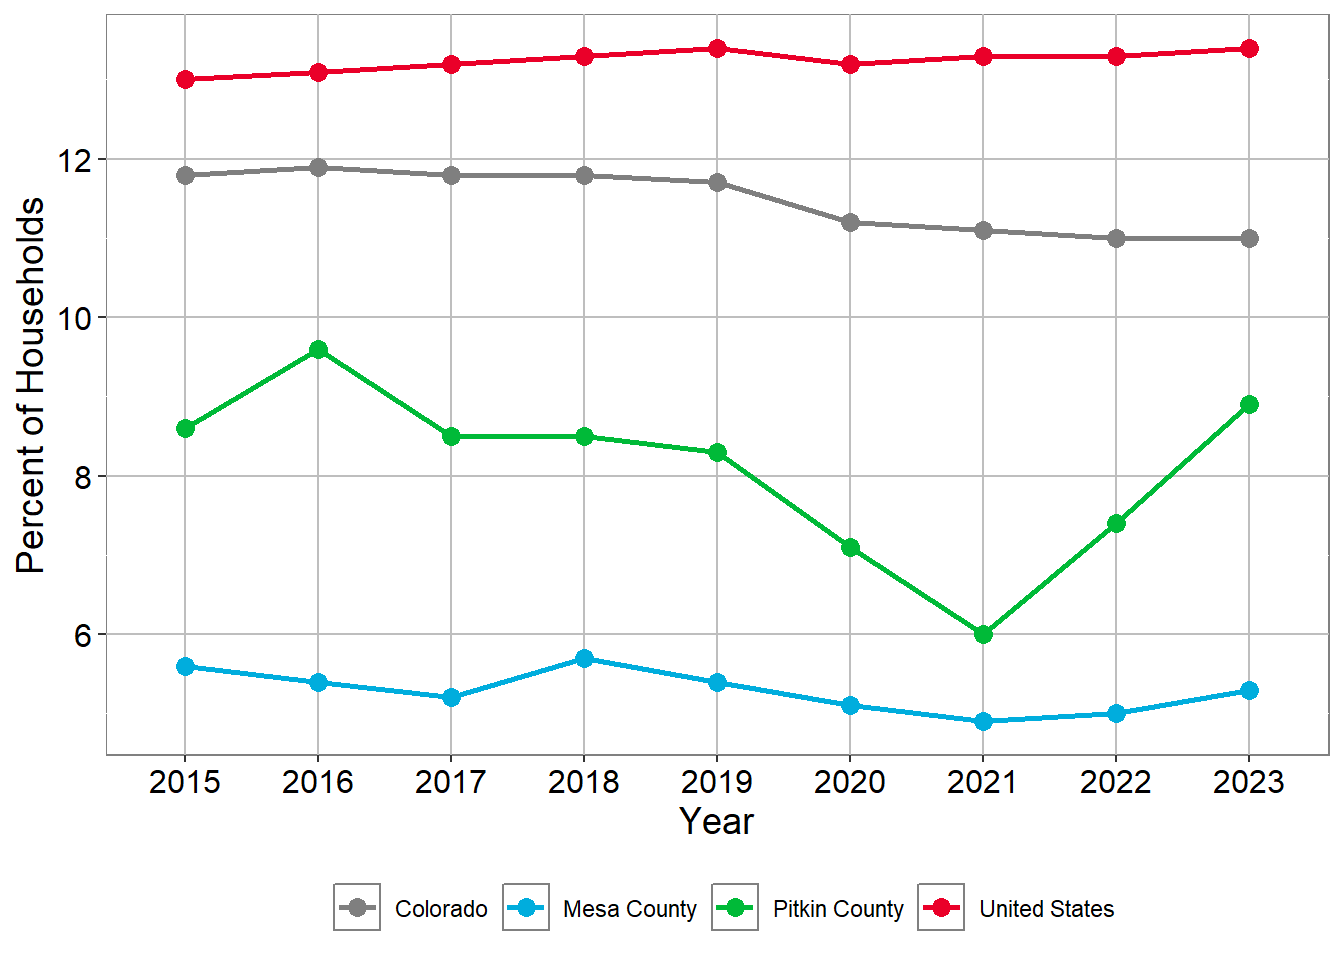
Residents age 5+ Speaking Spanish at Home
| Region | 2015 | 2016 | 2017 | 2018 | 2019 | 2020 | 2021 | 2022 | 2023 |
|---|---|---|---|---|---|---|---|---|---|
| Colorado | 11.8% | 11.9% | 11.8% | 11.8% | 11.7% | 11.2% | 11.1% | 11.0% | 11.0% |
| Mesa County | 5.6% | 5.4% | 5.2% | 5.7% | 5.4% | 5.1% | 4.9% | 5.0% | 5.3% |
| Pitkin County | 8.6% | 9.6% | 8.5% | 8.5% | 8.3% | 7.1% | 6.0% | 7.4% | 8.9% |
| United States | 13.0% | 13.1% | 13.2% | 13.3% | 13.4% | 13.2% | 13.3% | 13.3% | 13.4% |
Source: U.S. Census Bureau, American Community Survey 5-year estimates, Tables: S1101; HOUSEHOLDS AND FAMILIES, and S1601; LANGUAGE SPOKEN AT HOME 2023
Residents who are Hispanic or Latino in 2023
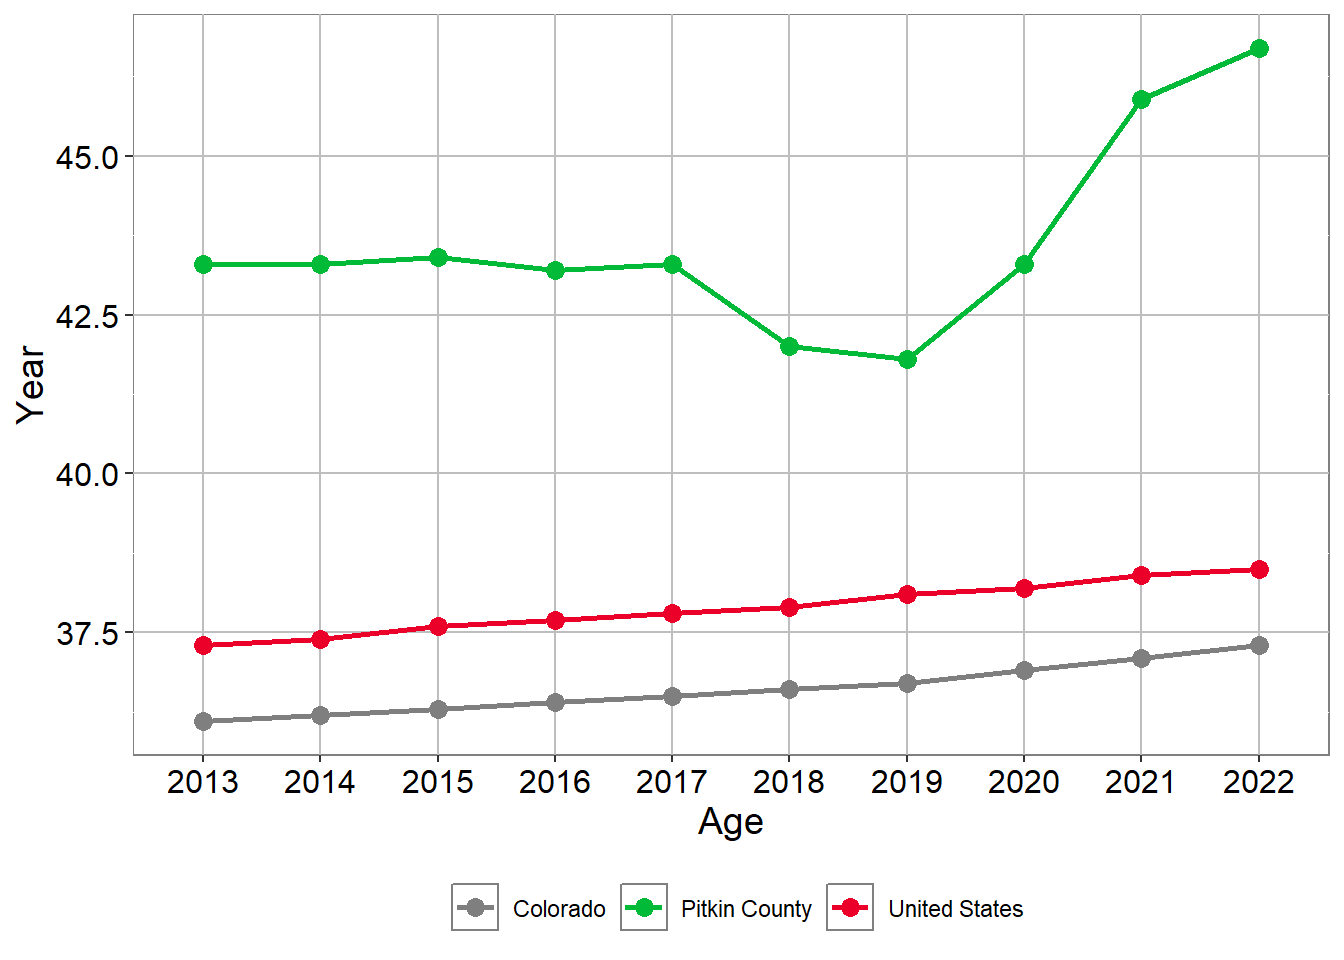
Residents who are Hispanic or Latino
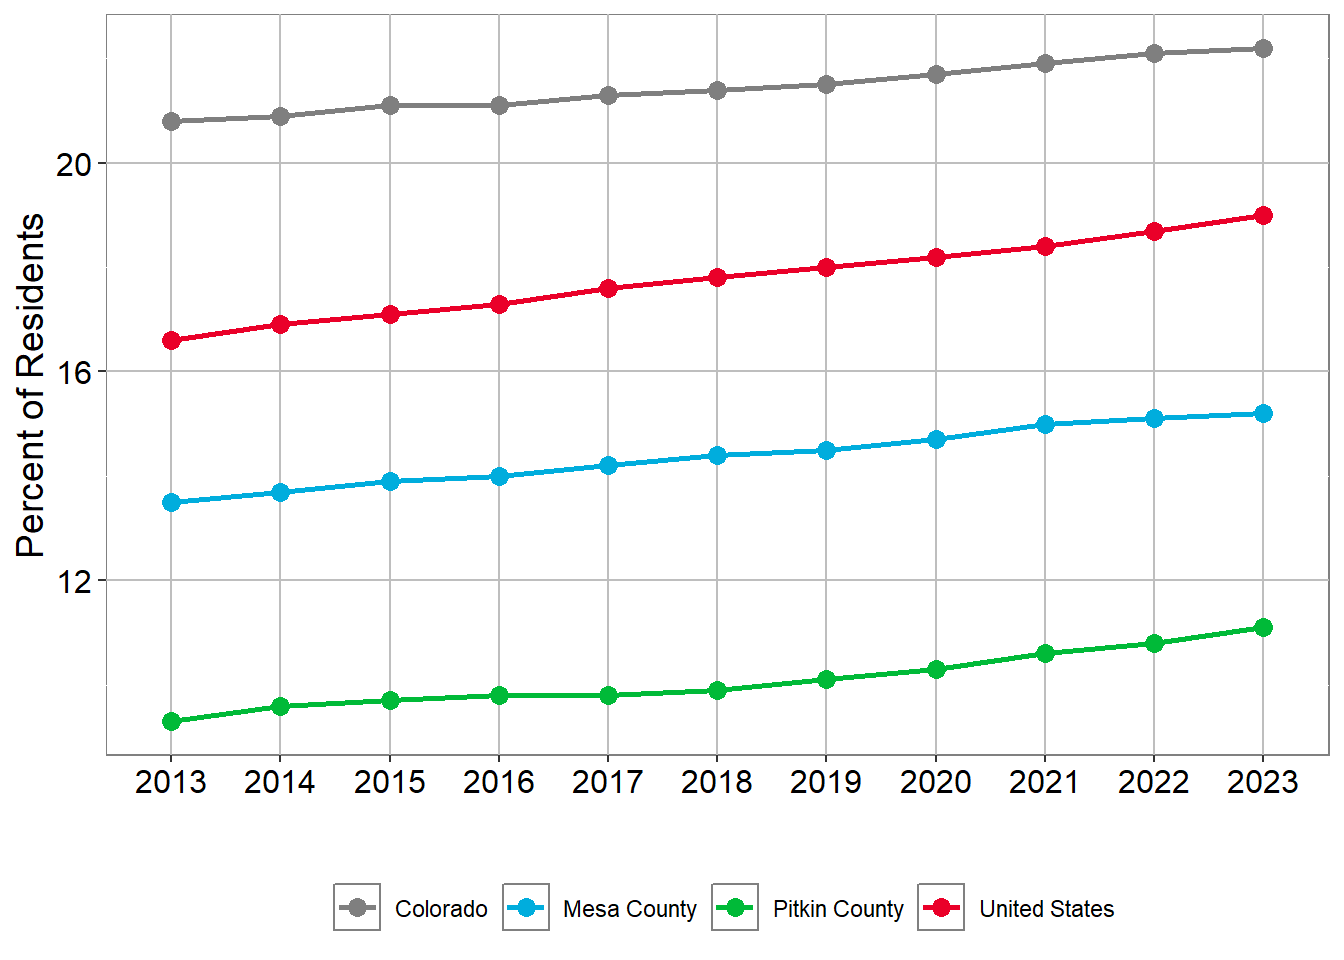
Residents who are Hispanic or Latino
| Region | 2013 | 2014 | 2015 | 2016 | 2017 | 2018 | 2019 | 2020 | 2021 | 2022 | 2023 |
|---|---|---|---|---|---|---|---|---|---|---|---|
| Colorado | 20.8% | 20.9% | 21.1% | 21.1% | 21.3% | 21.4% | 21.5% | 21.7% | 21.9% | 22.1% | 22.2% |
| Mesa County | 13.5% | 13.7% | 13.9% | 14.0% | 14.2% | 14.4% | 14.5% | 14.7% | 15.0% | 15.1% | 15.2% |
| Pitkin County | 9.3% | 9.6% | 9.7% | 9.8% | 9.8% | 9.9% | 10.1% | 10.3% | 10.6% | 10.8% | 11.1% |
| United States | 16.6% | 16.9% | 17.1% | 17.3% | 17.6% | 17.8% | 18.0% | 18.2% | 18.4% | 18.7% | 19.0% |
Source: U.S. Census Bureau, American Community Survey 5-year estimates, Table: B03003; HISPANIC OR LATINO ORIGIN 2023
Pitkin Educational Attainment
Percent of people age 18 to 24 that are Highschool Graduate’s
| 2017 | 2020 | 2023 | |
|---|---|---|---|
| Pitkin County | 23% | 33.9% | 18.2% |
| Mesa County | 27.2% | 29.9% | 33.2% |
| Colorado | 29.5% | 31.5% | 33.8% |
| United States | 30.5% | 31.4% | 34.6% |
Source: U.S. Census Bureau, American Community Survey 5-year estimates, Table: S1501; EDUCATIONAL ATTAINMENT 2023
Percent of people age 18 to 24 that are Bachelor’s Degree’s
| 2017 | 2020 | 2023 | |
|---|---|---|---|
| Pitkin County | 22.5% | 14.9% | 24.9% |
| Mesa County | 4.5% | 7.8% | 7.9% |
| Colorado | 11.5% | 13.2% | 14.3% |
| United States | 10.5% | 11.8% | 12.9% |
Source: U.S. Census Bureau, American Community Survey 5-year estimates, Table: S1501; EDUCATIONAL ATTAINMENT 2023
Percent of people age 25+ that have Bachelor’s Degree’s or higher
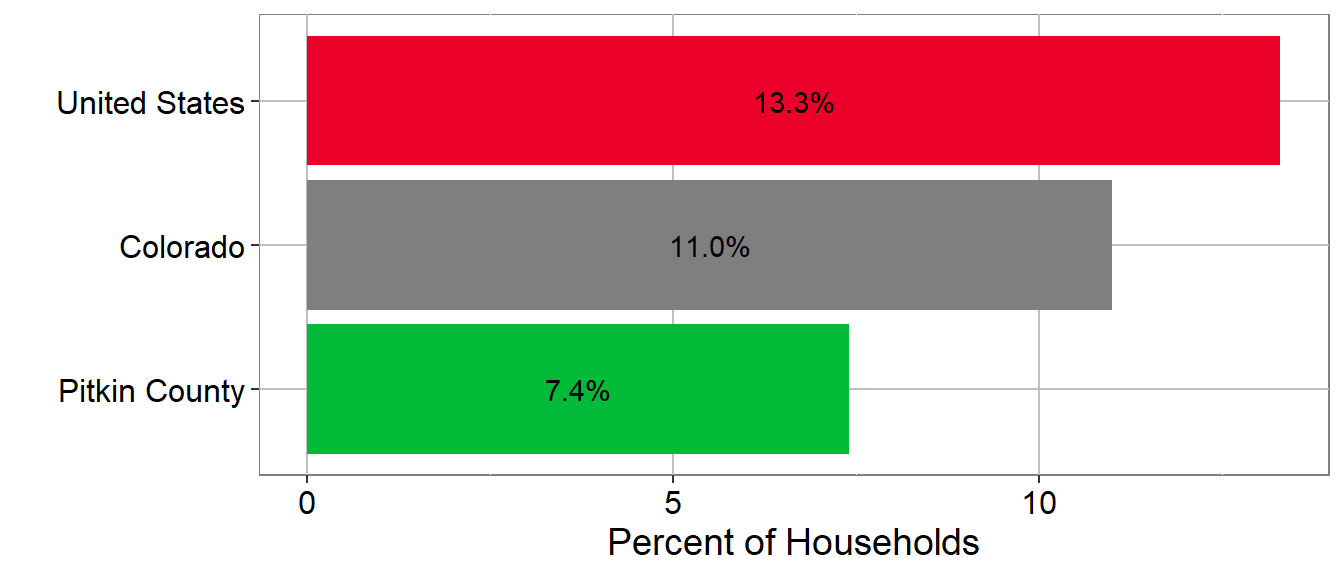
Source: U.S. Census Bureau, American Community Survey 5-year estimates, Table: S1501; EDUCATIONAL ATTAINMENT 2023
Over all Educational Attainment age 25+
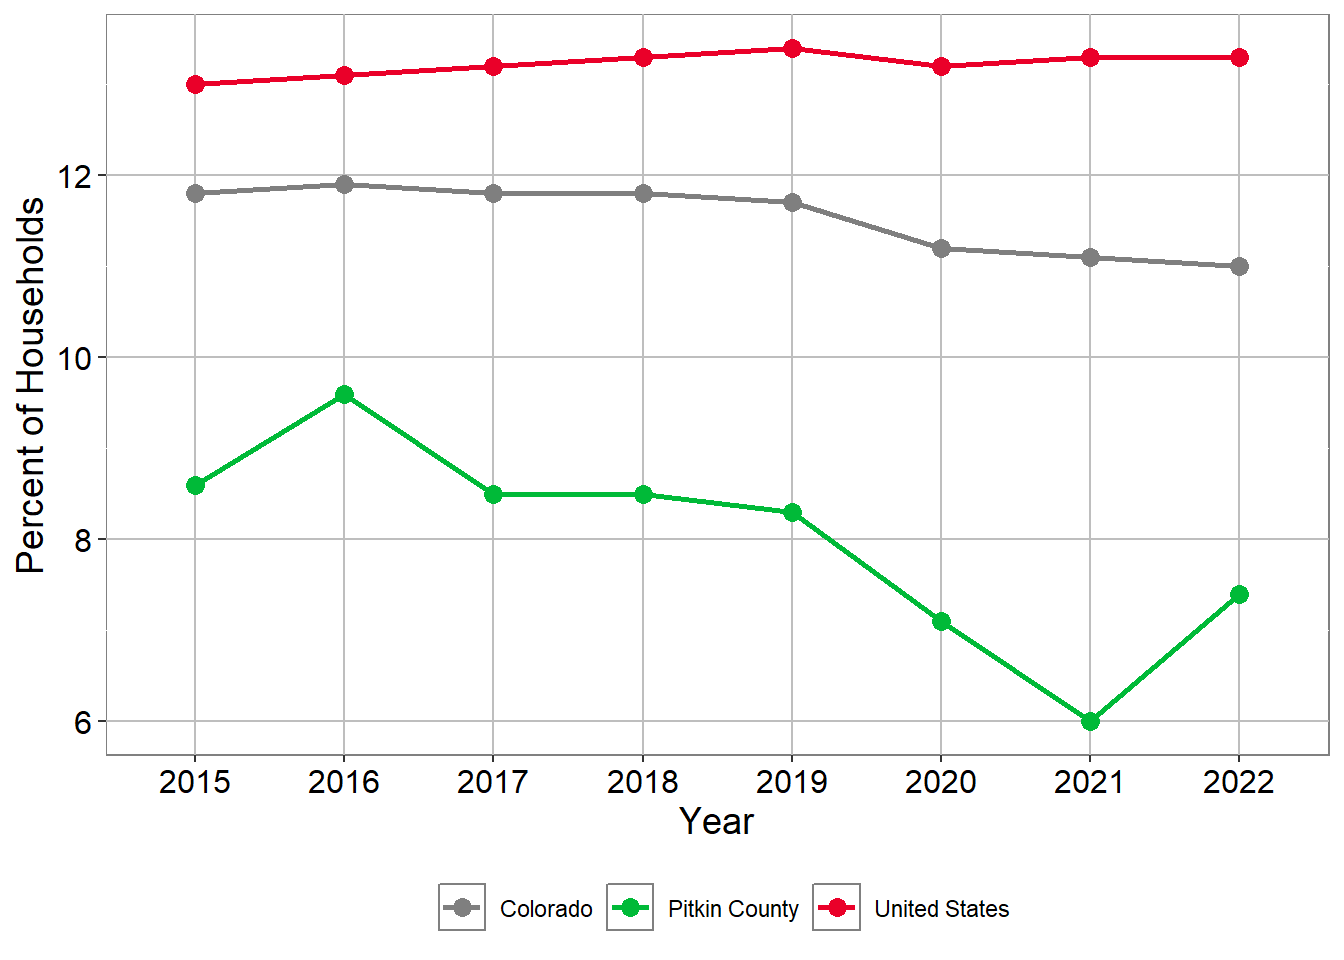
Source: U.S. Census Bureau, American Community Survey 5-year estimates, Table: B15003; EDUCATIONAL ATTAINMENT FOR THE POPULATION 25 YEARS AND OVER 2023
Pitkin Economic Characteristics
Pitkin Median Income
Pitkin Median Household Income
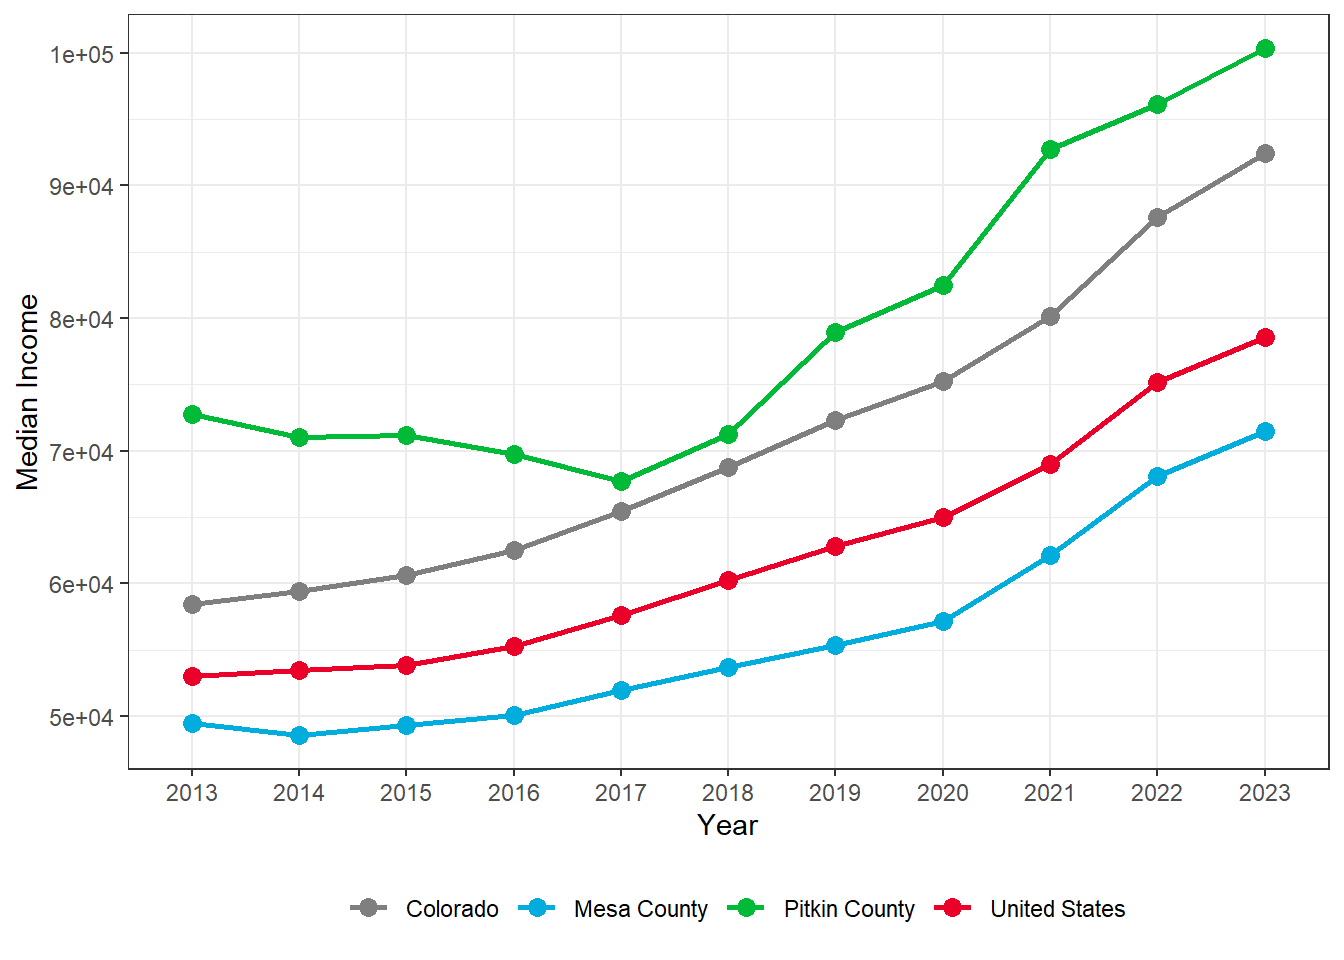
Pitkin Median Household Income
| Region | 2013 | 2014 | 2015 | 2016 | 2017 | 2018 | 2019 | 2020 | 2021 | 2022 | 2023 |
|---|---|---|---|---|---|---|---|---|---|---|---|
| Colorado | 58,433 | 59,448 | 60,629 | 62,520 | 65,458 | 68,811 | 72,331 | 75,231 | 80,184 | 87,598 | 92,470 |
| Mesa County | 49,471 | 48,610 | 49,322 | 50,070 | 51,971 | 53,683 | 55,379 | 57,157 | 62,127 | 68,077 | 71,485 |
| Pitkin County | 72,745 | 71,060 | 71,196 | 69,789 | 67,755 | 71,244 | 78,935 | 82,455 | 92,708 | 96,123 | 100,318 |
| United States | 53,046 | 53,482 | 53,889 | 55,322 | 57,652 | 60,293 | 62,843 | 64,994 | 69,021 | 75,149 | 78,538 |
Source: U.S. Census Bureau, American Community Survey 5-year estimates, Table: S1901; INCOME IN THE PAST 12 MONTHS (IN 2023 INFLATION-ADJUSTED DOLLARS) 2023
Pitkin Unemployment
Pitkin Work Force, Unemployed Adults 16+ ( 2023 )
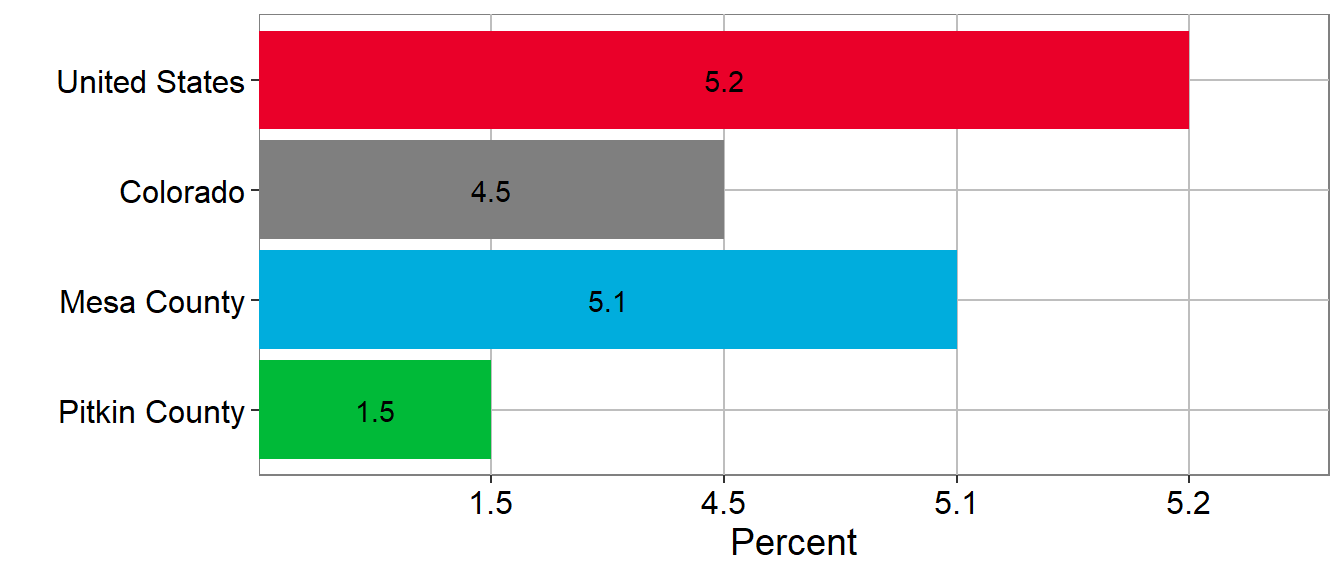
Pitkin Work Force, Unemployed Adults 16+
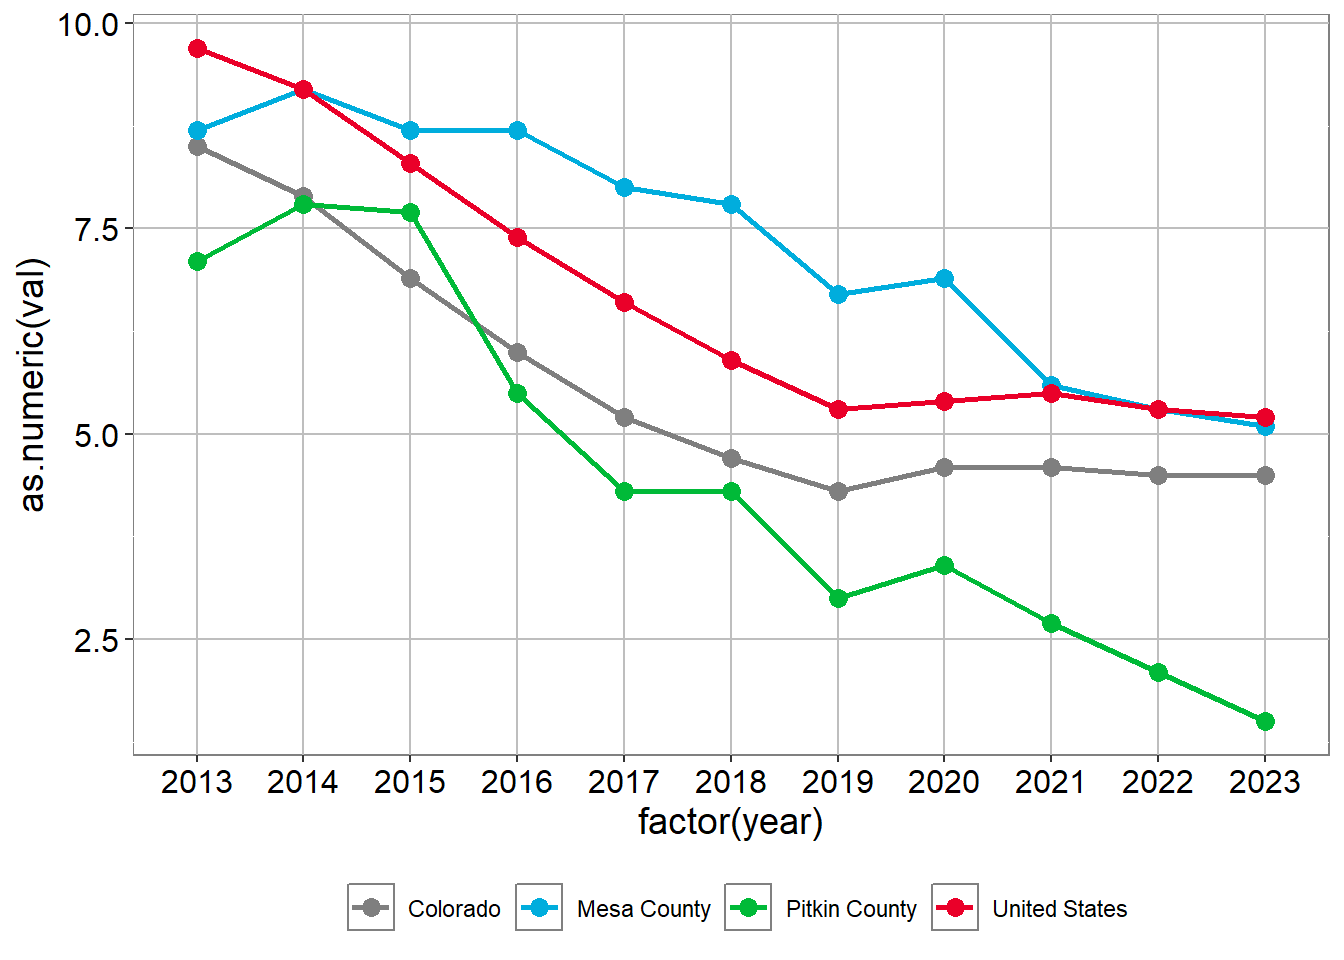
Pitkin Work Force, Unemployed Adults 16+
| 2013 | 2014 | 2015 | 2016 | 2017 | 2018 | 2019 | 2020 | 2021 | 2022 | 2023 | |
|---|---|---|---|---|---|---|---|---|---|---|---|
| Colorado | 8.5% | 7.9% | 6.9% | 6% | 5.2% | 4.7% | 4.3% | 4.6% | 4.6% | 4.5% | 4.5% |
| Pitkin County | 7.1% | 7.8% | 7.7% | 5.5% | 4.3% | 4.3% | 3% | 3.4% | 2.7% | 2.1% | 1.5% |
| United States | 9.7% | 9.2% | 8.3% | 7.4% | 6.6% | 5.9% | 5.3% | 5.4% | 5.5% | 5.3% | 5.2% |
Source: U.S. Census Bureau, American Community Survey 5-year estimates, Table: S2301; EMPLOYMENT STATUS 2023
Pitkin SNAP Usage
Pitkin HOUSEHOLD SNAP USAGE (2023)
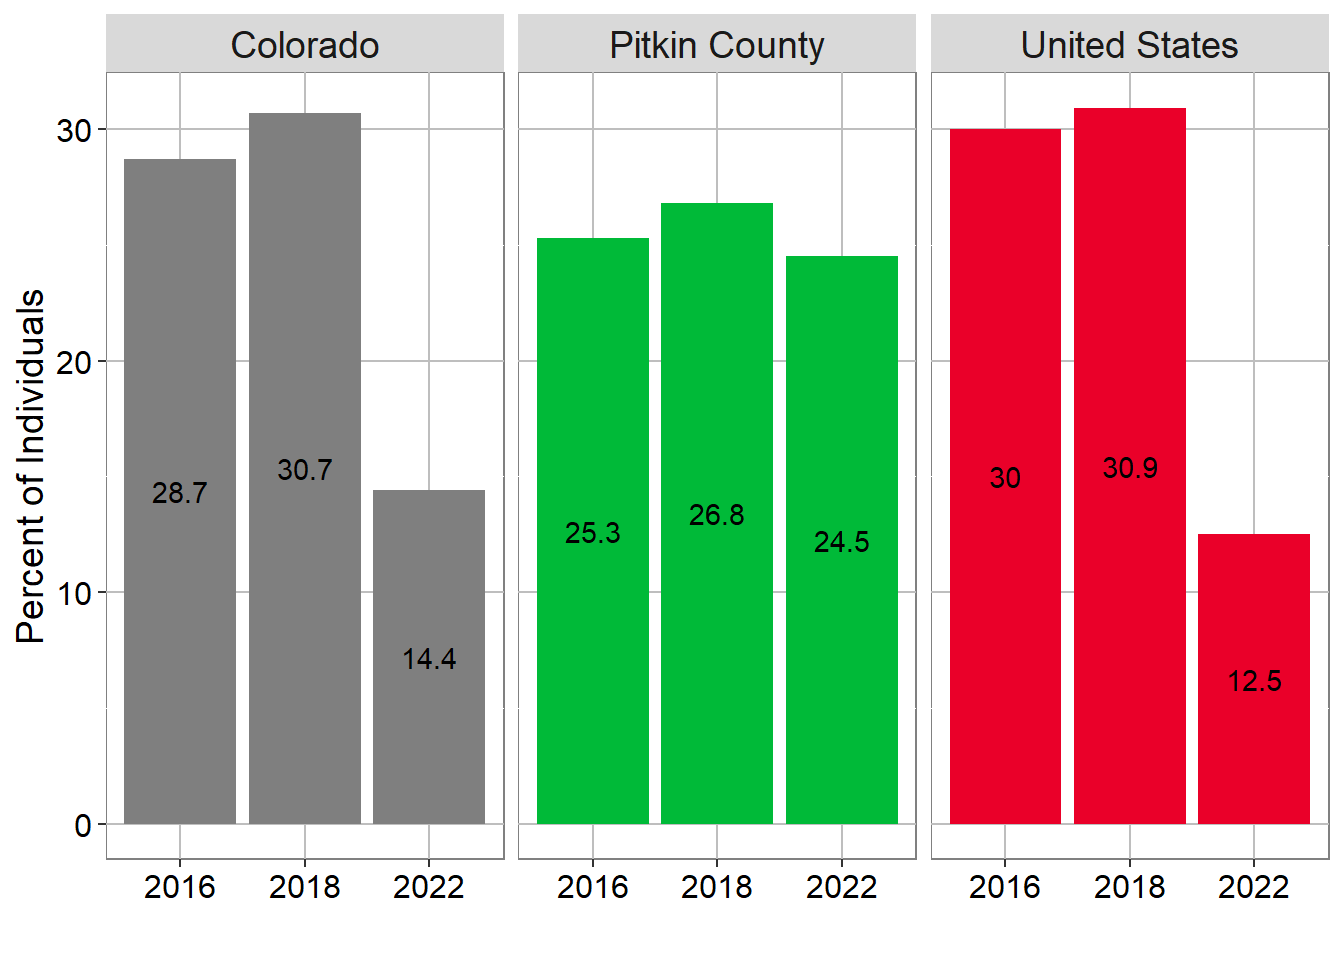
Pitkin HOUSEHOLD SNAP USAGE
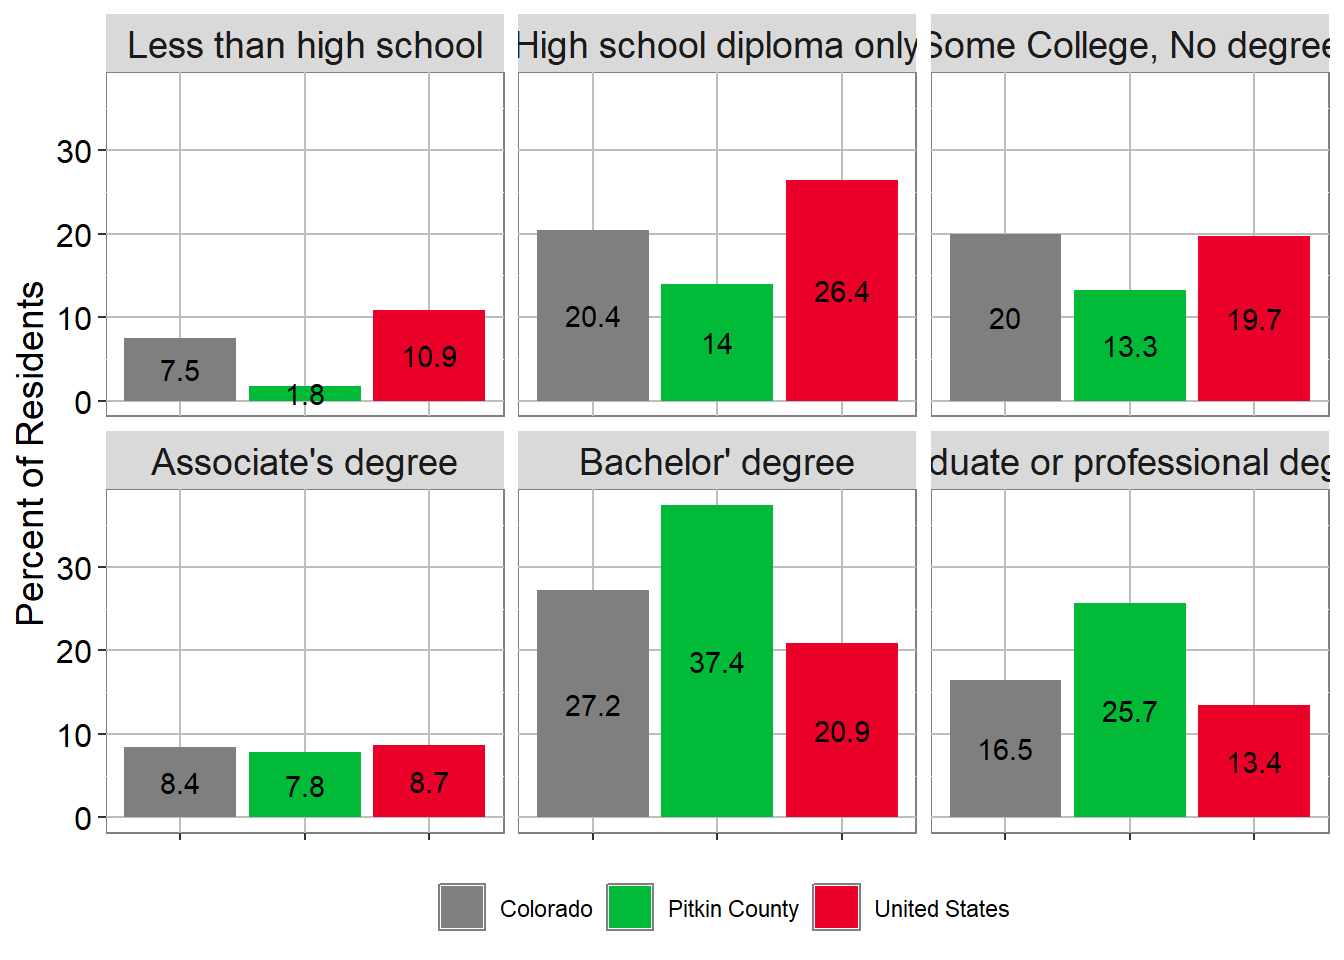
Pitkin HOUSEHOLD SNAP USAGE
| Region | 2015 | 2016 | 2017 | 2018 | 2019 | 2020 | 2021 | 2022 | 2023 |
|---|---|---|---|---|---|---|---|---|---|
| Colorado | 8.7% | 8.6% | 8.2% | 8.0% | 7.5% | 7.2% | 7.4% | 7.6% | 8.0% |
| Mesa County | 11.3% | 11.7% | 11.3% | 11.5% | 10.8% | 9.7% | 9.6% | 10.1% | 10.6% |
| Pitkin County | 1.7% | 2.5% | 2.2% | 2.7% | 3.2% | 2.2% | 1.1% | 1.8% | 1.5% |
| United States | 13.2% | 13.0% | 12.6% | 12.2% | 11.7% | 11.4% | 11.4% | 11.5% | 11.8% |
Source: U.S. Census Bureau, American Community Survey 5-year estimates, Table: S2201; FOOD STAMPS/SUPPLEMENTAL NUTRITION ASSISTANCE PROGRAM (SNAP) 2023
Pitkin Poverty
Pitkin Poverty within a Demographic for 2023
| Demographic | Pitkin County | Mesa County | Colorado | US |
|---|---|---|---|---|
| All Households | 7.2% | 11.2% | 9.4% | 12.4% |
| Households with married adults with children | 6.6% | 11.9% | 9% | 13.5% |
| Single female households with children | 24.1% | 31.8% | 25.9% | 32.6% |
| Individuals 65 and older | 3.8% | 9.8% | 8% | 10.4% |
| Hispanics of any race | 5.6% | 19.2% | 13.6% | 16.9% |
Source: U.S. Census Bureau, American Community Survey 5-year estimates, Tables: S1701; POVERTY STATUS IN THE PAST 12 MONTHS, and S1702; POVERTY STATUS IN THE PAST 12 MONTHS OF FAMILIES 2023
Pitkin County Total Poverty Percent of Households
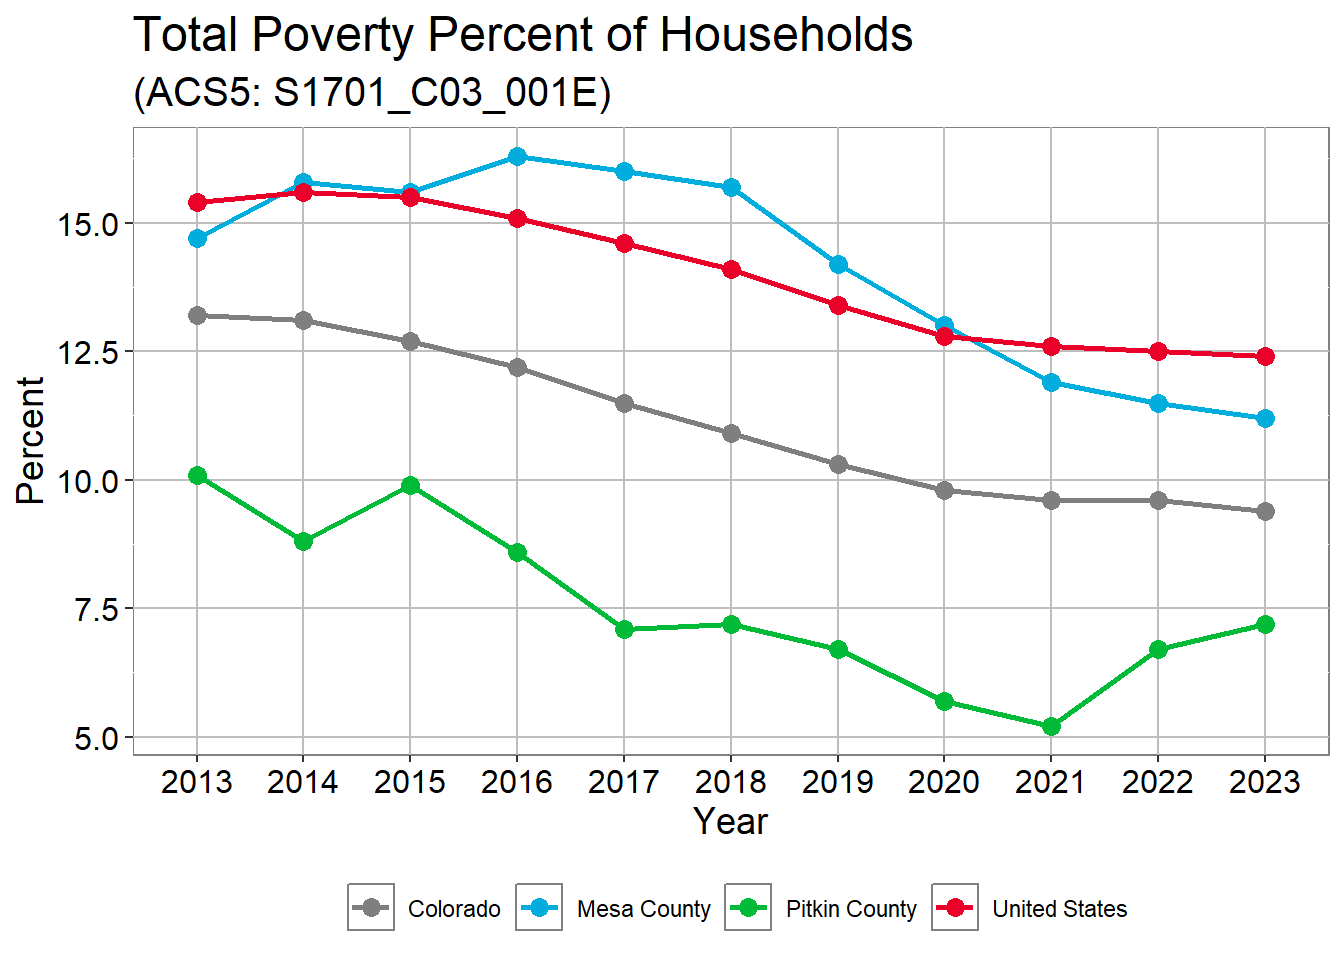
Pitkin County Total Poverty Percent of Households
| name | 2013 | 2014 | 2015 | 2016 | 2017 | 2018 | 2019 | 2020 | 2021 | 2022 | 2023 |
|---|---|---|---|---|---|---|---|---|---|---|---|
| Colorado | 13.2% | 13.1% | 12.7% | 12.2% | 11.5% | 10.9% | 10.3% | 9.8% | 9.6% | 9.6% | 9.4% |
| Mesa County | 14.7% | 15.8% | 15.6% | 16.3% | 16.0% | 15.7% | 14.2% | 13.0% | 11.9% | 11.5% | 11.2% |
| Pitkin County | 10.1% | 8.8% | 9.9% | 8.6% | 7.1% | 7.2% | 6.7% | 5.7% | 5.2% | 6.7% | 7.2% |
| United States | 15.4% | 15.6% | 15.5% | 15.1% | 14.6% | 14.1% | 13.4% | 12.8% | 12.6% | 12.5% | 12.4% |
Source: U.S. Census Bureau, American Community Survey 5-year estimates, Table: S1701; POVERTY STATUS IN THE PAST 12 MONTHS 2023
Pitkin Housing
Pitkin Percent Renter-occupied housing

Pitkin Percent Renter-occupied housing
| Region | 2014 | 2015 | 2016 | 2017 | 2018 | 2019 | 2020 | 2021 | 2022 | 2023 |
|---|---|---|---|---|---|---|---|---|---|---|
| Colorado | 35.2% | 35.7% | 35.6% | 35.3% | 35.1% | 34.8% | 33.8% | 33.9% | 33.8% | 33.7% |
| Mesa County | 30.3% | 30.9% | 32.0% | 33.0% | 32.8% | 31.8% | 30.9% | 29.6% | 28.2% | 28.1% |
| Pitkin County | 32.8% | 34.8% | 37.2% | 35.2% | 35.5% | 35.0% | 32.6% | 31.7% | 34.9% | 32.5% |
| United States | 35.6% | 36.1% | 36.4% | 36.2% | 36.2% | 36.0% | 35.6% | 35.4% | 35.2% | 35.0% |
Source: U.S. Census Bureau, American Community Survey 5-year estimates, Table: DP04; SELECTED HOUSING CHARACTERISTICS 2023
Pitkin Housing Burden: Percent of households where housing cost exceed 30% of income in 2023
| County | Total | Renters | Owners |
|---|---|---|---|
| Pitkin County | 37.5% | 49.2 ( 1,313 ) | 32.4% ( 1,975 ) |
| Mesa County | 31.6% | 49.1 ( 8,347 ) | 25.2% ( 11,696 ) |
Source: U.S. Census Bureau, American Community Survey 5-year estimates, Table: DP04; SELECTED HOUSING CHARACTERISTICS 2023
Grand County, UT
2023 Summary
Hispanic/Latino population: 12.5%
Median Age: 39.6
Educational Attainment
- High School Diploma: 94.3%
- Bachelor’s Degree or higher, age 25+: 34.7%
Median Household Income: $62,521
Employment Status:
- Percent of those 16+ in labor force: 68.1%
- Unemployment rate: 2.9%
SNAP Usage: 7.5%
Grand Population Growth
Population Growth 2014 to 2023
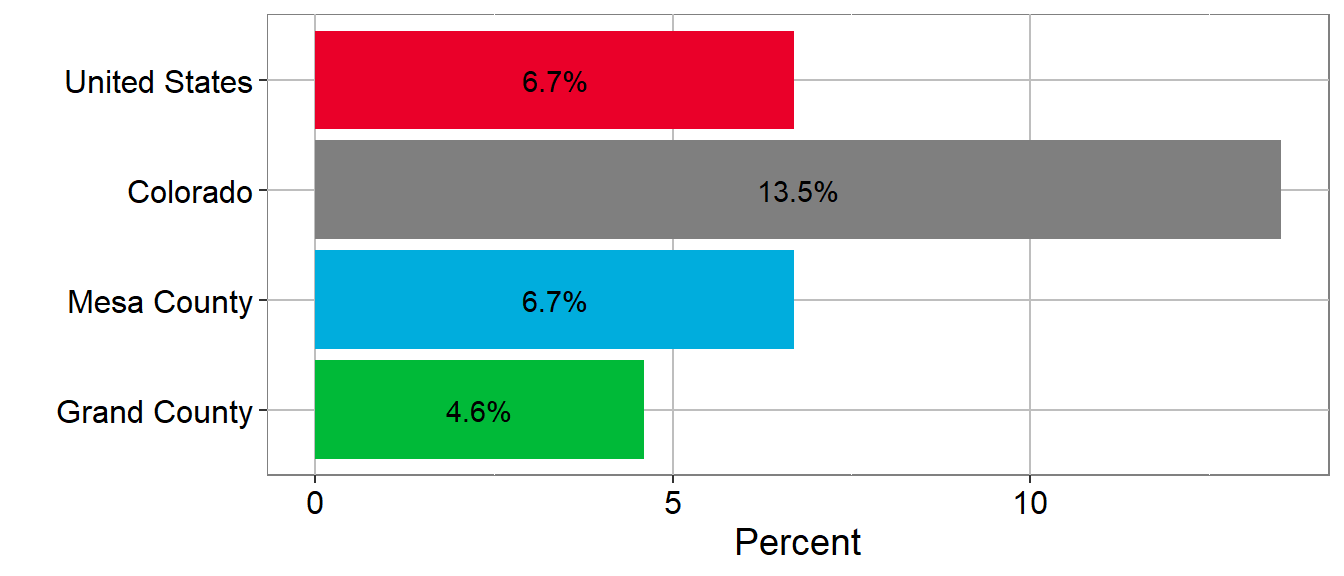
Population Growth 2014 to 2023
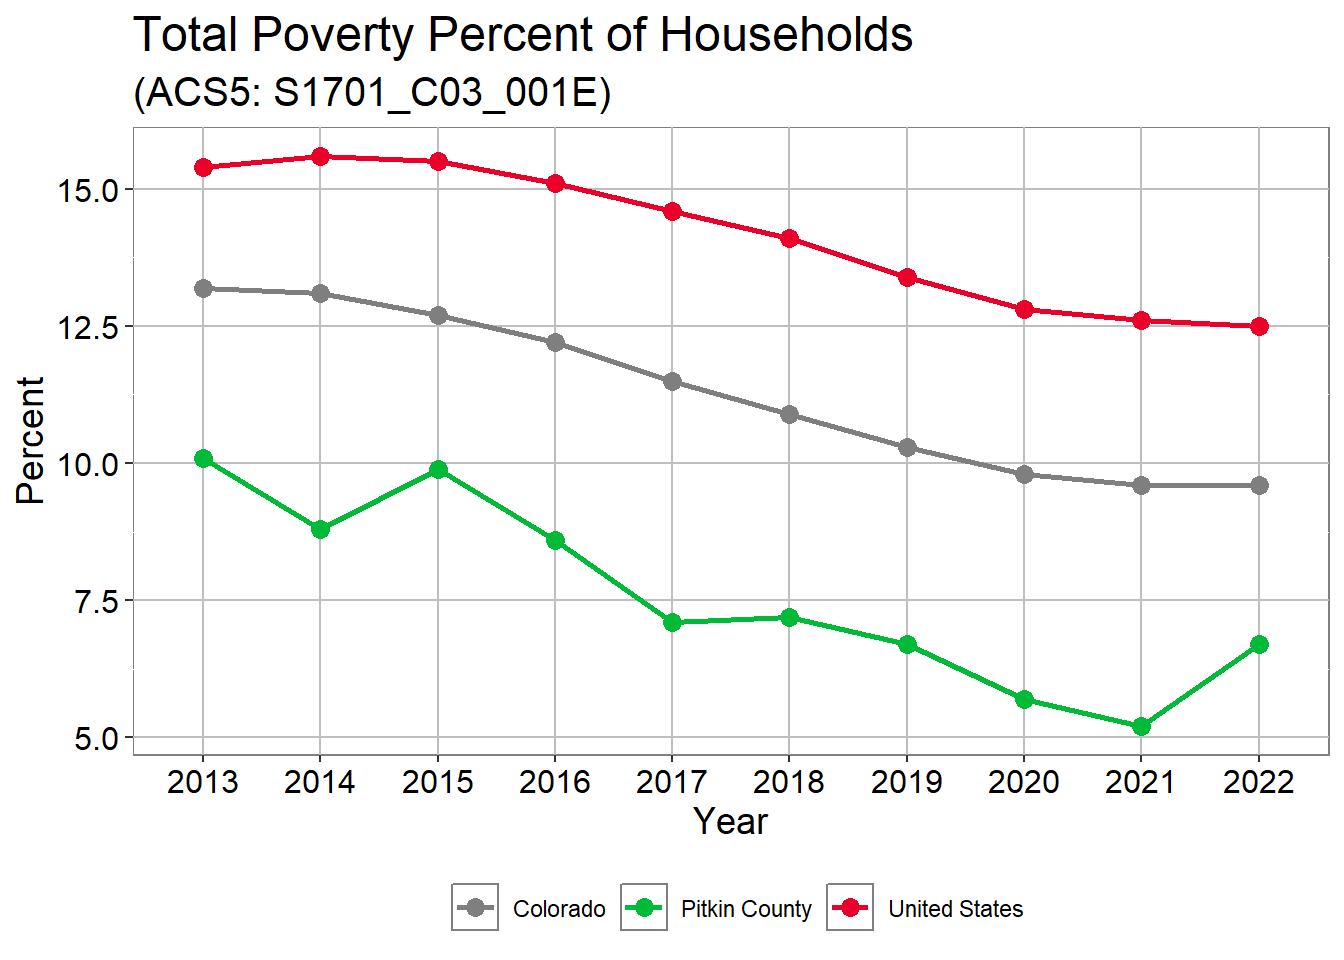
Population Growth 2014 to 2023
| Region | 2013 | 2014 | 2015 | 2016 | 2017 | 2018 | 2019 | 2020 | 2021 | 2022 | 2023 |
|---|---|---|---|---|---|---|---|---|---|---|---|
| Colorado | 0.0% | 1.5% | 3.1% | 4.7% | 6.2% | 8.0% | 9.6% | 11.0% | 11.8% | 12.7% | 13.5% |
| Grand County | 0.0% | 0.9% | 1.3% | 1.7% | 3.0% | 3.7% | 4.0% | 4.6% | 3.9% | 4.4% | 4.6% |
| Mesa County | 0.0% | 0.1% | 0.3% | 0.5% | 0.9% | 1.7% | 2.6% | 3.8% | 4.9% | 5.9% | 6.7% |
| United States | 0.0% | 0.8% | 1.6% | 2.3% | 3.0% | 3.6% | 4.2% | 4.8% | 5.8% | 6.3% | 6.7% |
Source: U.S. Census Bureau, American Community Survey 5-year estimates, Table: B01003; TOTAL POPULATION 2023
Grand Median Age
Median Age 2023
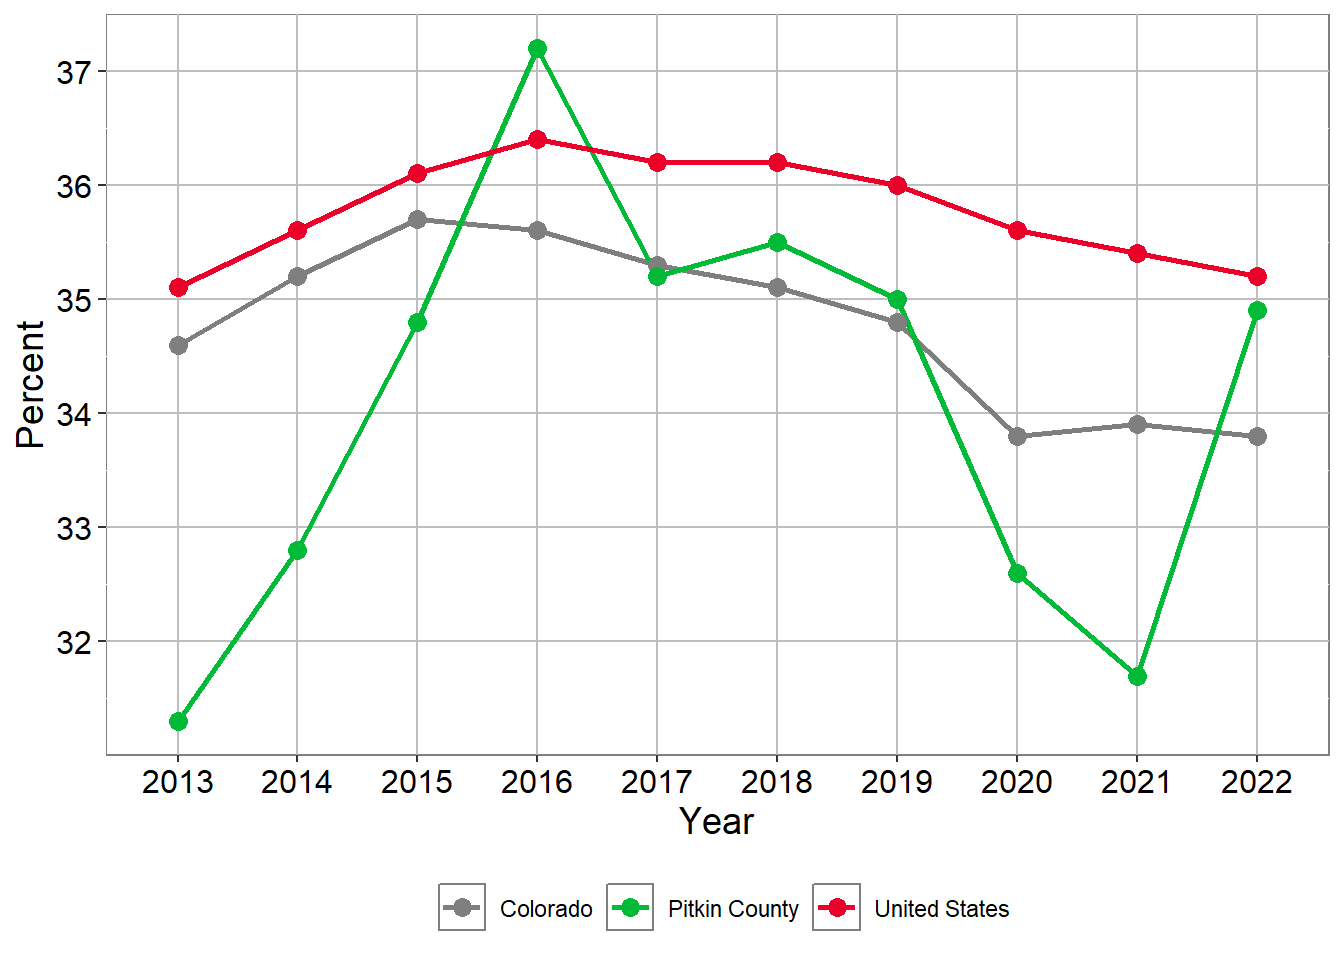
Median Age
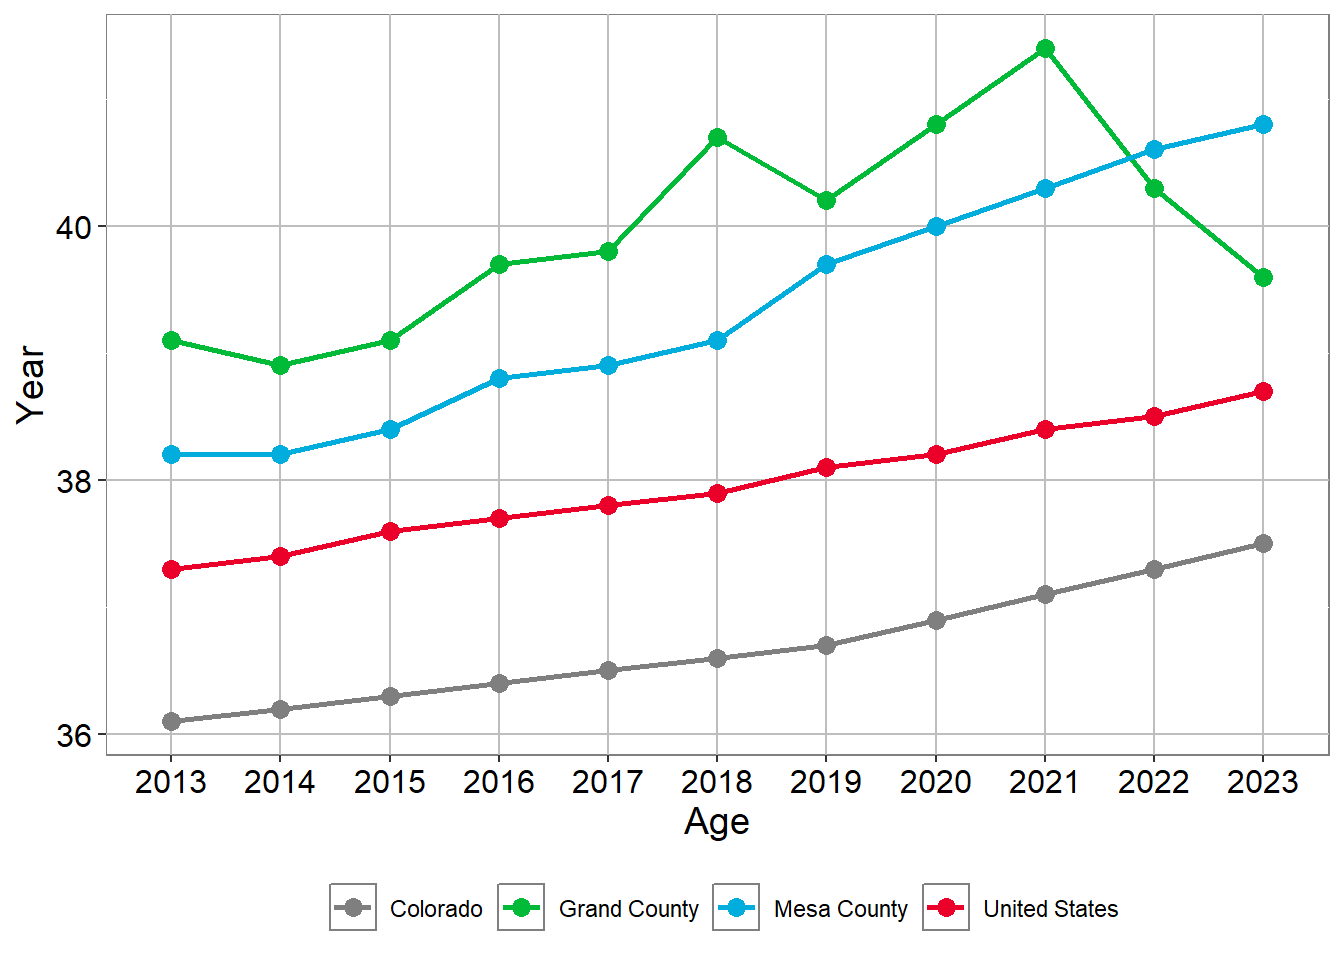
Median Age
| Region | 2013 | 2014 | 2015 | 2016 | 2017 | 2018 | 2019 | 2020 | 2021 | 2022 | 2023 |
|---|---|---|---|---|---|---|---|---|---|---|---|
| Colorado | 36.1 | 36.2 | 36.3 | 36.4 | 36.5 | 36.6 | 36.7 | 36.9 | 37.1 | 37.3 | 37.5 |
| Grand County | 39.1 | 38.9 | 39.1 | 39.7 | 39.8 | 40.7 | 40.2 | 40.8 | 41.4 | 40.3 | 39.6 |
| Mesa County | 38.2 | 38.2 | 38.4 | 38.8 | 38.9 | 39.1 | 39.7 | 40.0 | 40.3 | 40.6 | 40.8 |
| United States | 37.3 | 37.4 | 37.6 | 37.7 | 37.8 | 37.9 | 38.1 | 38.2 | 38.4 | 38.5 | 38.7 |
Source: U.S. Census Bureau, American Community Survey 5-year estimates, Table: 01002; MEDIAN AGE BY SEX 2023
Grand Race
Residents with Race other than White Alone (people of color) in 2023
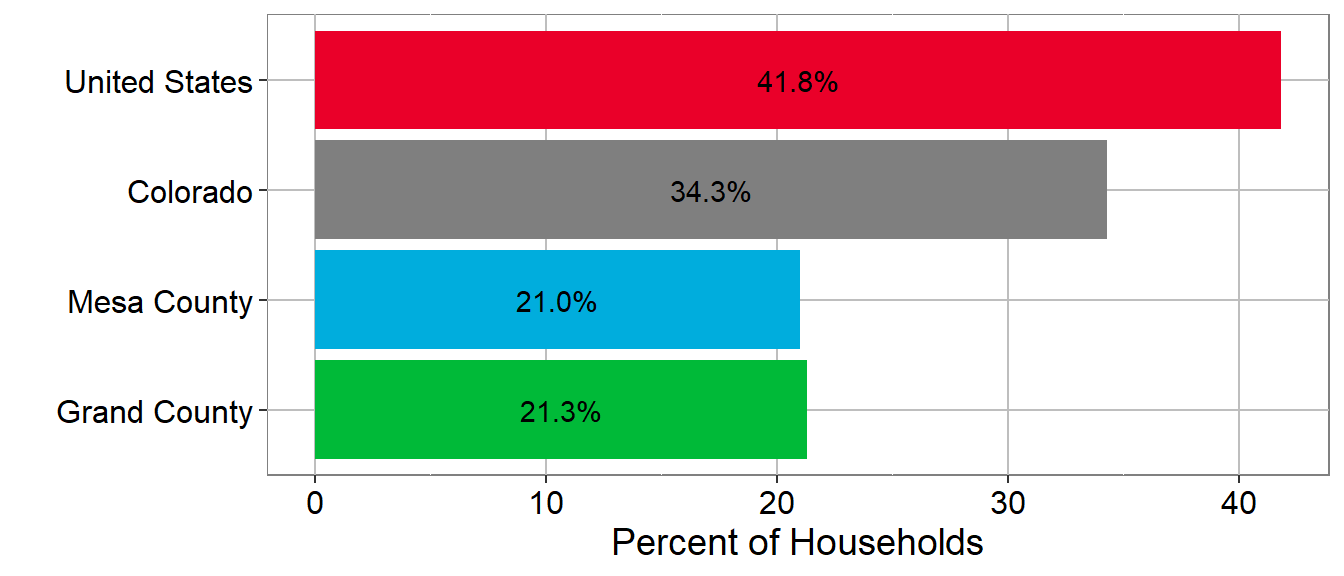
Residents with Race other than White Alone (people of color)
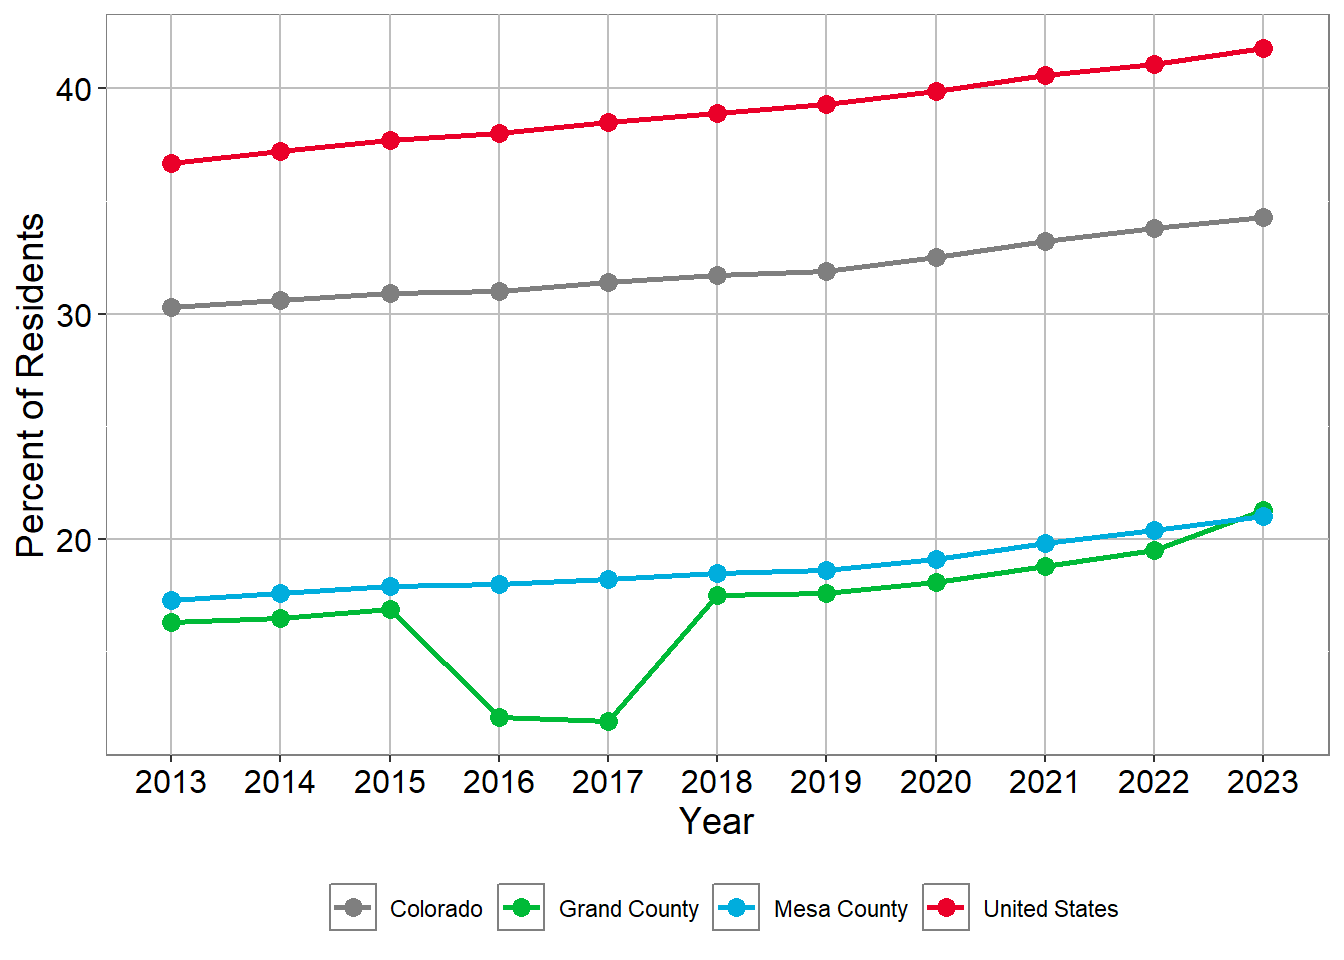
Residents with Race other than White Alone (people of color)
| Region | 2013 | 2014 | 2015 | 2016 | 2017 | 2018 | 2019 | 2020 | 2021 | 2022 | 2023 |
|---|---|---|---|---|---|---|---|---|---|---|---|
| Colorado | 30.3 | 30.6 | 30.9 | 31.0 | 31.4 | 31.7 | 31.9 | 32.5 | 33.2 | 33.8 | 34.3 |
| Grand County | 16.3 | 16.5 | 16.9 | 12.1 | 11.9 | 17.5 | 17.6 | 18.1 | 18.8 | 19.5 | 21.3 |
| Mesa County | 17.3 | 17.6 | 17.9 | 18.0 | 18.2 | 18.5 | 18.6 | 19.1 | 19.8 | 20.4 | 21.0 |
| United States | 36.7 | 37.2 | 37.7 | 38.0 | 38.5 | 38.9 | 39.3 | 39.9 | 40.6 | 41.1 | 41.8 |
Source: U.S. Census Bureau, American Community Survey 5-year estimates, Tables: B01001H; SEX BY AGE (WHITE ALONE, NOT HISPANIC OR LATINO), and B01003; TOTAL POPULATION 2023
Grand Hispanic Population
Residents age 5+ Speaking Spanish at Home in 2023
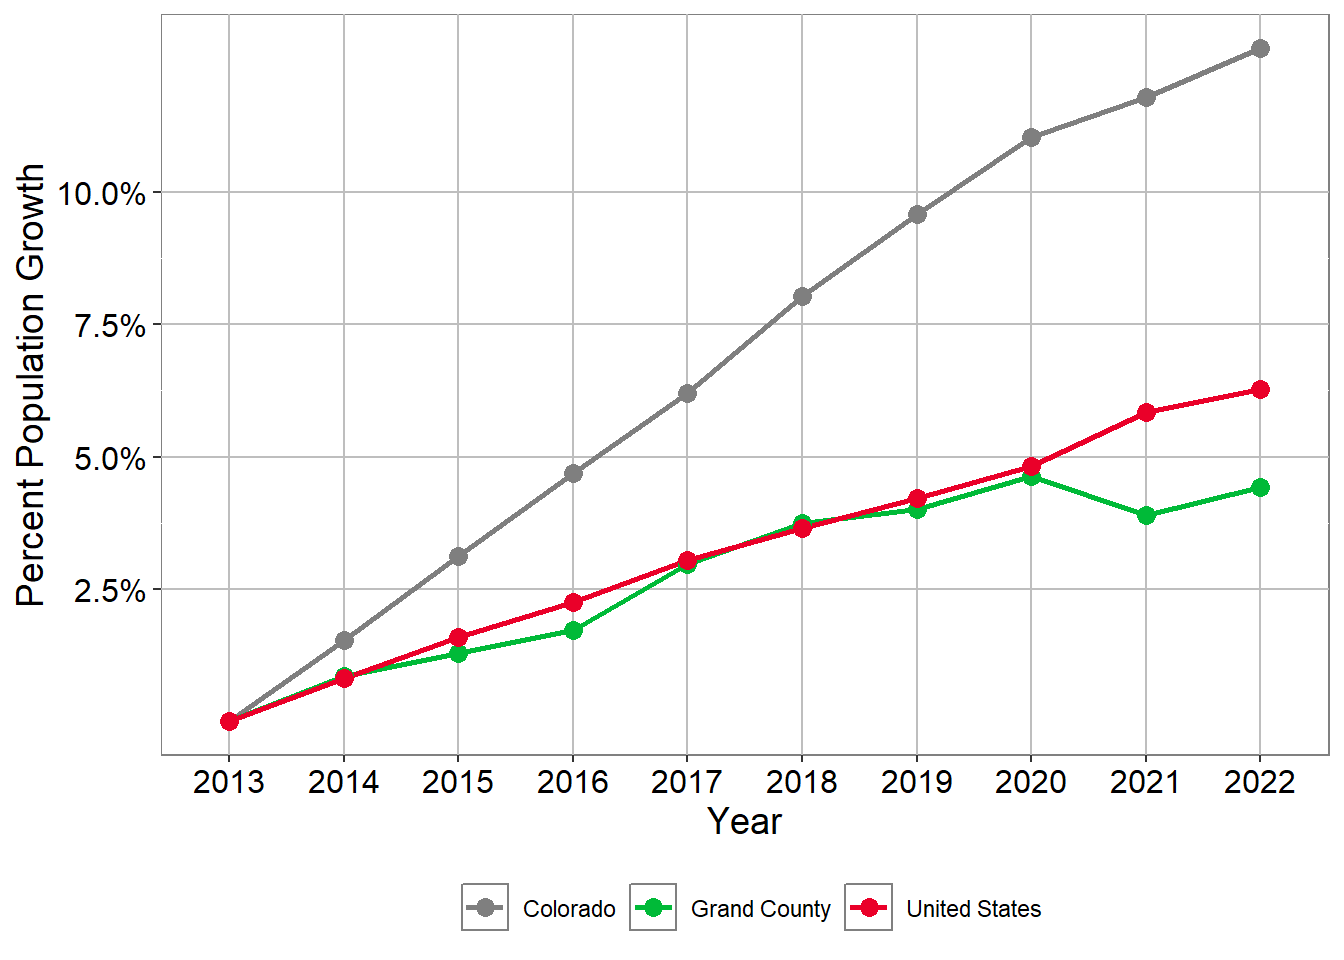
Residents age 5+ Speaking Spanish at Home
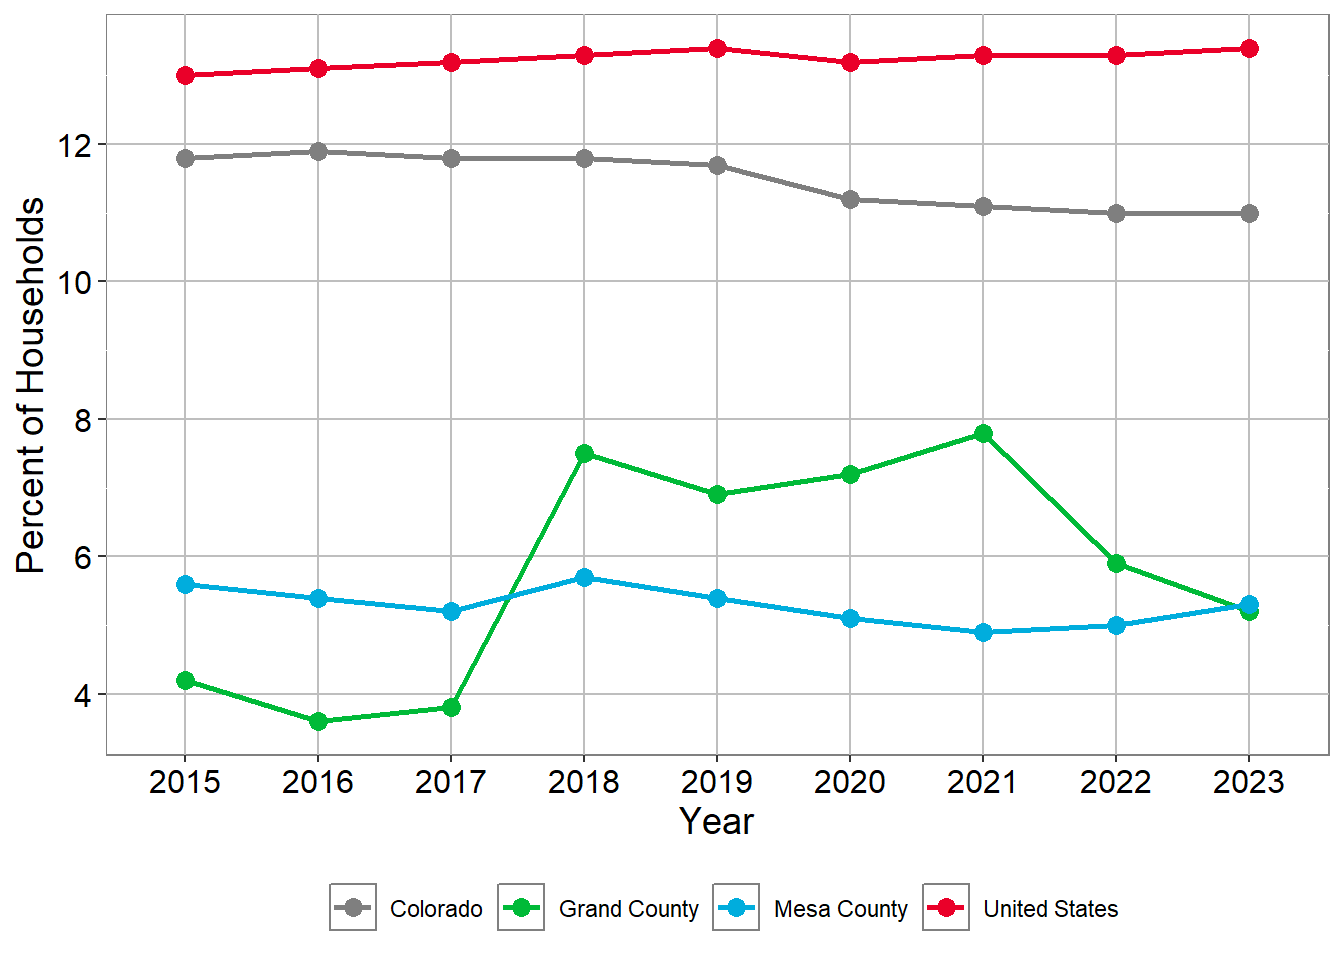
Residents age 5+ Speaking Spanish at Home
| Region | 2015 | 2016 | 2017 | 2018 | 2019 | 2020 | 2021 | 2022 | 2023 |
|---|---|---|---|---|---|---|---|---|---|
| Colorado | 11.8% | 11.9% | 11.8% | 11.8% | 11.7% | 11.2% | 11.1% | 11.0% | 11.0% |
| Grand County | 4.2% | 3.6% | 3.8% | 7.5% | 6.9% | 7.2% | 7.8% | 5.9% | 5.2% |
| Mesa County | 5.6% | 5.4% | 5.2% | 5.7% | 5.4% | 5.1% | 4.9% | 5.0% | 5.3% |
| United States | 13.0% | 13.1% | 13.2% | 13.3% | 13.4% | 13.2% | 13.3% | 13.3% | 13.4% |
Source: U.S. Census Bureau, American Community Survey 5-year estimates, Tables: S1101; HOUSEHOLDS AND FAMILIES, and S1601; LANGUAGE SPOKEN AT HOME 2023
Residents who are Hispanic or Latino in 2023
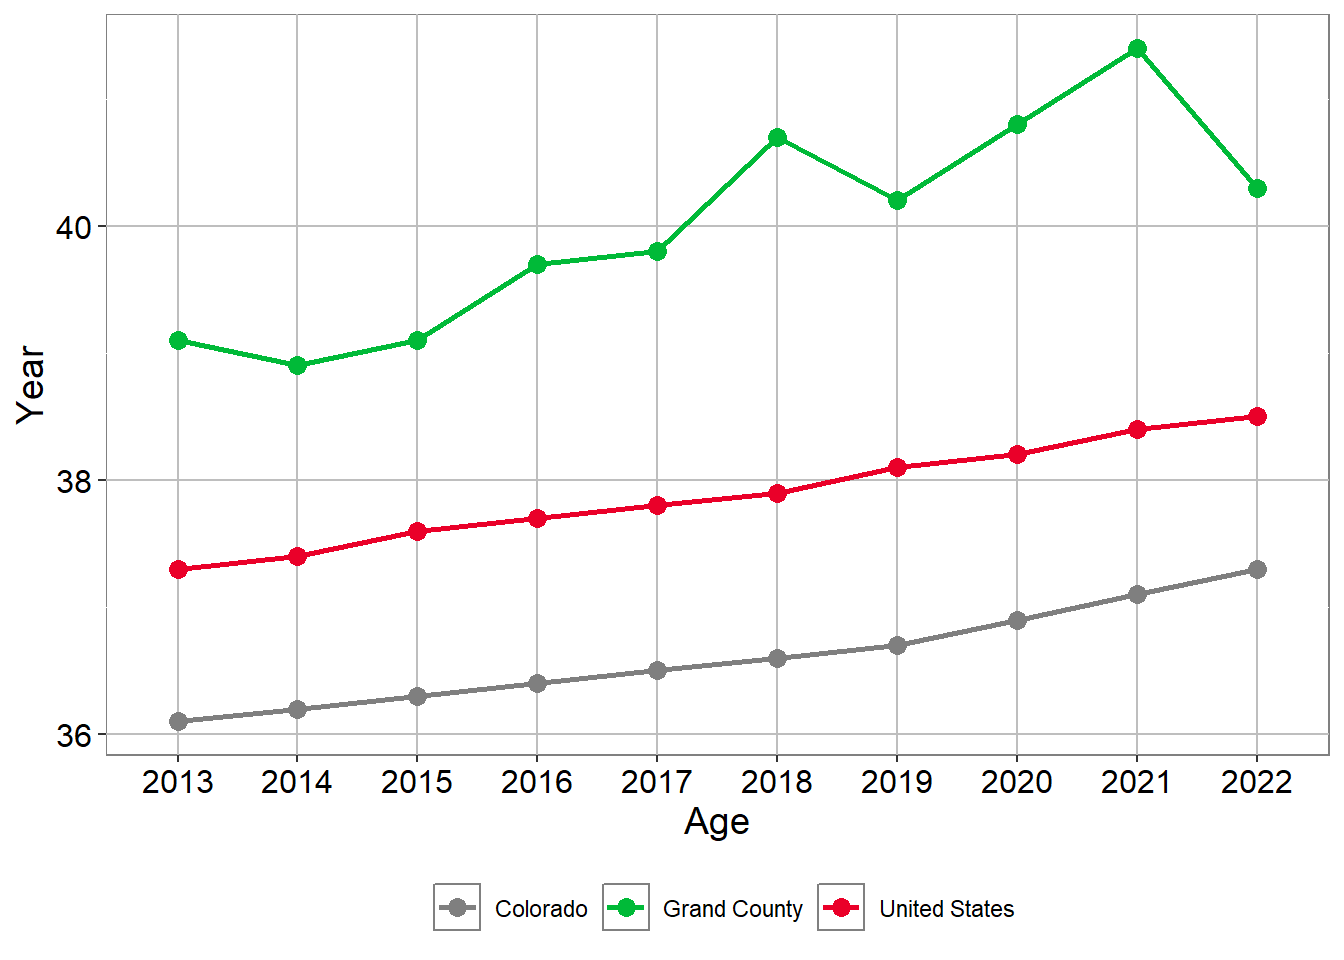
Residents who are Hispanic or Latino
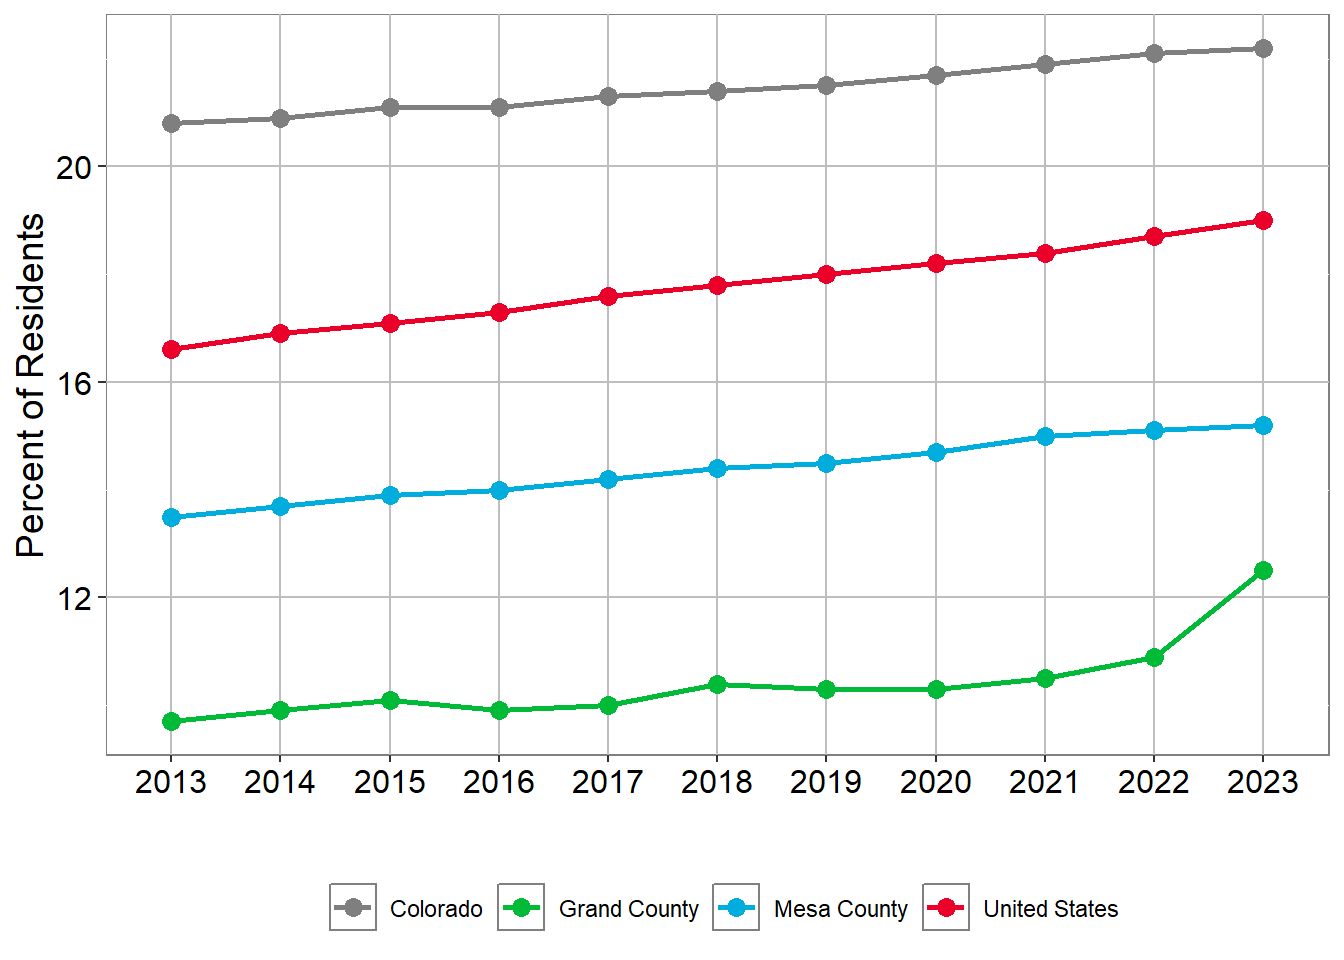
Residents who are Hispanic or Latino
| Region | 2013 | 2014 | 2015 | 2016 | 2017 | 2018 | 2019 | 2020 | 2021 | 2022 | 2023 |
|---|---|---|---|---|---|---|---|---|---|---|---|
| Colorado | 20.8% | 20.9% | 21.1% | 21.1% | 21.3% | 21.4% | 21.5% | 21.7% | 21.9% | 22.1% | 22.2% |
| Grand County | 9.7% | 9.9% | 10.1% | 9.9% | 10.0% | 10.4% | 10.3% | 10.3% | 10.5% | 10.9% | 12.5% |
| Mesa County | 13.5% | 13.7% | 13.9% | 14.0% | 14.2% | 14.4% | 14.5% | 14.7% | 15.0% | 15.1% | 15.2% |
| United States | 16.6% | 16.9% | 17.1% | 17.3% | 17.6% | 17.8% | 18.0% | 18.2% | 18.4% | 18.7% | 19.0% |
Source: U.S. Census Bureau, American Community Survey 5-year estimates, Table: B03003; HISPANIC OR LATINO ORIGIN 2023
Grand Educational Attainment
Percent of people age 18 to 24 that are Highschool Graduate’s
| 2017 | 2020 | 2023 | |
|---|---|---|---|
| Grand County | 77% | 64.4% | 55.3% |
| Mesa County | 27.2% | 29.9% | 33.2% |
| Colorado | 29.5% | 31.5% | 33.8% |
| United States | 30.5% | 31.4% | 34.6% |
Source: U.S. Census Bureau, American Community Survey 5-year estimates, Table: S1501; EDUCATIONAL ATTAINMENT 2023
Percent of people age 18 to 24 that are Bachelor’s Degree’s
| 2017 | 2020 | 2023 | |
|---|---|---|---|
| Grand County | 0% | 11.8% | 12.9% |
| Mesa County | 4.5% | 7.8% | 7.9% |
| Colorado | 11.5% | 13.2% | 14.3% |
| United States | 10.5% | 11.8% | 12.9% |
Source: U.S. Census Bureau, American Community Survey 5-year estimates, Table: S1501; EDUCATIONAL ATTAINMENT 2023
Percent of people age 25+ that have Bachelor’s Degree’s or higher
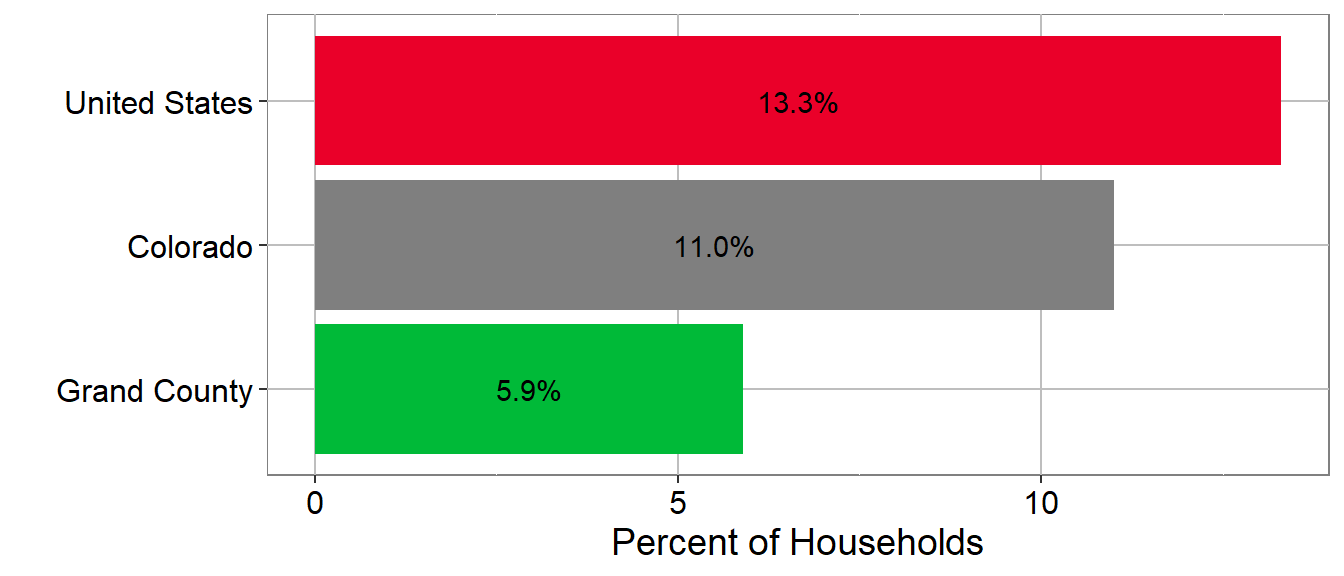
Source: U.S. Census Bureau, American Community Survey 5-year estimates, Table: S1501; EDUCATIONAL ATTAINMENT 2023
Over all Educational Attainment age 25+
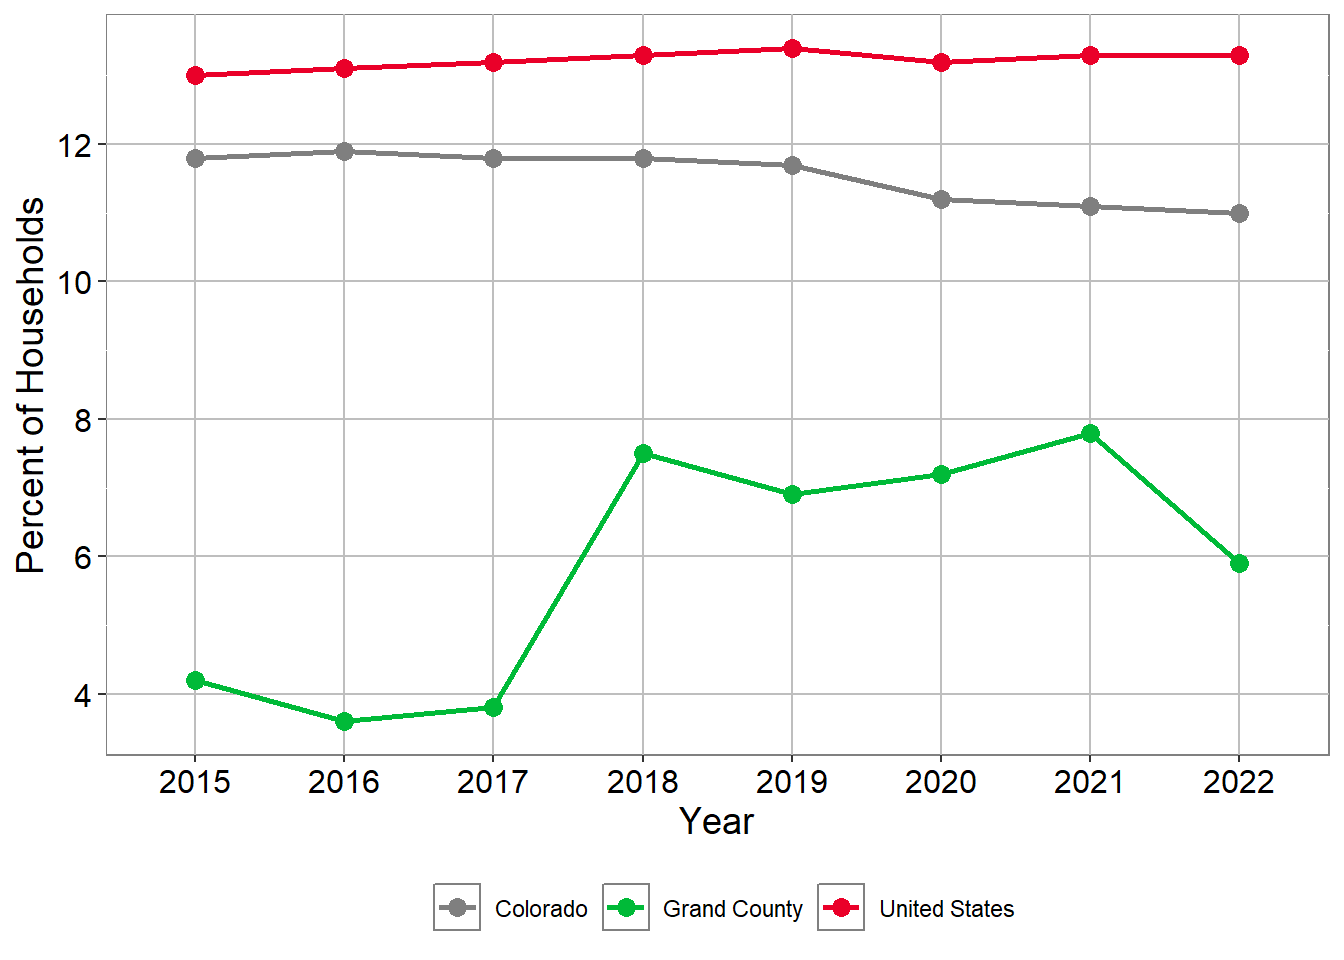
Source: U.S. Census Bureau, American Community Survey 5-year estimates, Table: B15003; EDUCATIONAL ATTAINMENT FOR THE POPULATION 25 YEARS AND OVER 2023
Grand Economic Characteristics
Grand Median Income
Grand Median Household Income
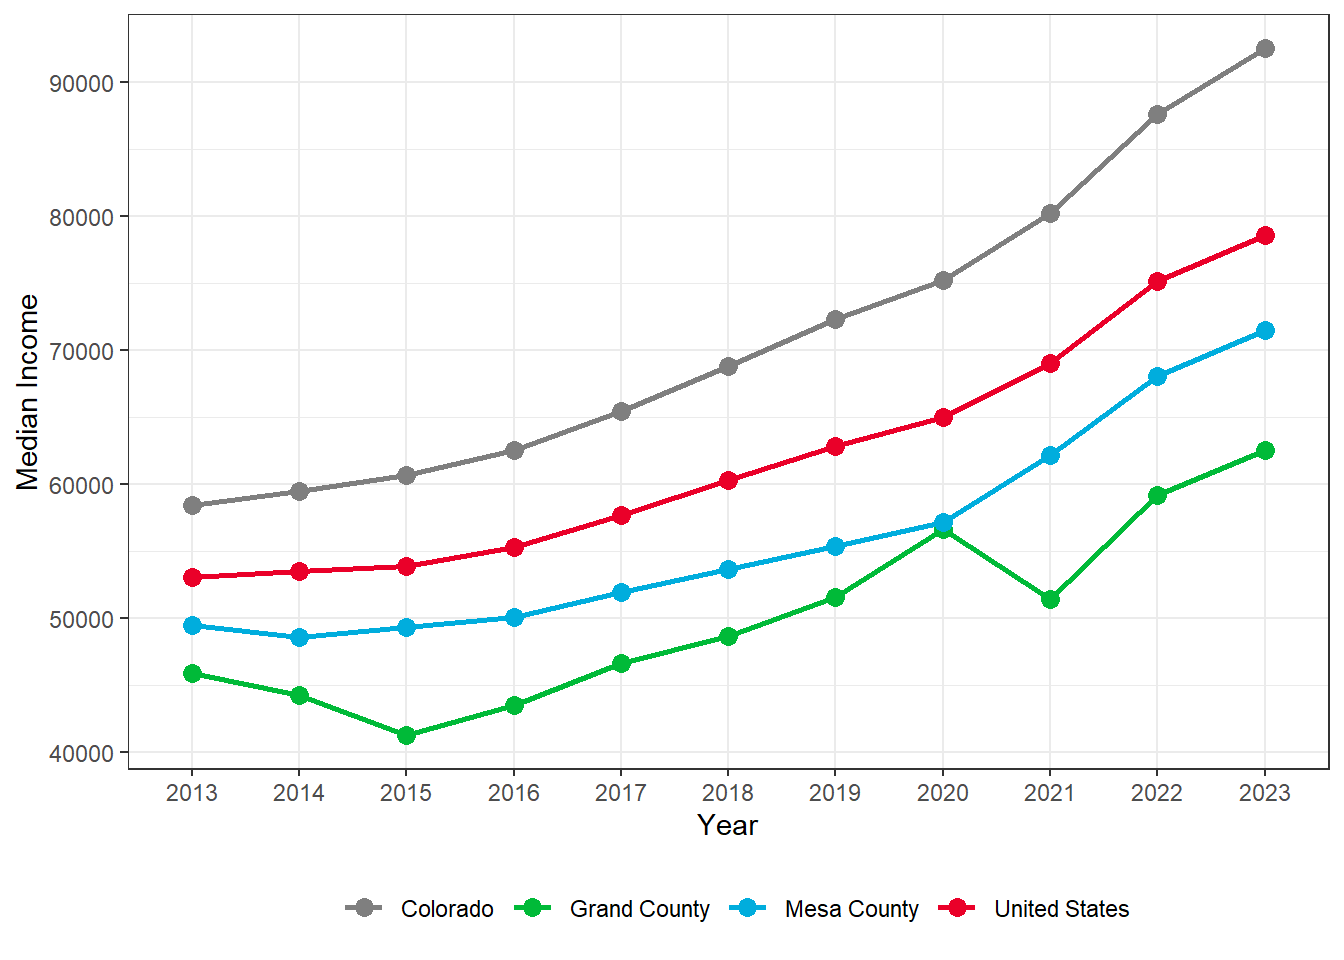
Grand Median Household Income
| Region | 2013 | 2014 | 2015 | 2016 | 2017 | 2018 | 2019 | 2020 | 2021 | 2022 | 2023 |
|---|---|---|---|---|---|---|---|---|---|---|---|
| Colorado | 58,433 | 59,448 | 60,629 | 62,520 | 65,458 | 68,811 | 72,331 | 75,231 | 80,184 | 87,598 | 92,470 |
| Grand County | 45,888 | 44,239 | 41,312 | 43,529 | 46,658 | 48,673 | 51,557 | 56,639 | 51,433 | 59,171 | 62,521 |
| Mesa County | 49,471 | 48,610 | 49,322 | 50,070 | 51,971 | 53,683 | 55,379 | 57,157 | 62,127 | 68,077 | 71,485 |
| United States | 53,046 | 53,482 | 53,889 | 55,322 | 57,652 | 60,293 | 62,843 | 64,994 | 69,021 | 75,149 | 78,538 |
Source: U.S. Census Bureau, American Community Survey 5-year estimates, Table: S1901; INCOME IN THE PAST 12 MONTHS (IN 2023 INFLATION-ADJUSTED DOLLARS) 2023
Grand Unemployment
Grand Work Force, Unemployed Adults 16+ ( 2023 )

Grand Work Force, Unemployed Adults 16+
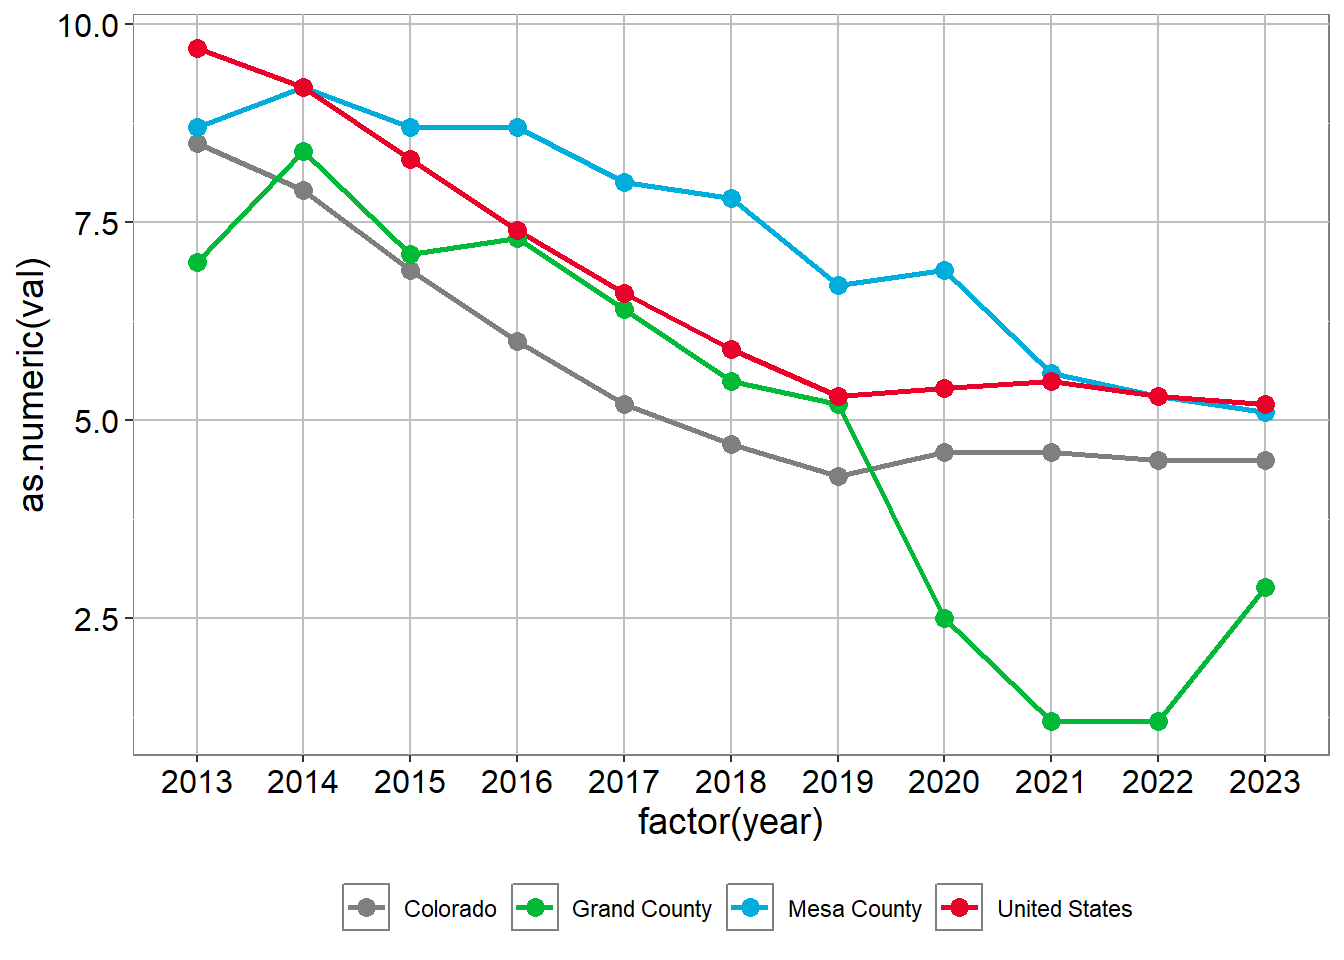
Grand Work Force, Unemployed Adults 16+
| 2013 | 2014 | 2015 | 2016 | 2017 | 2018 | 2019 | 2020 | 2021 | 2022 | 2023 | |
|---|---|---|---|---|---|---|---|---|---|---|---|
| Colorado | 8.5% | 7.9% | 6.9% | 6% | 5.2% | 4.7% | 4.3% | 4.6% | 4.6% | 4.5% | 4.5% |
| Grand County | 7% | 8.4% | 7.1% | 7.3% | 6.4% | 5.5% | 5.2% | 2.5% | 1.2% | 1.2% | 2.9% |
| United States | 9.7% | 9.2% | 8.3% | 7.4% | 6.6% | 5.9% | 5.3% | 5.4% | 5.5% | 5.3% | 5.2% |
Source: U.S. Census Bureau, American Community Survey 5-year estimates, Table: S2301; EMPLOYMENT STATUS 2023
Grand SNAP Usage
Grand HOUSEHOLD SNAP USAGE (2023)
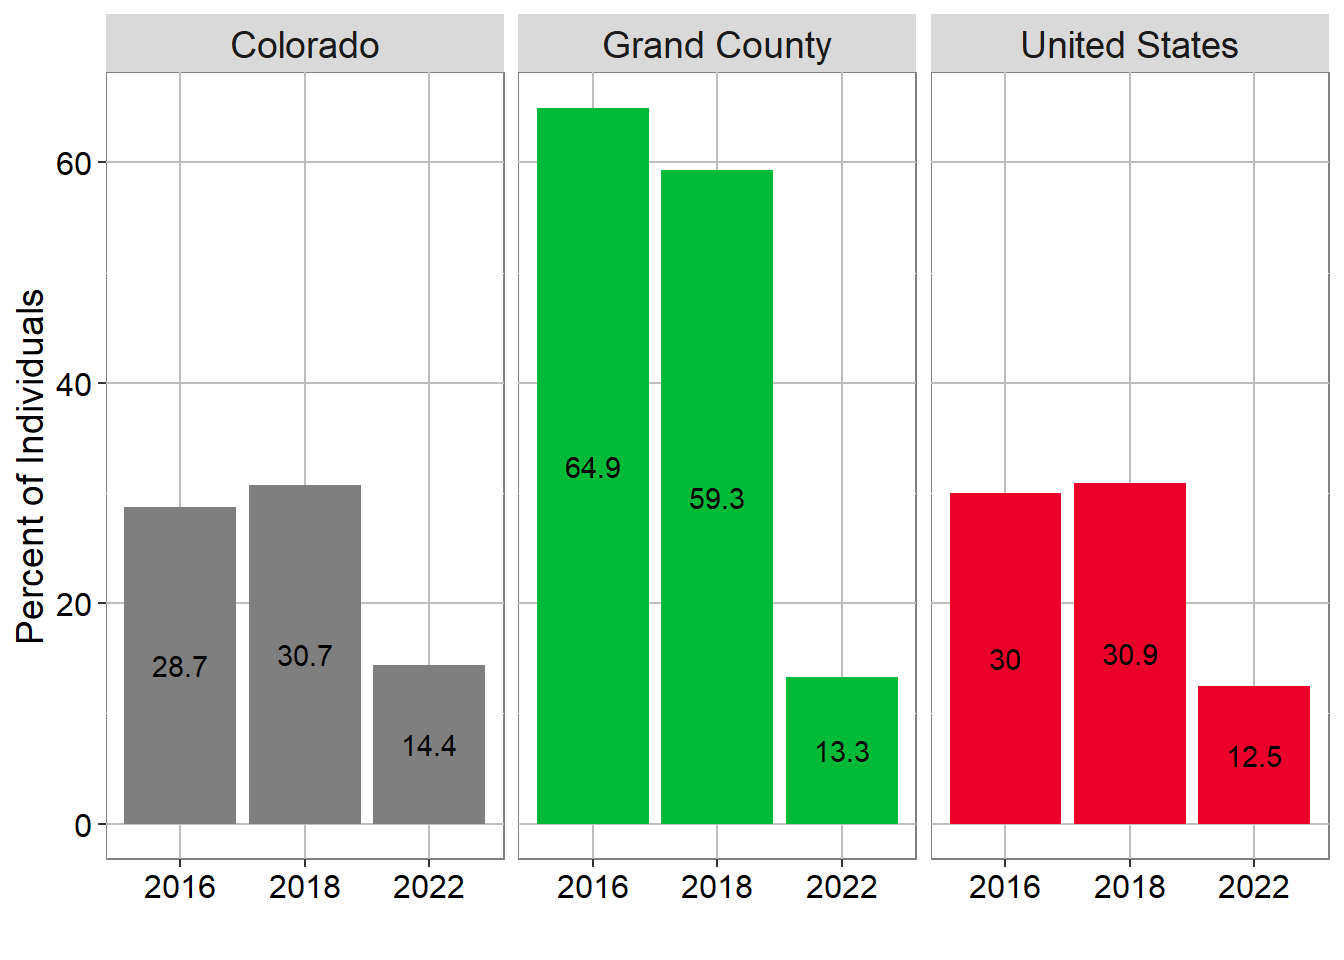
Grand HOUSEHOLD SNAP USAGE
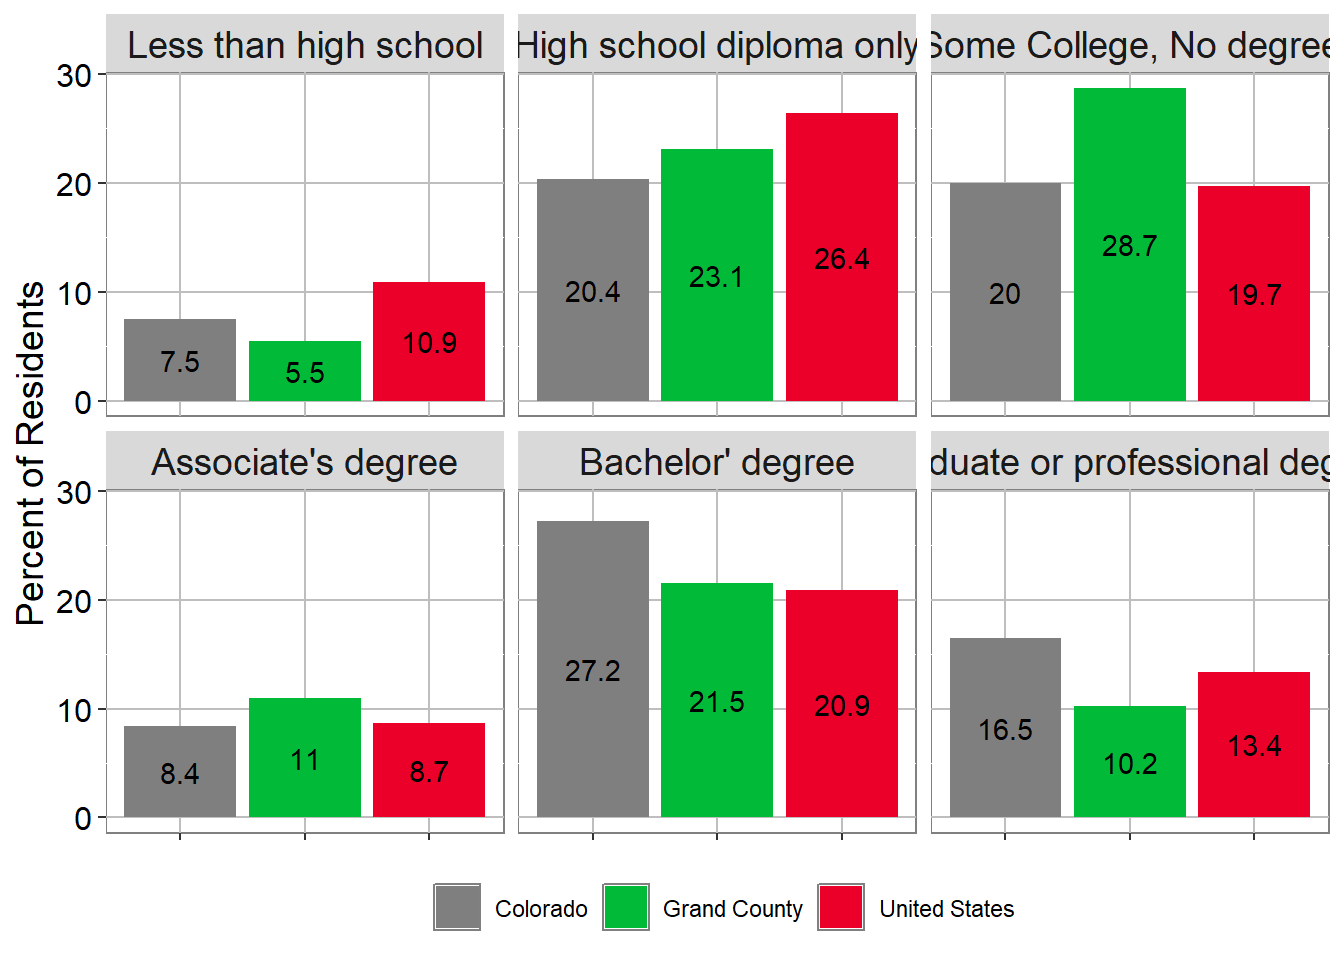
Grand HOUSEHOLD SNAP USAGE
| Region | 2015 | 2016 | 2017 | 2018 | 2019 | 2020 | 2021 | 2022 | 2023 |
|---|---|---|---|---|---|---|---|---|---|
| Colorado | 8.7% | 8.6% | 8.2% | 8.0% | 7.5% | 7.2% | 7.4% | 7.6% | 8.0% |
| Grand County | 8.9% | 9.5% | 9.4% | 7.7% | 9.8% | 13.1% | 9.0% | 8.2% | 7.5% |
| Mesa County | 11.3% | 11.7% | 11.3% | 11.5% | 10.8% | 9.7% | 9.6% | 10.1% | 10.6% |
| United States | 13.2% | 13.0% | 12.6% | 12.2% | 11.7% | 11.4% | 11.4% | 11.5% | 11.8% |
Source: U.S. Census Bureau, American Community Survey 5-year estimates, Table: S2201; FOOD STAMPS/SUPPLEMENTAL NUTRITION ASSISTANCE PROGRAM (SNAP) 2023
Grand Poverty
Grand Poverty within a Demographic for 2023
| Demographic | Grand County | Mesa County | Colorado | US |
|---|---|---|---|---|
| All Households | 17% | 11.2% | 9.4% | 12.4% |
| Households with married adults with children | 17.2% | 11.9% | 9% | 13.5% |
| Single female households with children | 30.6% | 31.8% | 25.9% | 32.6% |
| Individuals 65 and older | 18.9% | 9.8% | 8% | 10.4% |
| Hispanics of any race | 17.2% | 19.2% | 13.6% | 16.9% |
Source: U.S. Census Bureau, American Community Survey 5-year estimates, Tables: S1701; POVERTY STATUS IN THE PAST 12 MONTHS, and S1702; POVERTY STATUS IN THE PAST 12 MONTHS OF FAMILIES 2023
Grand County Total Poverty Percent of Households
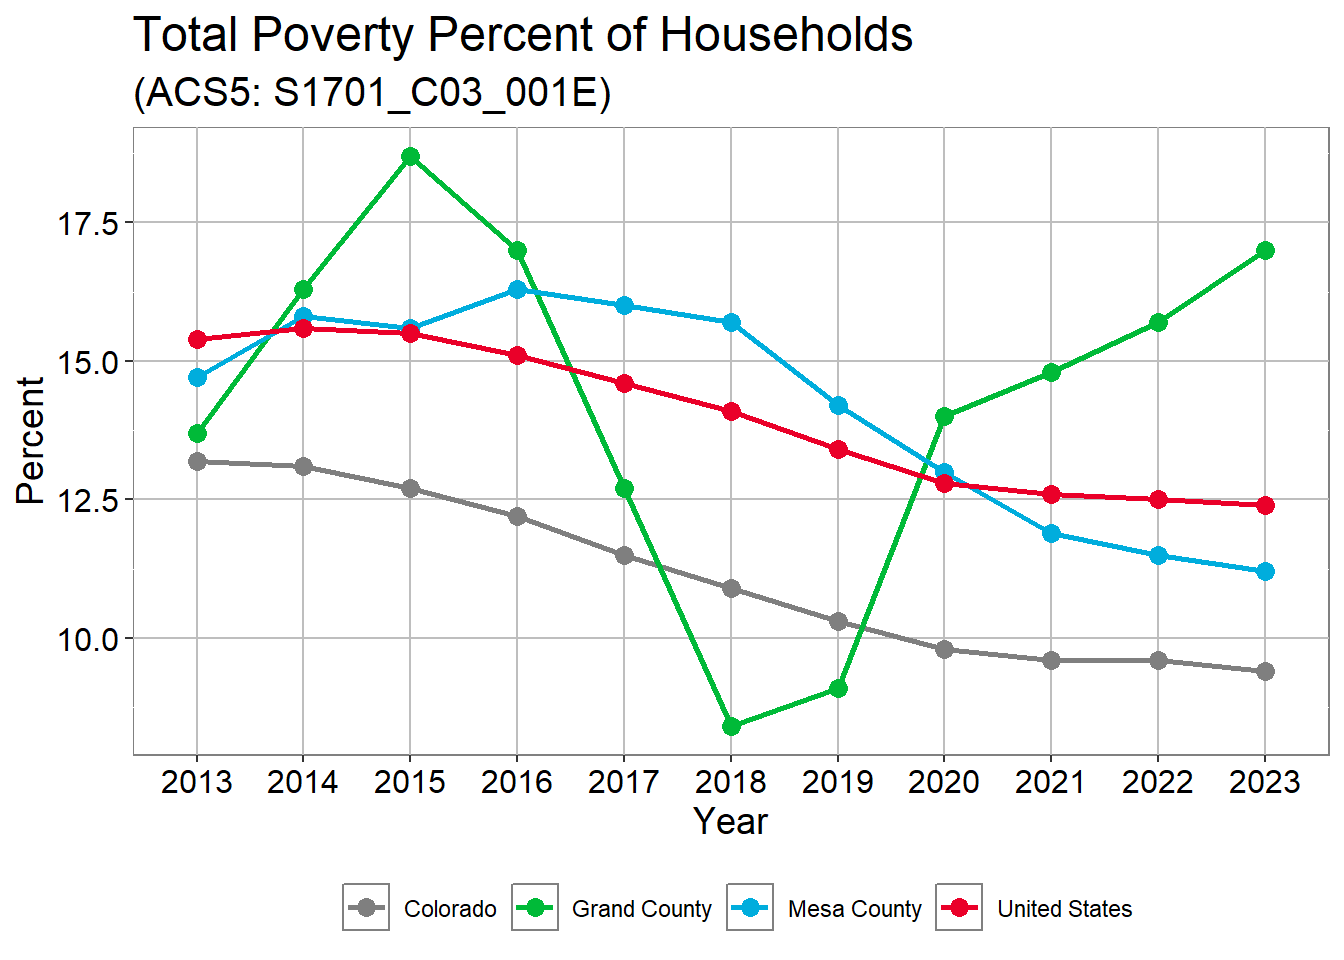
Grand County Total Poverty Percent of Households
| name | 2013 | 2014 | 2015 | 2016 | 2017 | 2018 | 2019 | 2020 | 2021 | 2022 | 2023 |
|---|---|---|---|---|---|---|---|---|---|---|---|
| Colorado | 13.2% | 13.1% | 12.7% | 12.2% | 11.5% | 10.9% | 10.3% | 9.8% | 9.6% | 9.6% | 9.4% |
| Grand County | 13.7% | 16.3% | 18.7% | 17.0% | 12.7% | 8.4% | 9.1% | 14.0% | 14.8% | 15.7% | 17.0% |
| Mesa County | 14.7% | 15.8% | 15.6% | 16.3% | 16.0% | 15.7% | 14.2% | 13.0% | 11.9% | 11.5% | 11.2% |
| United States | 15.4% | 15.6% | 15.5% | 15.1% | 14.6% | 14.1% | 13.4% | 12.8% | 12.6% | 12.5% | 12.4% |
Source: U.S. Census Bureau, American Community Survey 5-year estimates, Table: S1701; POVERTY STATUS IN THE PAST 12 MONTHS 2023
Grand Housing
Grand Percent Renter-occupied housing
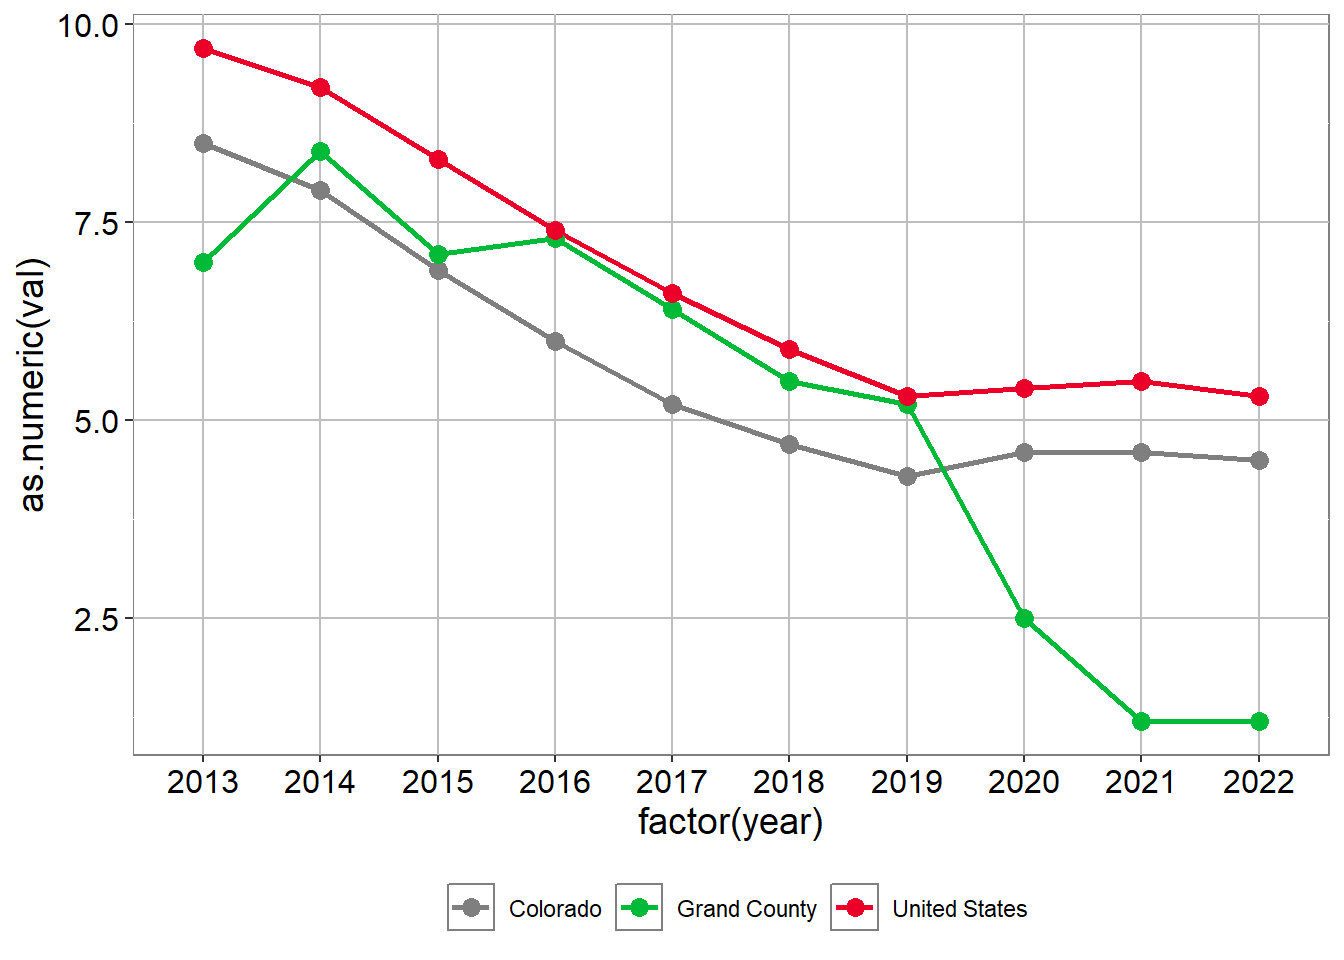
Grand Percent Renter-occupied housing
| Region | 2014 | 2015 | 2016 | 2017 | 2018 | 2019 | 2020 | 2021 | 2022 | 2023 |
|---|---|---|---|---|---|---|---|---|---|---|
| Colorado | 35.2% | 35.7% | 35.6% | 35.3% | 35.1% | 34.8% | 33.8% | 33.9% | 33.8% | 33.7% |
| Grand County | 33.8% | 31.8% | 30.4% | 30.0% | 35.3% | 34.9% | 34.4% | 35.1% | 33.0% | 30.2% |
| Mesa County | 30.3% | 30.9% | 32.0% | 33.0% | 32.8% | 31.8% | 30.9% | 29.6% | 28.2% | 28.1% |
| United States | 35.6% | 36.1% | 36.4% | 36.2% | 36.2% | 36.0% | 35.6% | 35.4% | 35.2% | 35.0% |
Source: U.S. Census Bureau, American Community Survey 5-year estimates, Table: DP04; SELECTED HOUSING CHARACTERISTICS 2023
Grand Housing Burden: Percent of households where housing cost exceed 30% of income in 2023
| County | Total | Renters | Owners |
|---|---|---|---|
| Grand County | 32.1% | 42.5 ( 482 ) | 28.3% ( 882 ) |
| Mesa County | 31.6% | 49.1 ( 8,347 ) | 25.2% ( 11,696 ) |
Source: U.S. Census Bureau, American Community Survey 5-year estimates, Table: DP04; SELECTED HOUSING CHARACTERISTICS 2023
References
1.
2.
ETC Institute, National Survey Data on Quality of Life Indicators, 2020
3.
U.S. Census Bureau, American Community Survey 5-year estimates, Table: S0101; AGE AND SEX 2023
4.
Colorado Department of Local Affairs, State Demography Office Vintage 2023
5.
Colorado Department of Public Health and Environment, Colorado Health Information Dataset - Live Birth Statistics, 2000-2022
6.
Colorado Department of Public Health and Environment, Taking the Unintended Out of Pregnancy: Colorado’s Success with Long-Acting Reversible Contraception, 2017
7.
Colorado Department of Public Health and Environment, Colorado Health Information Dataset - Death Statistics, 2000-2022
8.
U.S. Census Bureau, American Community Survey 5-year estimates, Table: DP05; DEMOGRAPHIC AND HOUSING ESTIMATES 2023
9.
10.
U.S. Census Bureau, American Community Survey 5-year estimates, Table: S1601; LANGUAGE SPOKEN AT HOME 2023
11.
The Williams Institute, UCLA School of Law, LGBT Demographic Data Interactive, 2019, 2023
12.
U.S. Census Bureau, American Community Survey 5-year estimates, Table: S1801; DISABILITY CHARACTERISTICS 2023
13.
U.S. Census Bureau, American Community Survey 5-year estimates, Table: S1501; EDUCATIONAL ATTAINMENT, 2023
14.
U.S. Bureau of Labor Statistics, Civilian Unemployment Rate, 2023
15.
U.S. Bureau of Labor Statistics, Unemployment Rates for States, 2023
16.
Mesa County Workforce Center, Workforce Center Dashboard Statistics, Personal Communication, 2008-2023
17.
U.S. Census Bureau, American Community Survey 5-year estimates, Table: DP03; SELECTED ECONOMIC CHARACTERISTICS 2023
18.
U.S. Census Bureau, American Community Survey 5-year estimates, Table: S1901; INCOME IN THE PAST 12 MONTHS 2023
19.
U.S. Census Bureau, American Community Survey 5-year estimates, Table: S2201; FOOD STAMPS / SUPPLEMENTAL NUTRITION ASSISTANCE PROGRAM (SNAP) 2023
20.
U.S. Census Bureau, American Community Survey 5-year estimates, Table: S1701; POVERTY STATUS IN THE PAST 12 MONTHS 2018-2023
21.
U.S. Census Bureau, American Community Survey 5-year estimates, Table: DP04; SELECTED HOUSING CHARACTERISTICS 2018-2023
22.
Zillow, Housing Data, 2015-2023
23.
U.S. Census Bureau, American Community Survey 5-year estimates, Table: S1101; HOUSEHOLDS AND FAMILIES, 2018-2023