Health Outcomes
Mesa County Public Health and our partners address health outcomes by understanding how outcomes and behaviors are shaped by underlying economic, educational, healthcare, environmental, and social conditions.
This section explores the end results of these conditions and behaviors by examining behavioral health status, disease, and mortality.
Many Mesa County youth and young adults experience intense mental health challenges, and these challenges are increasingly common among all Mesa County adults. These are manifested in increasing utilization of the emergency department for suicidal ideation and attempt and a high suicide death rate.
Mesa County has higher rates of some cancers than Colorado, and similar rates of most chronic and infectious diseases. A recent state-wide increase in syphilis is reflected in Mesa County’s rates.
Mesa County has higher mortality rates than the state. Many leading causes of death are preventable and influenced strongly by health behaviors.
Behavioral Health
Behavioral health impacts physical health in a cyclical way. Behavioral health is impacted by health behaviors, but it can also impact a person’s ability to pursue healthy choices. In addition, behavioral health challenges can lead to direct health outcomes such as substance use disorder and suicide crisis.
Young people in Mesa County reported more intense mental health challenges than adults. Teens expressed high levels of stress, and more than 4 in 10 reported intense mental health distress. Less than half as many adults reported the same.
Children and Teens
While most youth reported good mental health when asked about the most recent week, a notable number of high schoolers indicated periods of intense mental distress over the past year.
3rd-5th graders
- 51% indicated they felt sad some, most, or all days in the past week.
- 25% reported they felt afraid some, most, or all days in the past week.
- 33% reported feeling happy zero or only one day in the past week.
Source: DISTRICT 51 PANORAMA SURVEY, FALL 2023
6th-12th graders
- 48% indicated they felt sad sometimes, frequently, or almost always in the past week.
- 71% indicated they felt stressed out sometimes, frequently, or almost always in the past week.
- 32% reported feeling happy almost never or only once in a while in the past week.
Source: Panorama Data, Fall 2023, District 51, data request
STUDENTS WHO FELT SO SAD OR HOPELESS THEY STOPPED DOING USUAL ACTIVITIES ALMOST EVERY DAY FOR TWO WEEKS
STUDENTS WHO REPORTED HAVING ATTEMPTED SUICIDE IN THE PAST YEAR
Source: Colorado Department of Public Health and Environment, Healthy Kids Colorado Survey 2021
Adults
Around a quarter of the adult population in Mesa County has been diagnosed with a depressive disorder ever in their life. Nearly one in five adults indicated recent mental health distress.
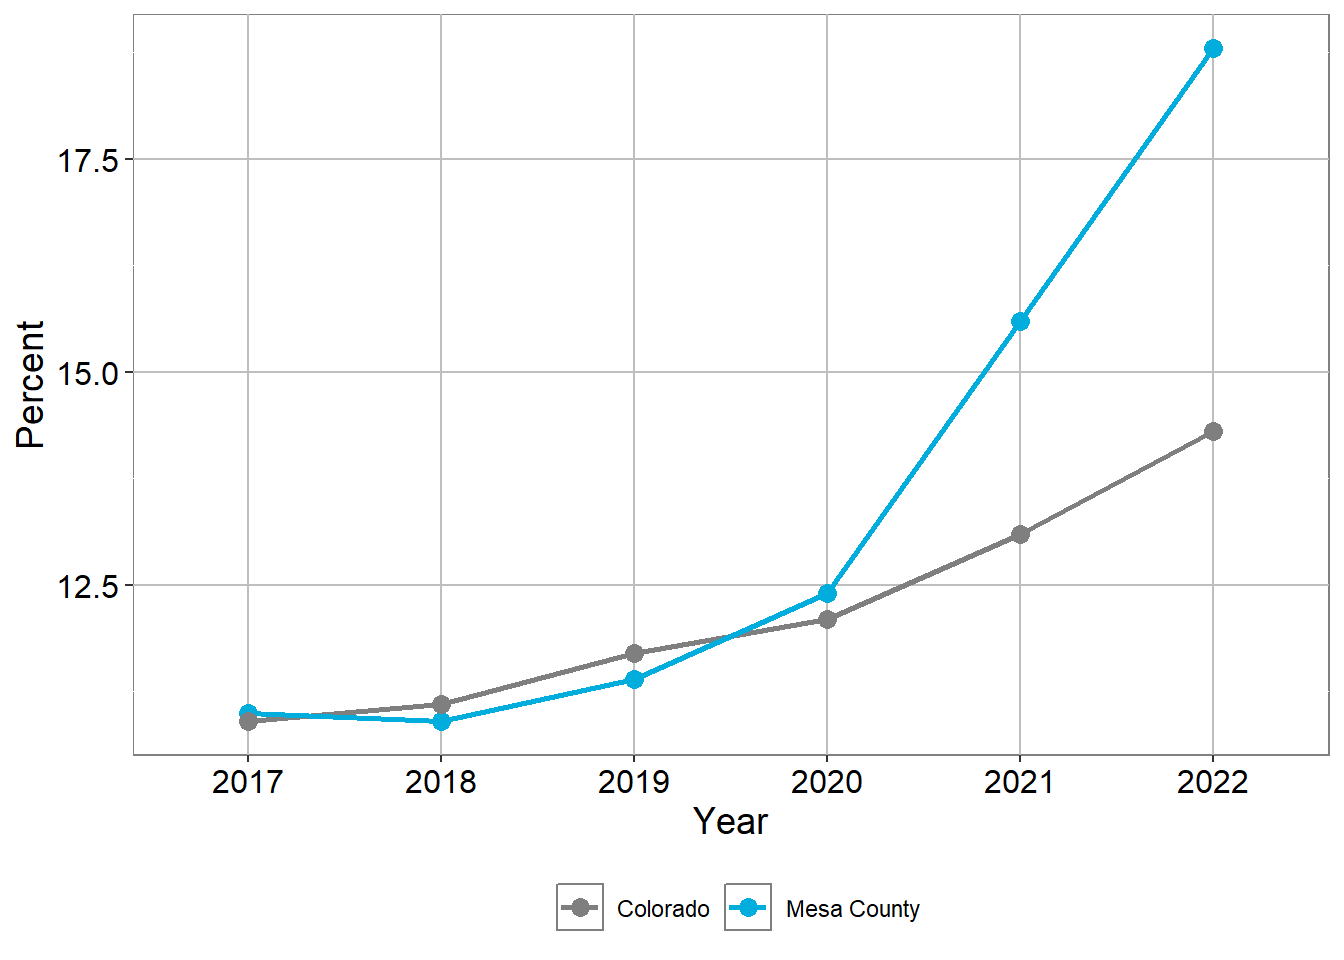
Prior to 2021, Mesa County and Colorado adults reported similar levels of persistent poor mental health. Starting in 2021, Mesa County’s rate increased more quickly than Colorado’s.
ADULTS EVER DIAGNOSED WITH A DEPRESSIVE DISORDER
ADULTS WHOSE MENTAL HEALTH WAS NOT GOOD 14+ DAYS IN THE LAST 30 DAYS
Source: Colorado Department of Public Health and Environment: Behavioral Risk Factor Surveillance System, 2020-2022
 Mental Distress
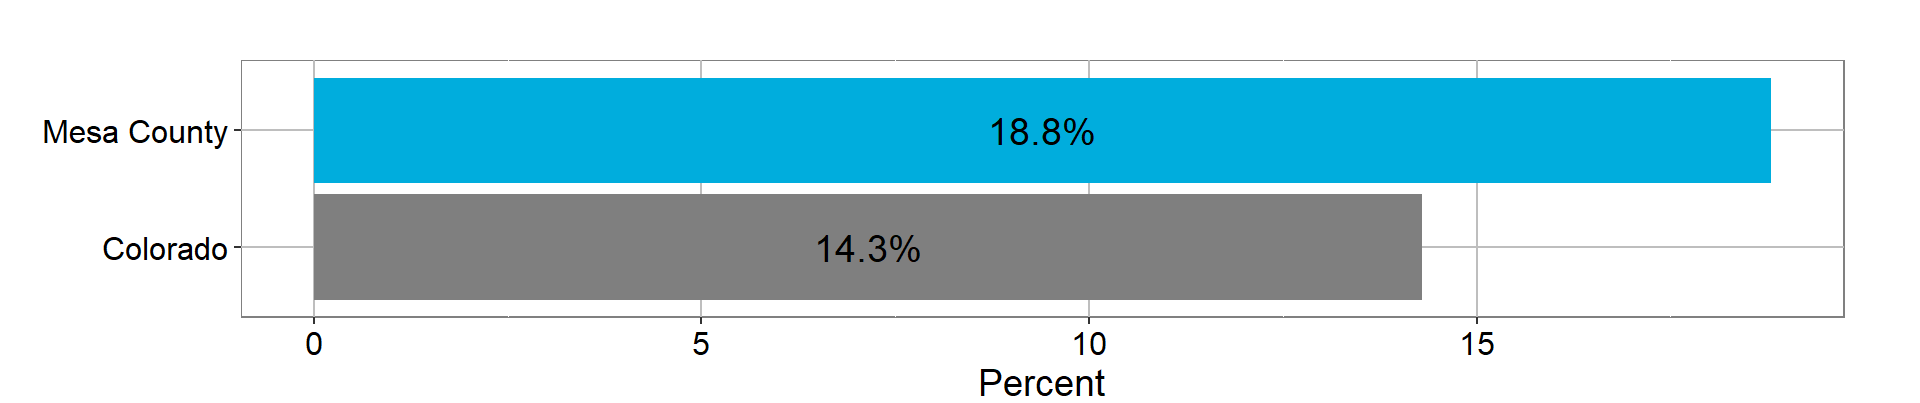
In 2022, 1.5 times more adults in Mesa County reported mental health distress than in 2020.
PREVALENCE OF ADULTS WHOSE MENTAL HEATHLY WAS NOT GOOD 14+ DAYS IN THE LAST 30 DAYS
Trailing 3-year average
PREVALENCE OF ADULTS WHOSE MENTAL HEATHLY WAS NOT GOOD 14+ DAYS IN THE LAST 30 DAYS
Trailing 3-year average
| Region | 2017 | 2018 | 2019 | 2020 | 2021 | 2022 |
|---|---|---|---|---|---|---|
| Mesa County | 11.0% | 10.9% | 11.4% | 12.4% | 15.6% | 18.8% |
| Colorado | 10.9% | 11.1% | 11.7% | 12.1% | 13.1% | 14.3% |
Source: Colorado Department of Public Health and Environment: Behavioral Risk Factor Surveillance System, 2020-2022
Suicide Ideations and Attempts
There are multiple interventions for people experiencing suicide ideation and attempt. Many, though not all, are treated in the emergency department. The trends shown here reflect not only patterns of suicidality, but also patterns of care-seeking behavior.
 More Info
Information about suicide death can be found in the Mortality Section on Suicide Deaths.
Suicide Report
More information on suicides in Mesa County can be found in the 2022 Annual Suicide report.
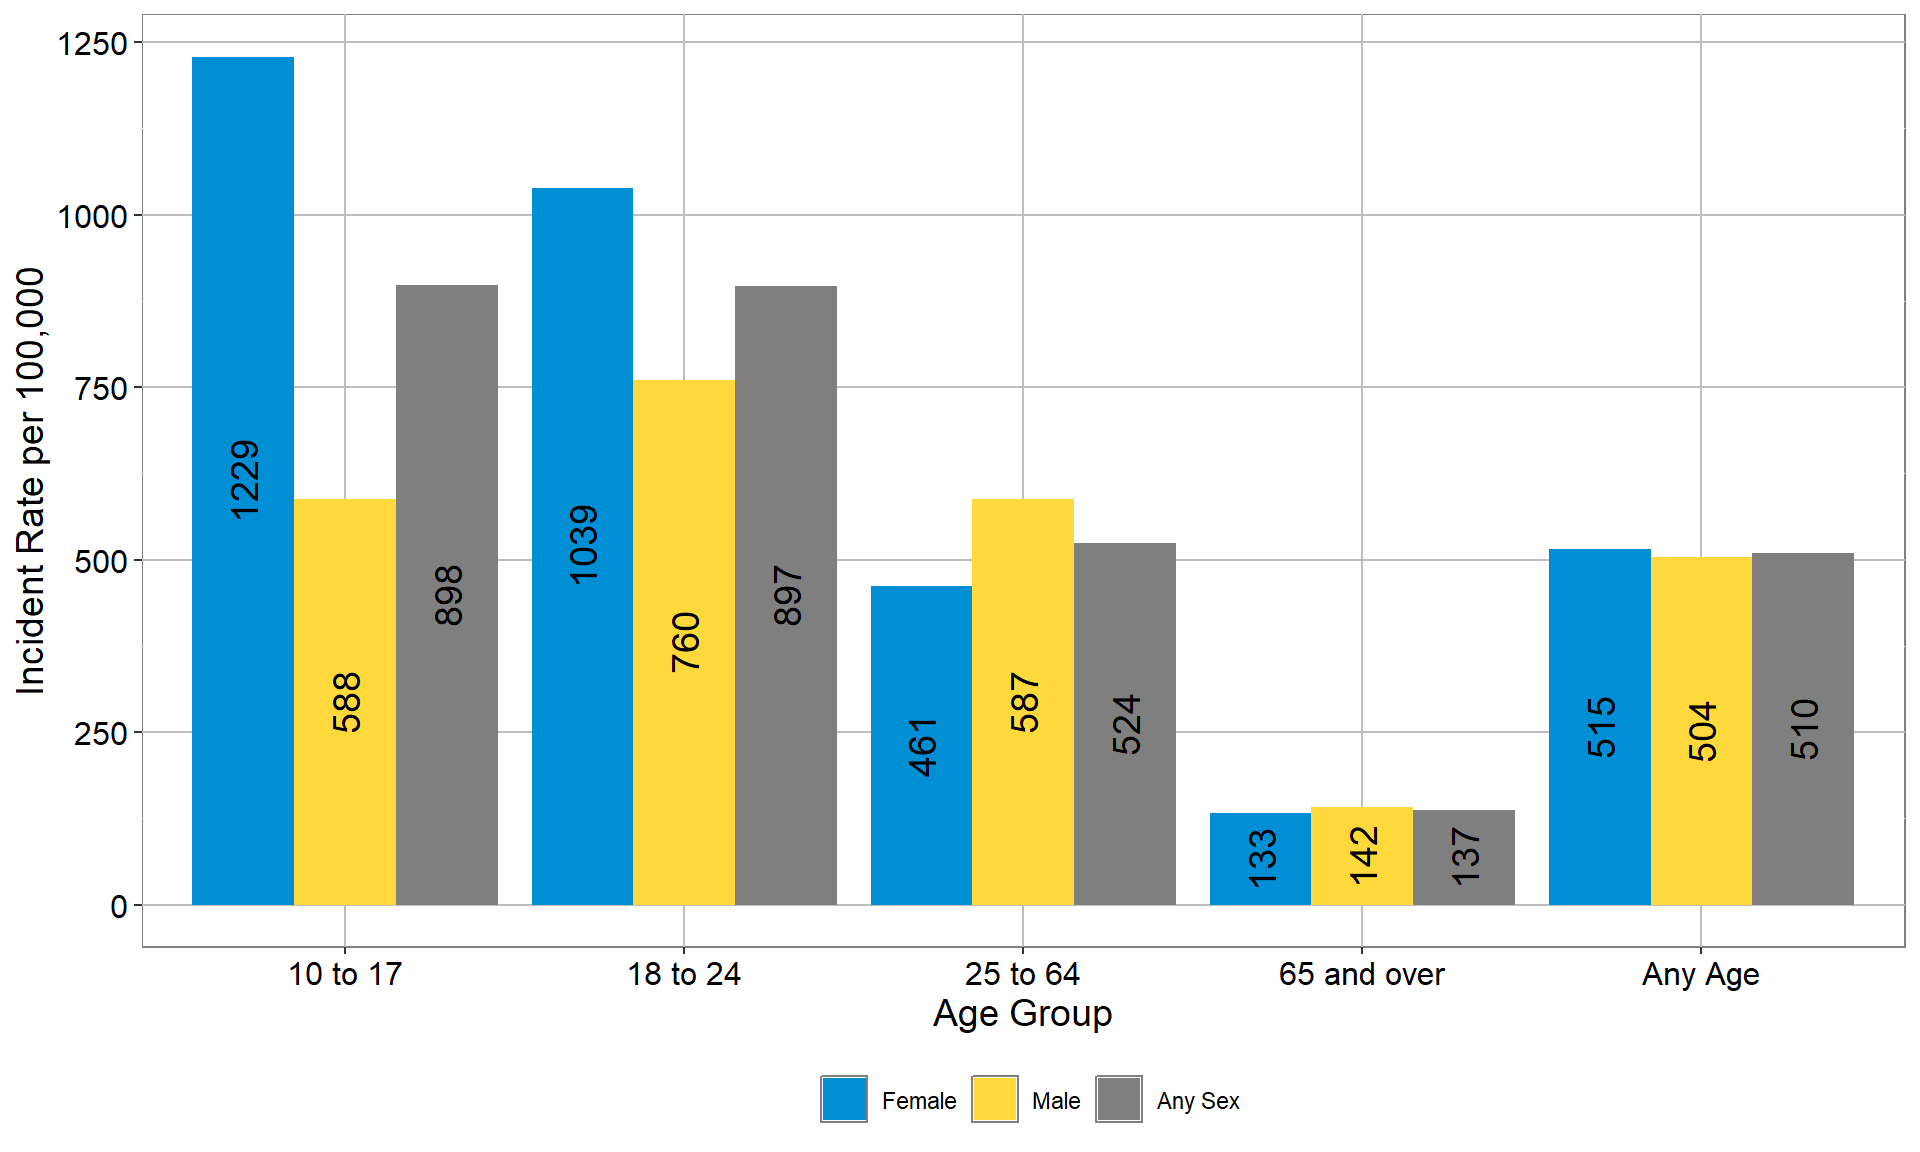
Rates of suicide death are much higher for men than women. However, in the youth and young adult age group, girls and young women had 1.5 times as many suicide-related emergency department visits than boys and young men. This difference evens out in working-age and older adults.
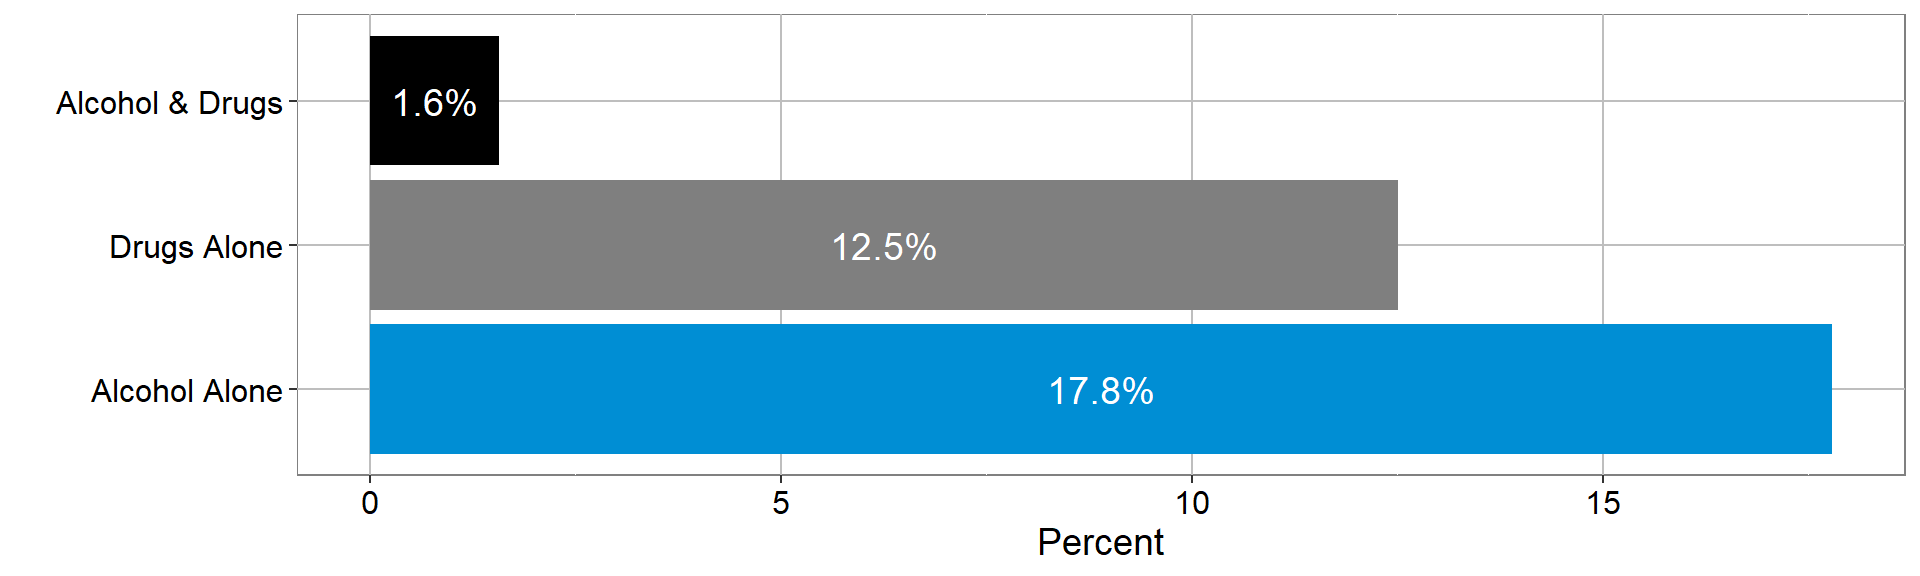
Between 2021 and 2023, more than 30% of visits to the emergency department for suicide ideation and attempt had indications that the patient had recently used drugs or alcohol.
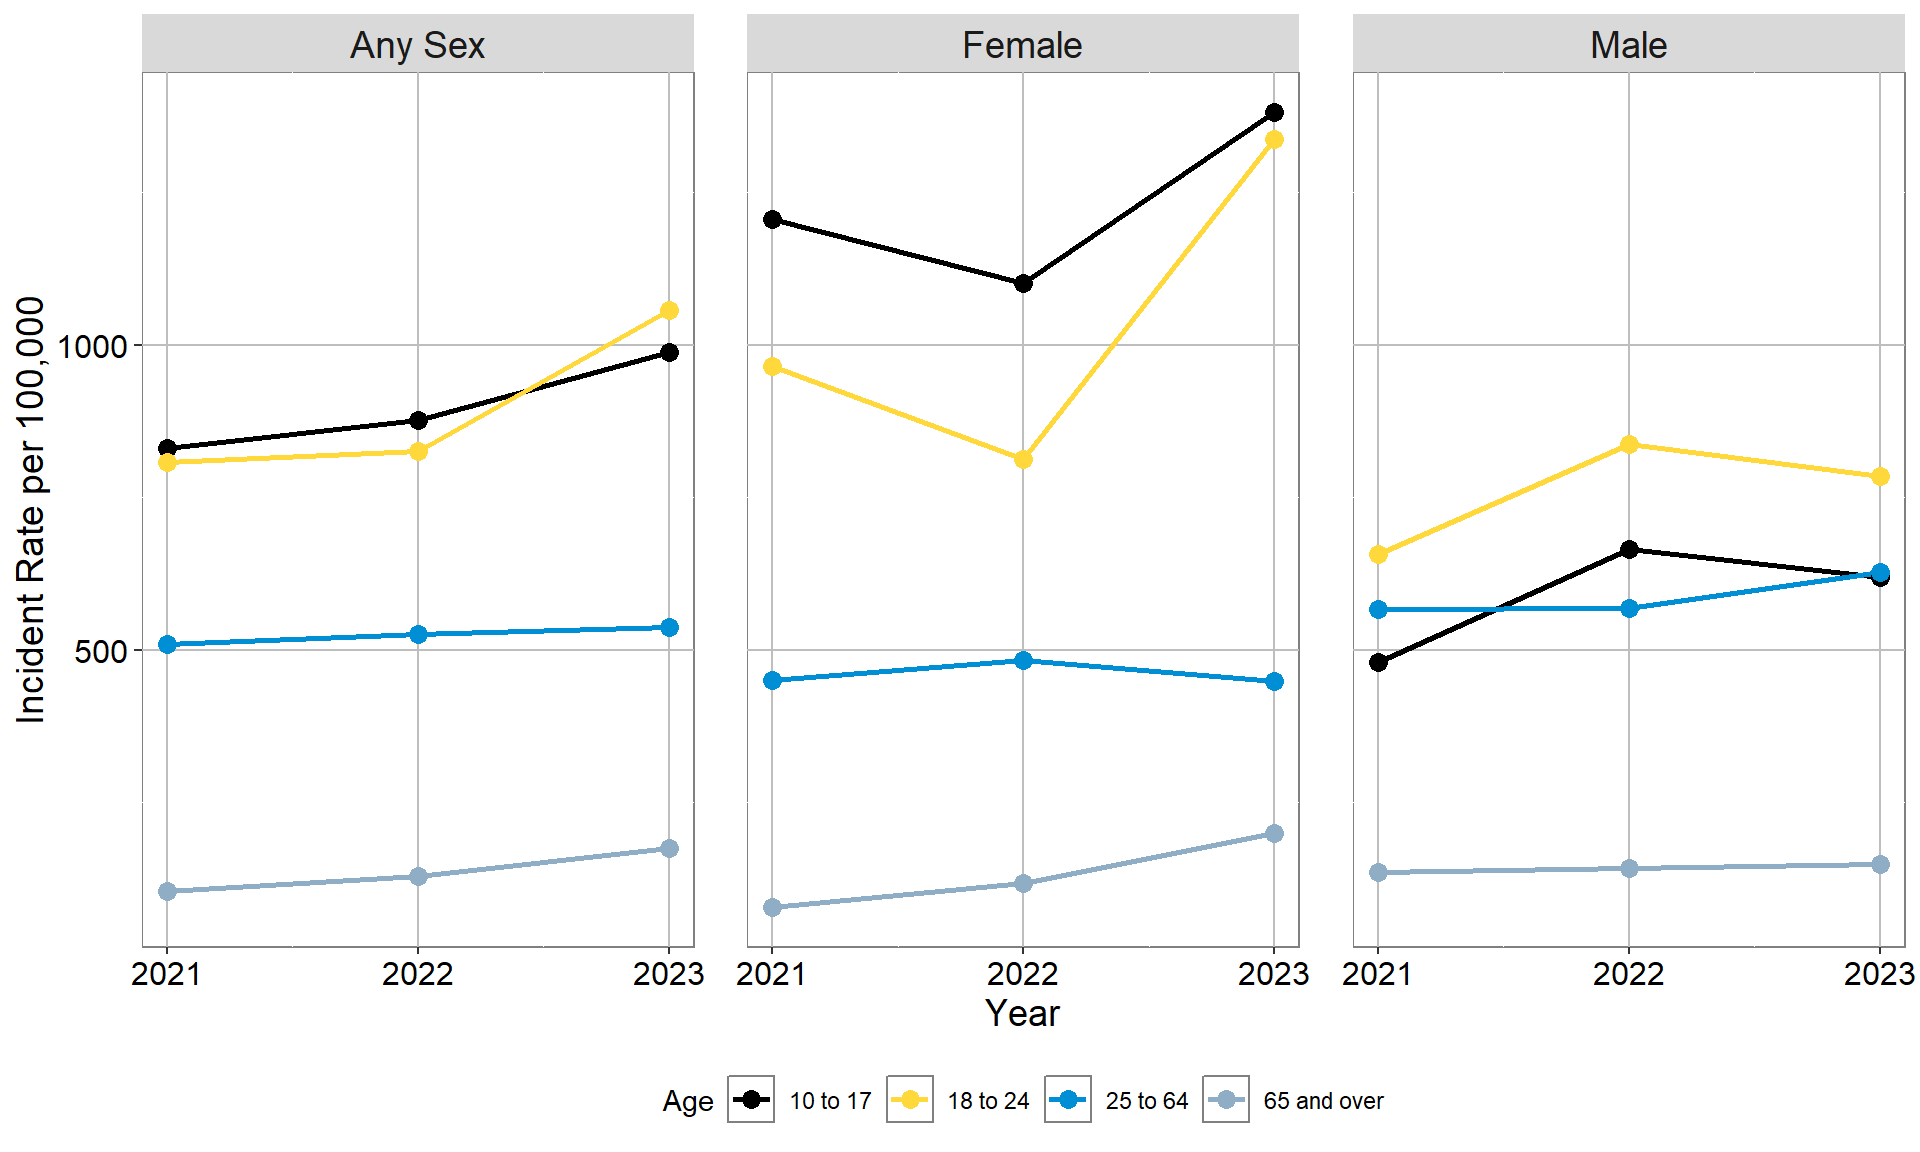
While young adults had the highest rate of suicide-related visits, over half of the visits came from working-age adults age 25 to 64. In this age group alone, men were slightly more likely to visit the emergency department than women. Adults age 65 and over had the lowest rates of visits. In older adults and young adults, the rate for women is climbing faster than the rates for men.
 Method
In the past, Mesa County has only counted suicide- related emergency department visits based on diagnosis codes.
Now, this count includes patients who did not have a suicide-related diagnosis code, but their provider indicated suicide attempt or ideation as a reason for their visit. Many more visits are included now, so data from previous suicide reports should be disregarded in favor of the data included here.
SUICIDE-RELATED EMERGENCY DEPARTMENT VISITS BY AGE GROUP, RATE PER 100,000 PEOPLE, MESA COUNTY (2021-2023)
SUICIDE-RELATED EMERGENCY DEPARTMENT VISITS BY AGE GROUP, RATE PER 100,000 PEOPLE, MESA COUNTY (2021-2023)
Rates of Emergency Department Visits per 100,000 residents per year by sex and age group classified as having a suicide ideation or attempt (2021-2023)
| 10 to 17 | 18 to 24 | 25 to 64 | 65 and over | All Ages | |
|---|---|---|---|---|---|
| Female | 1229.0 | 1039.0 | 461.0 | 133.0 | 514.9 |
| Male | 588.0 | 760.0 | 587.0 | 142.0 | 503.9 |
| Any Sex | 898.5 | 897.1 | 523.8 | 136.9 | 509.5 |
Rates of Emergency Department Visits per 100,000 residents for Suicide ideations and attempts by year, sex and age group, emergency department visits
| Year | Age | Female | Male | Any Sex |
|---|---|---|---|---|
| 2021 | 10 to 17 | 1,206 | 480 | 831 |
| 2021 | 18 to 24 | 966 | 656 | 808 |
| 2021 | 25 to 64 | 451 | 567 | 509 |
| 2021 | 65 and over | 78 | 135 | 104 |
| 2022 | 10 to 17 | 1,101 | 665 | 876 |
| 2022 | 18 to 24 | 813 | 838 | 826 |
| 2022 | 25 to 64 | 483 | 568 | 525 |
| 2022 | 65 and over | 117 | 141 | 128 |
| 2023 | 10 to 17 | 1,382 | 619 | 988 |
| 2023 | 18 to 24 | 1,337 | 785 | 1,057 |
| 2023 | 25 to 64 | 448 | 628 | 538 |
| 2023 | 65 and over | 199 | 148 | 175 |
Drug and Alcohol involvement with Ideations and Attempts
31% of emergency department visits for suicide ideation or attempt involved substance use.
Women were more likely to have used drugs before a suicide emergency, and men were more likely to have used alcohol.
SUICIDE-RELATED EMERGENCY DEPARTMENT VISITS FOR WITH ALCOHOL OR DRUG USE INDICATED (2021-2023)
SUICIDE-RELATED EMERGENCY DEPARTMENT VISITS FOR WITH ALCOHOL OR DRUG USE INDICATED (2021-2023)
| With Drugs | Without Drugs | Total | |
|---|---|---|---|
| With Alcohol | 7.3 | 82.3 | 89.7 |
| Without Alcohol | 57.9 | 315.1 | 373.0 |
| Total | 65.2 | 397.5 | 462.7 |
Alcohol and Drug Involement by Sex
Ideation and Attempt Rates per 100,000
Male residents for males with or without alcohol or drugs (2021-2023)
| With Drugs | Without Drugs | Total | |
|---|---|---|---|
| With Alcohol | 1.7 | 48.7 | 50.4 |
| Without Alcohol | 19.0 | 156.5 | 175.5 |
| Total | 20.7 | 205.2 | 225.9 |
Ideation and Attempt Rates per 100,000
Female residents for females with or without alcohol or drugs (2021-2023)
| With Drugs | Without Drugs | Total | |
|---|---|---|---|
| With Alcohol | 5.6 | 33.6 | 39.3 |
| Without Alcohol | 38.9 | 158.6 | 197.5 |
| Total | 44.5 | 192.3 | 236.8 |
PERCENT OF EMERGENCY DEPARTMENT IDEATION AND ATTEMPT VISITS WITH ALCOHOL AND DRUG INVOLEMENT WITHIN SEX
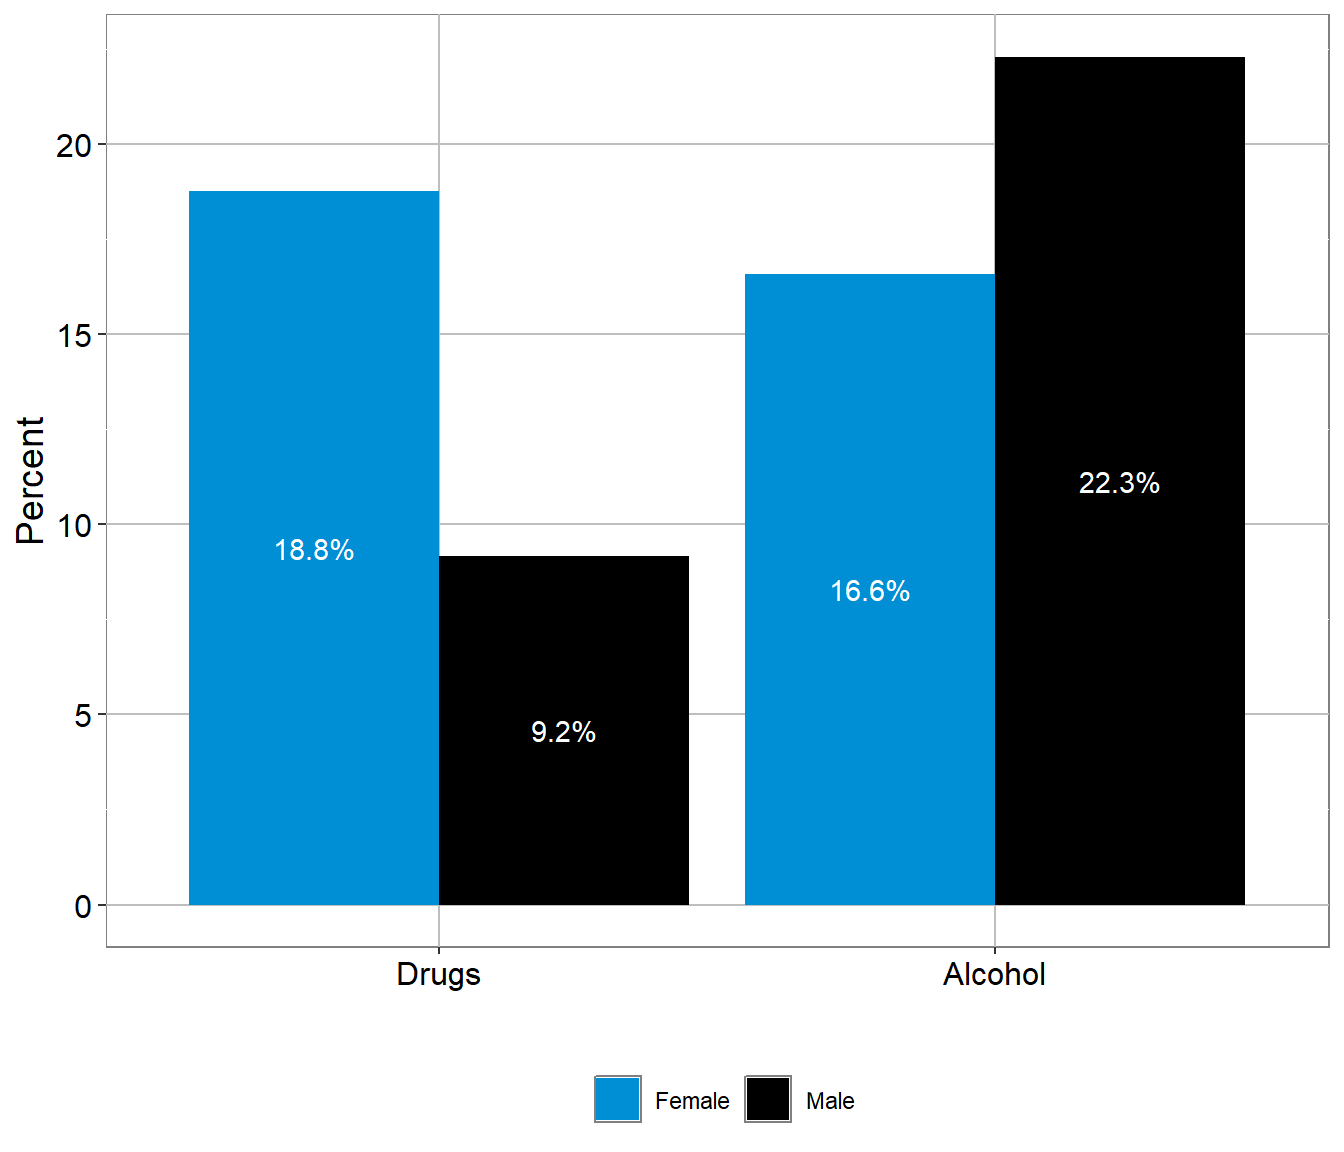
At the ER

18.8% of women and 9.1% of men had drug involvement in their suicide-related emergency department visit.
22.3% of men and 16.6% of women had alcohol involvement in their suicide-related emergency department visit.
Source: National Syndromic Surveillance Program
Overdose
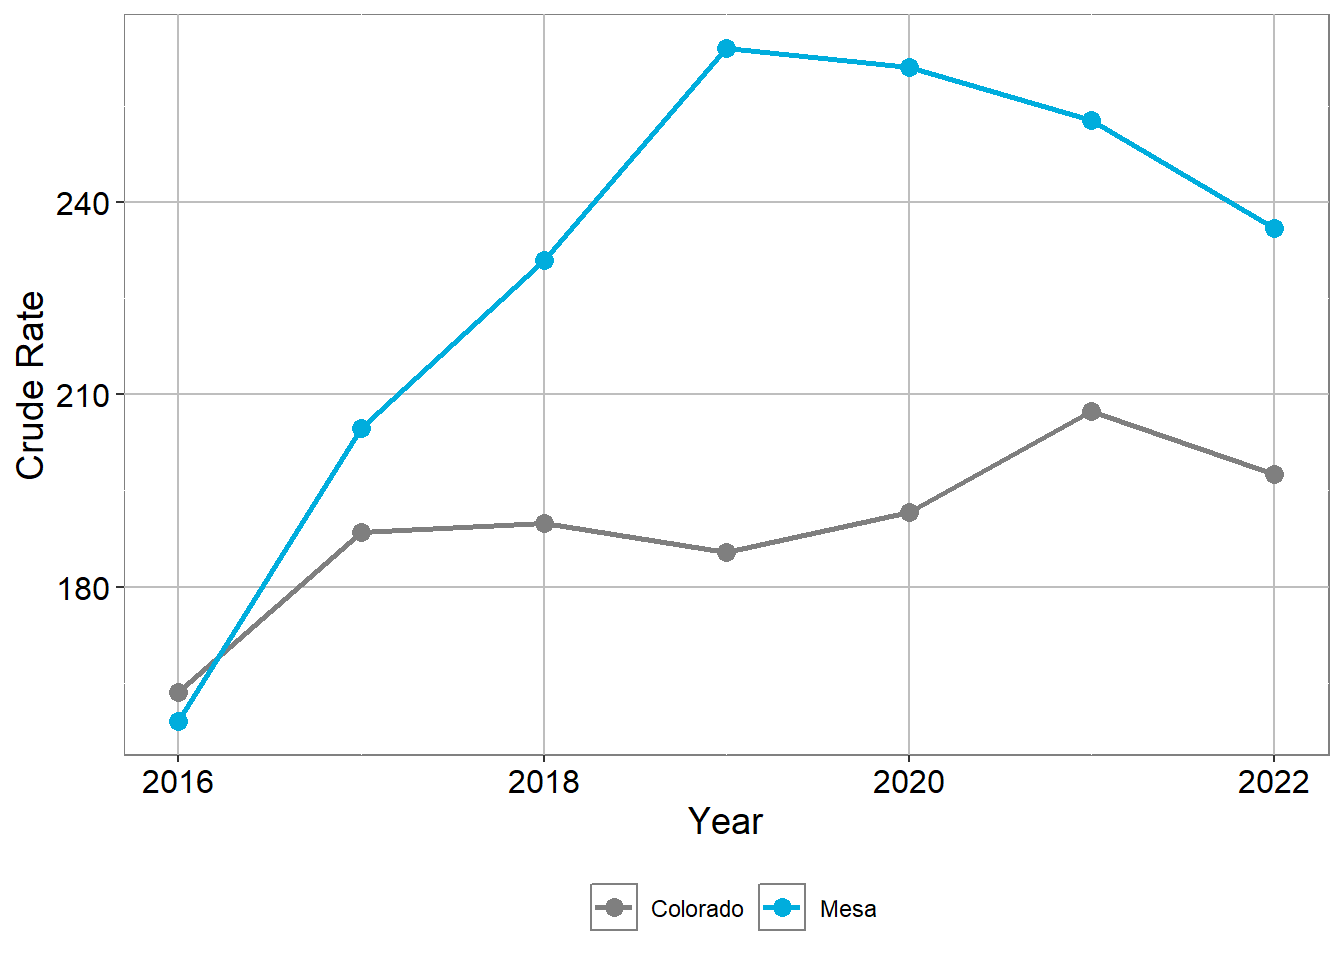
Between 2020 and 2022, Mesa County had a higher rate of overdose emergency department visits and hospital admissions than Colorado for most substances. One exception was opioid overdose, which had similar rates.
Naloxone
Naloxone is an effective treatment for overdose. Individuals given naloxone should be taken to the emergency department as part of their treatment.
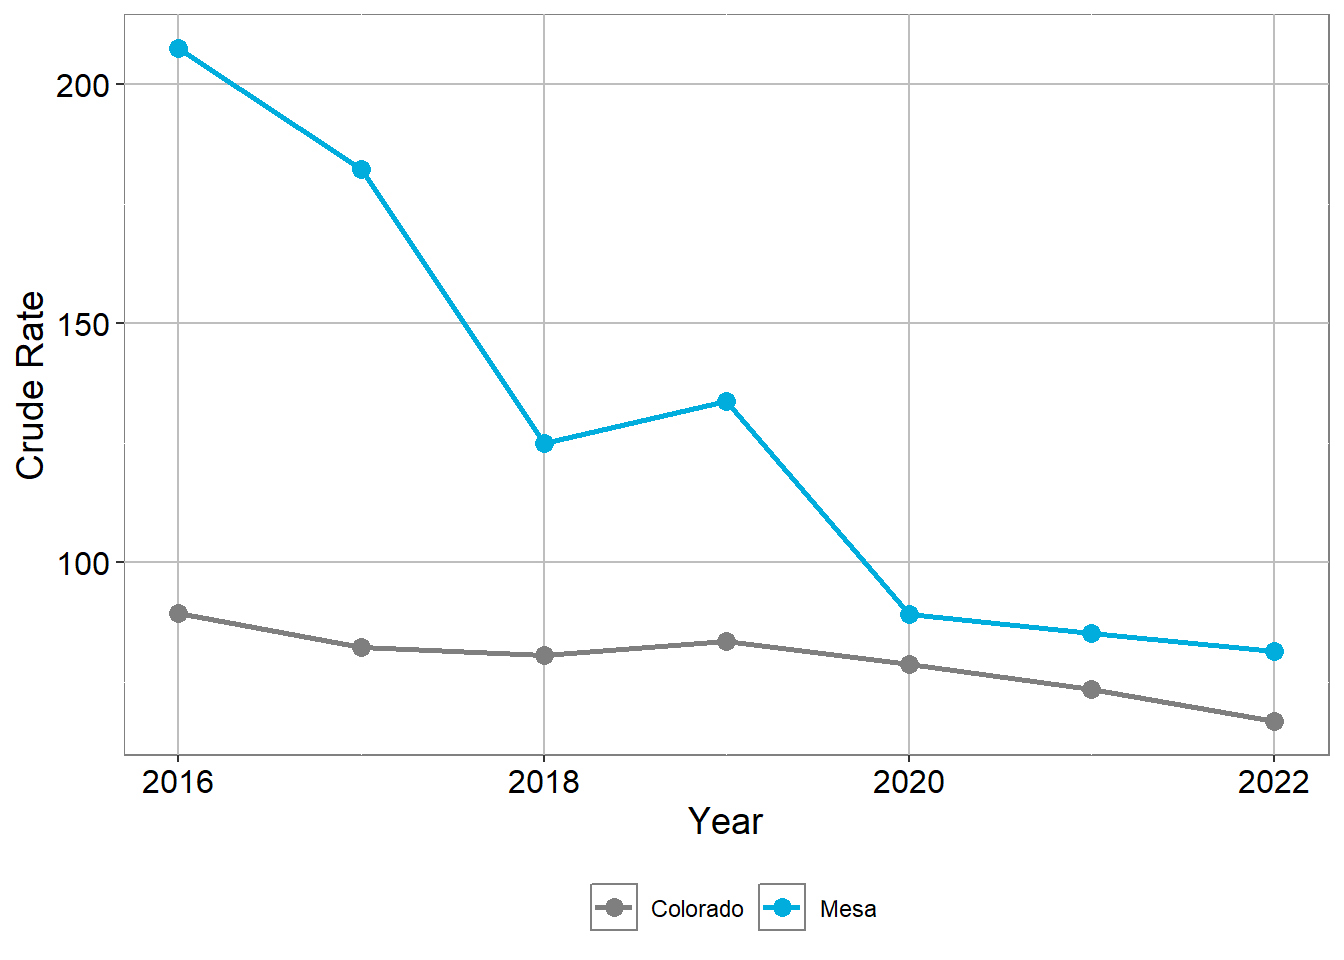
From 2019 to 2022, both emergency department visits and hospital admissions for overdose decreased. This could indicate fewer overdoses, or an increased use of naloxone without an emergency department visit. These trends look different than Colorado, which stayed consistent over these years.
For information about overdose deaths, see the Mortatily Overdose Deaths section.
Age adjusted rate of overdose per 100,000, ED visits & hospitalizations (2020-2022)
| Region | Emergency Department | Hospital Admission | Emergency Department | Hospital Admission | Emergency Department | Hospital Admission |
|---|---|---|---|---|---|---|
| Mesa.County | 268.9 | 85.7 | 38.2 | 13.0 | 11.1 | 8.2 |
| Colorado | 205.1 | 71.5 | 42.2 | 14.7 | 4.5 | 4.4 |
Data Note: hospital admissions and emergency department visits are mutually exclusive.
Emergency Room Visits for Overdose
Crude Rate per 100,000 Residents
Emergency Room Visits for Overdose
Crude Rate per 100,000 Residents
| Region | 2016 | 2017 | 2018 | 2019 | 2020 | 2021 | 2022 |
|---|---|---|---|---|---|---|---|
| Mesa | 159.0 | 204.7 | 230.9 | 264.0 | 261.0 | 252.8 | 235.9 |
| Colorado | 163.6 | 188.5 | 189.9 | 185.4 | 191.7 | 207.3 | 197.5 |
Source: CDPHE Overdose Dashboard
HOSPITAL ADMISSIONS FOR OVERDOSE
Crude Rate per 100,000 Residents
HOSPITAL ADMISSIONS FOR OVERDOSE
Crude Rate per 100,000 Residents
| Region | 2016 | 2017 | 2018 | 2019 | 2020 | 2021 | 2022 |
|---|---|---|---|---|---|---|---|
| Mesa | 207.6 | 182.3 | 124.9 | 133.6 | 89.1 | 85.1 | 81.4 |
| Colorado | 89.3 | 82.2 | 80.5 | 83.5 | 78.6 | 73.4 | 66.7 |
Source: CDPHE Overdose Dashboard
Disease
Cancer Incidence
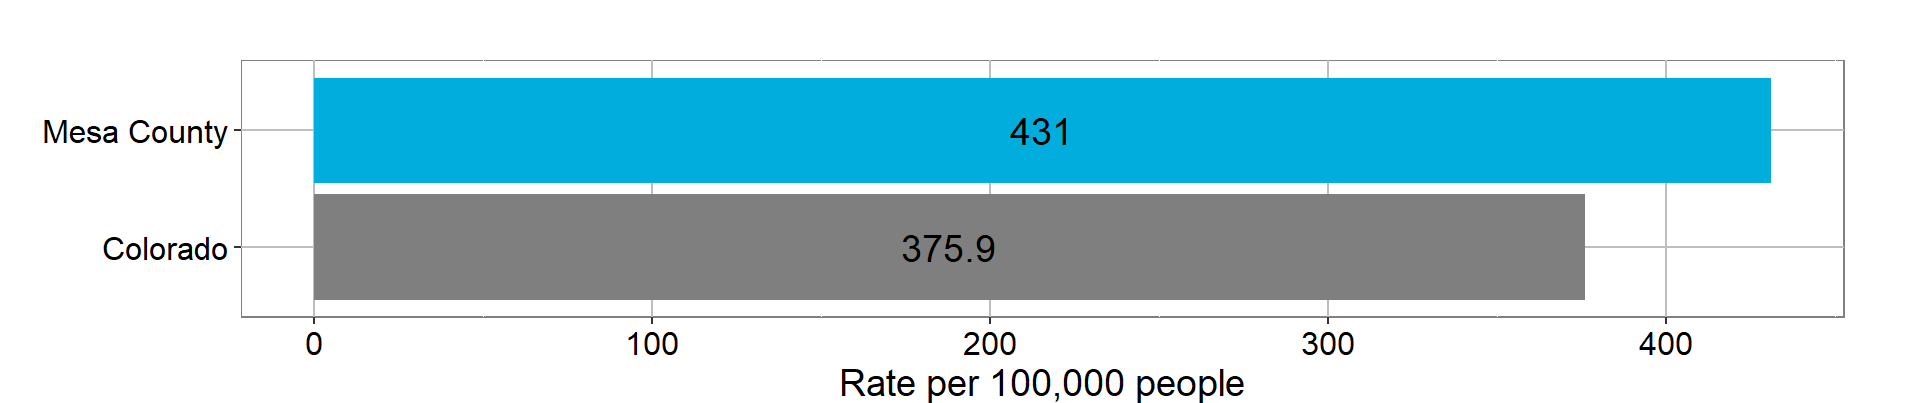
The most recent data available on rates of cancer in Colorado residents is from 2021. The overall rate of cancer in Mesa County did not notably change from 2018 to 2021. In 2018, the rate was 411.6 per 100,000 people compared with 431.0 in 2021.
This difference is within the normal expected variation for Mesa County. The top four sites where cancer was diagnosed remain the same, and together these four sites account for more than half of Mesa County’s total cancer incidence.
Mesa County’s overall cancer rate is higher than Colorado’s, largely driven by higher rates of prostate cancer in males and melanoma of the skin.
CANCER INCIDENCE RATE PER 100,000 PEOPLE, ALL TYPES (2021)
Source: Colorado Health Information Dataset
Age adjusted rates for the top 10 Cancer site for Mesa County compared with Colorado (2021)
| Cancer Site | Mesa County | Colorado |
|---|---|---|
| All Sites | 431.0 | 375.9 |
| Breast (female) | 121.3 | 133.5 |
| Prostate (male) | 105.5 | 86.8 |
| Melanoma of the Skin | 41.9 | 21.5 |
| Lung and Bronchus | 40.0 | 33.0 |
| Corpus Uterus & Uterus, NOS | 29.0 | 22.5 |
| Colon and Rectum | 24.2 | 31.1 |
| Urinary Bladder | 21.7 | 15.0 |
| Oral Cavity and Pharynx | 15.3 | 9.9 |
| Thyroid | 15.1 | 13.0 |
| Non-Hodgkin Lymphoma | 14.2 | 15.4 |
Breast (female) and Prostate (male) cancers rates are calculated within their sub-populations.
Source: Colorado Health Information Dataset, Data Request
Chronic Disease
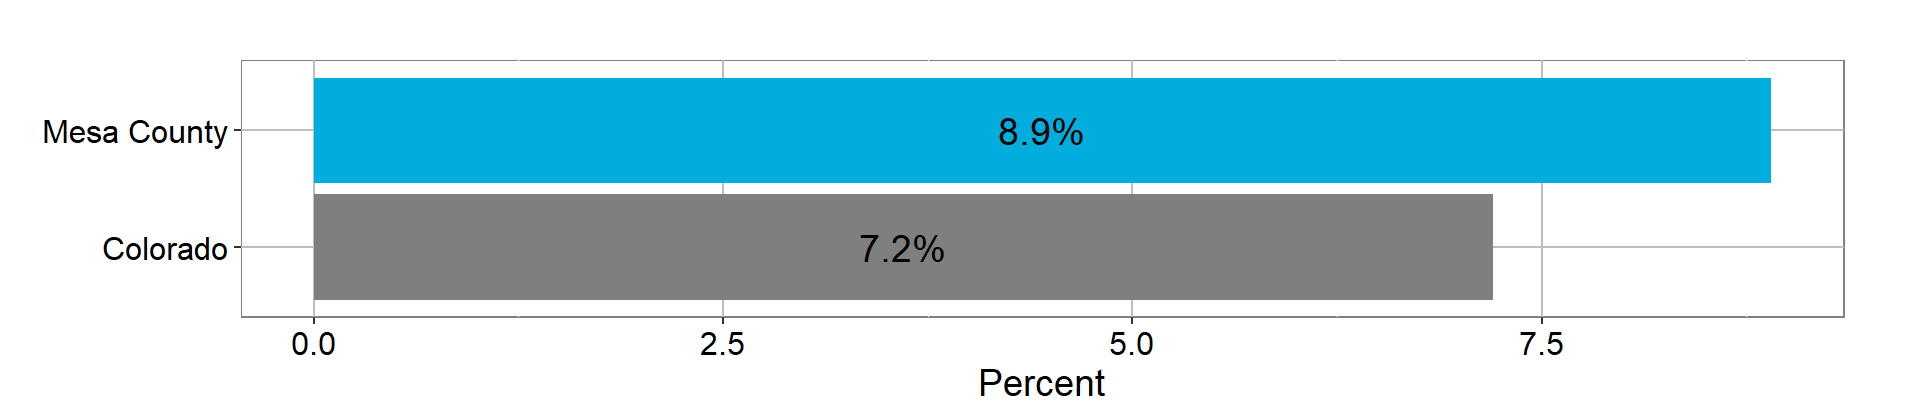
Chronic diseases can affect an individual’s quality of life and often contribute to a person’s eventual cause of death. Mesa County residents report chronic disease rates similar to those across the state of Colorado. The exception is arthritis, which is reported at 28.6% in Mesa County compared to 22.8% in Colorado.
Percent of residents with a chronic disease diagnosis (2020-2022)
| Chronic Disease | Mesa County | Colorado |
|---|---|---|
| Heart Disease | 3.7% | 2.7% |
| Diabetes | 9.0% | 7.6% |
| Arthritis | 28.6% | 22.8% |
| Stroke | 2.4% | 2.3% |
| Lost 6 or more teeth due to decay or periodontal disease | 10.2% | 9.4% |
| Asthma current adults | 12.7% | 10.3% |
| Asthma ever adults | 16.8% | 15.2% |
| Asthma ever high school students | 19.4% | 18.1% |
Sources: Colorado Department of Public Health and Environment: Behavioral Risk Factor Surveillance System, 2020-2022
Colorado Department of Public Health and Environment, Healthy Kids Colorado Survey 2021
Infectious Disease
The Mesa County rates for many reportable infectious diseases are similar to Colorado rates.
The differing rates of campylobacteriosis are likely attributable to different practices in testing. The difference in rates of animal bites are likely attributable to differences in seeking care and reporting.
For these diseases with very low rates, the differences are likely a result of normal variation:
- Salmonellosis,
- Shiga toxin-producing E. coli (STEC), and
- Strep pneumo invasive.
Variation from year to year is common because one additional or one fewer case can notably change the rate.
Other differences, such as the higher rate of chronic Hepatitis C, likely do reflect a higher incidence in Mesa County.
Incidence rate of diagnosed reportable diseases per 100,000 people
| Disease | Mesa Incidence | Colorado Incidence |
|---|---|---|
| Animal Bites | 18.0 | 74.6 |
| Campylobacteriosis | 42.0 | 29.2 |
| Carbapenem-Resistant Pseudomonas Aeruginosa | 16.0 | 12.3 |
| Hepatitis B, Chronic | 13.2 | 12.8 |
| Hepatitis C, Chronic | 46.0 | 32.5 |
| Influenza, Hospitalized | 30.8 | 35.7 |
| Salmonellosis | 11.0 | 15.6 |
| STEC (Shiga Toxin Producing E. coli) | 8.2 | 10.9 |
| Strep Pneumo Invasive | 9.0 | 15.6 |
Source: Colorado Electronic Disease Reporting System (CEDRS) Data Request
Sexually Transmitted Infections
More Info
For more information, contact your provider or the MCPH Public Health Clinic.
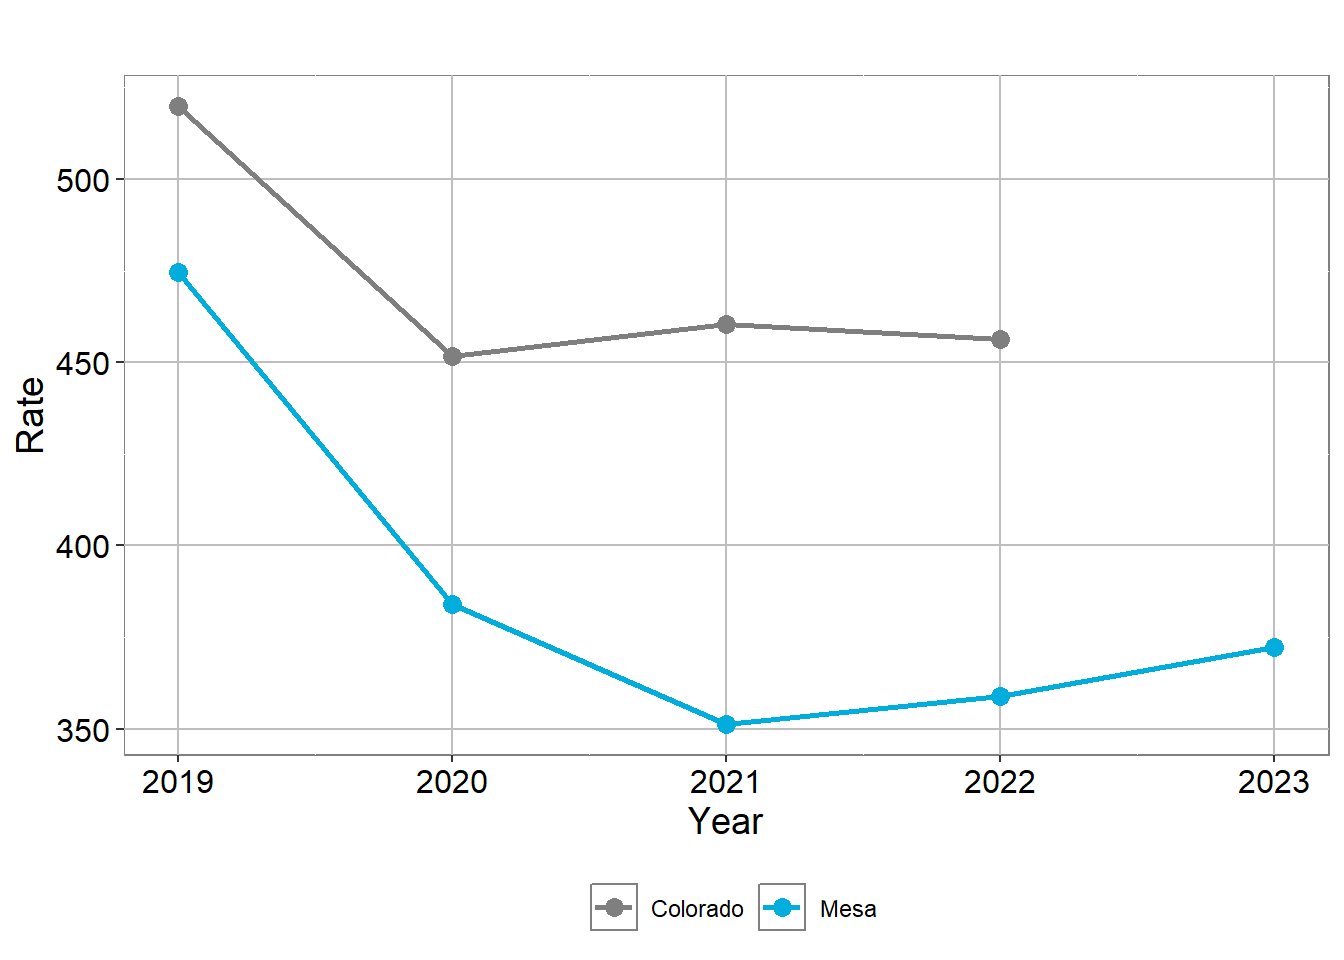
Overall, Mesa County has lower rates of STIs compared to the rest of the state. However, this may be a result of less frequent testing.
The most frequently diagnosed STI in Mesa County is chlamydia. Cases of chlamydia have been steadily increasing in Mesa County since 2021.
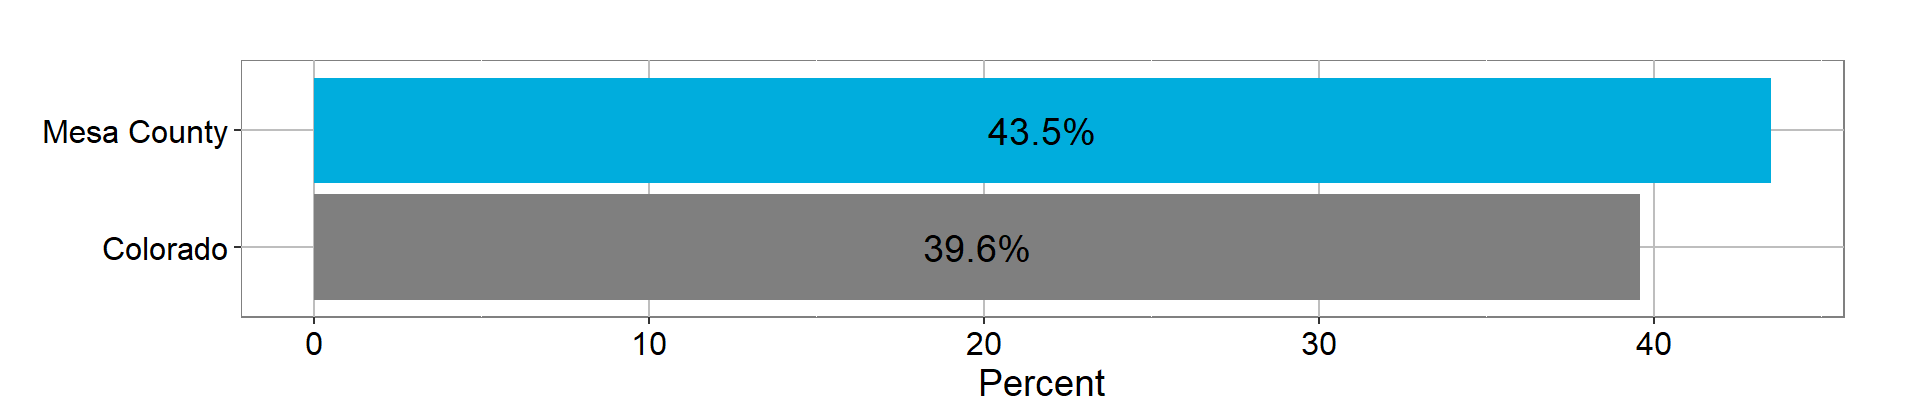
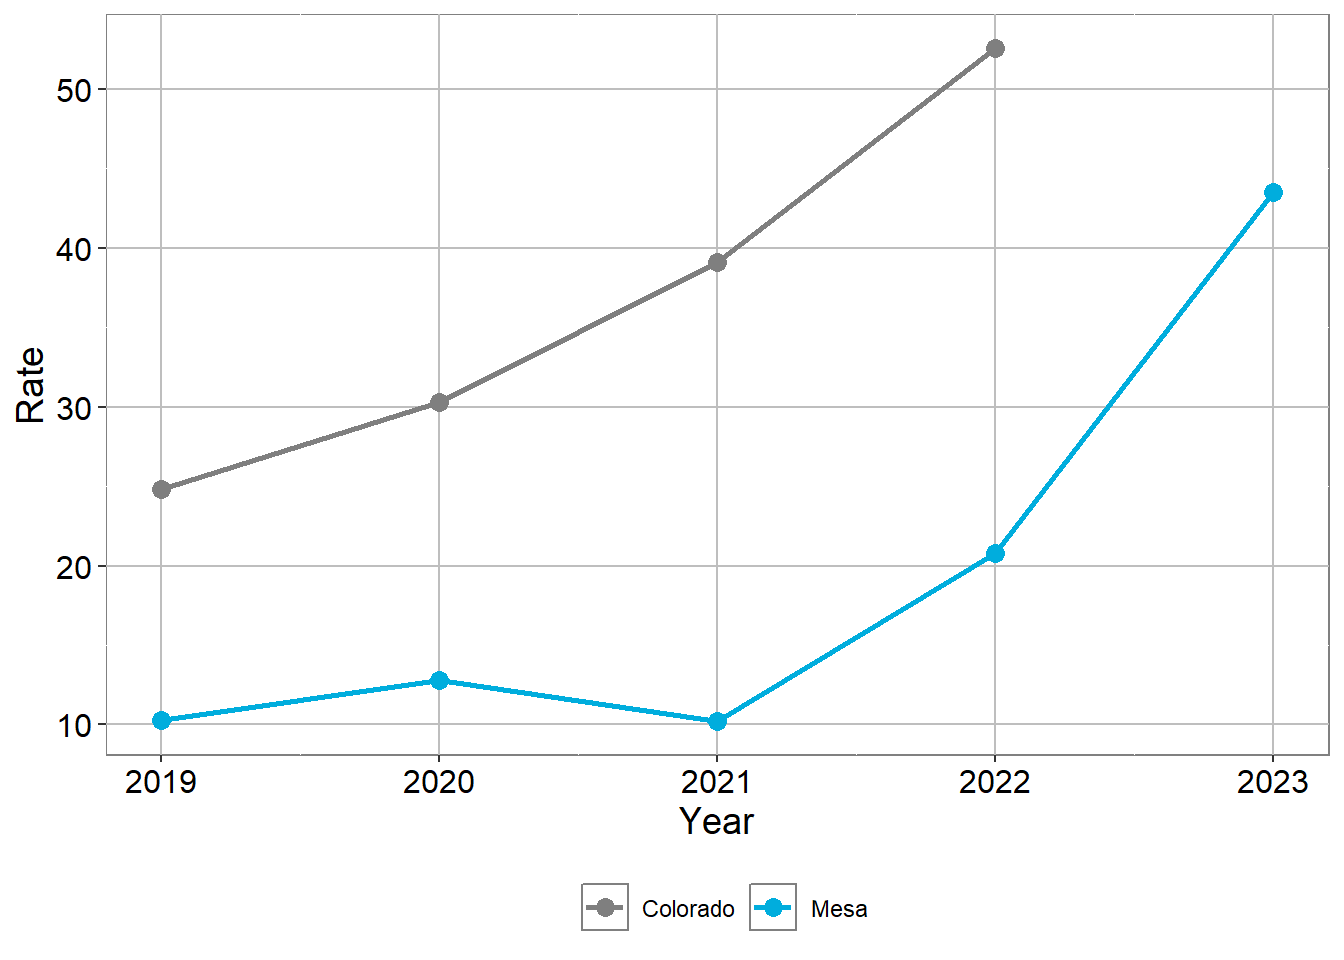
The rate of syphilis cases in Mesa County is also increasing. The 2023 rate of syphilis cases was four times higher than the 2021 rate. The rate went from 10.2 per 100,000 people in 2021 to 42.5 in 2023.
Cases of syphilis are also increasing across the country. In response to elevated syphilis rates, the Colorado Department of Public Health and Environment has recommended increased testing.
Crude Rates for Sexually Transmitted Infections
CHLAMYDIA CRUDE RATES
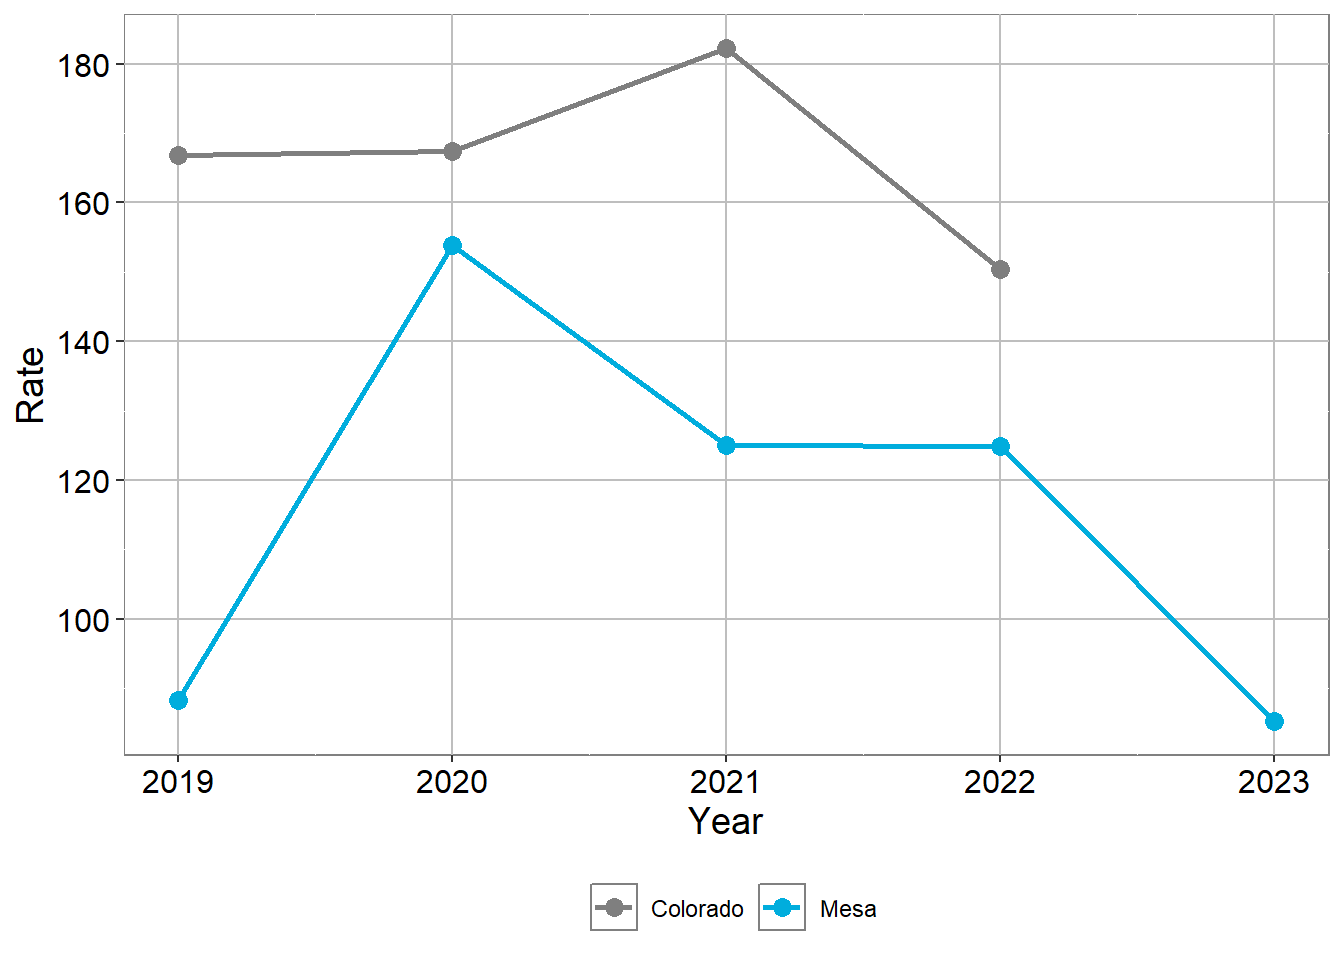
GONORRHEA CRUDE RATES
SYPHILIS CRUDE RATES
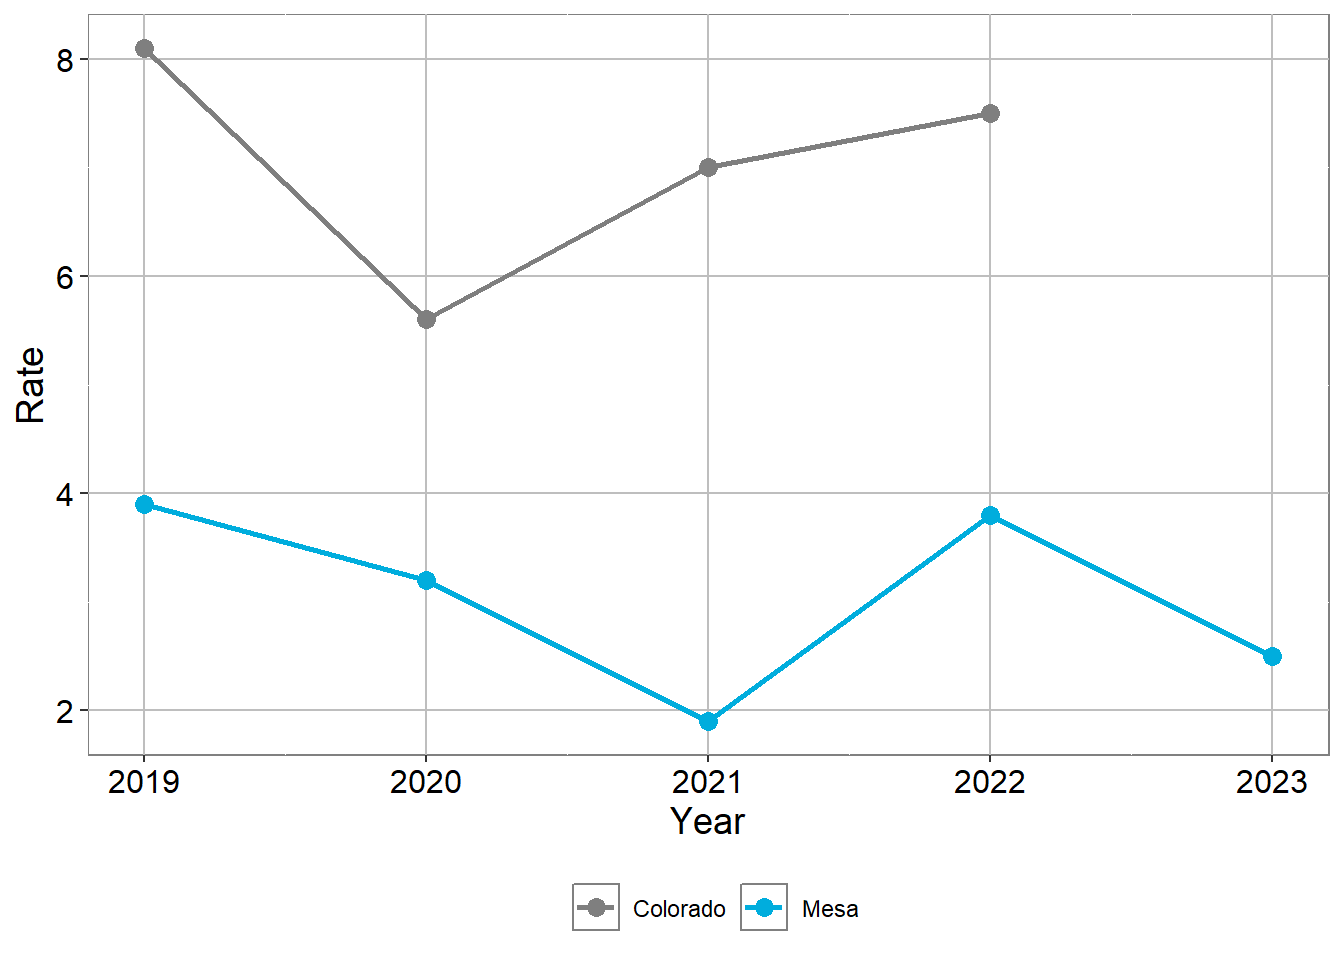
HIV CRUDE RATES
Count and age adjusted rates of sexually transmitted infections per 100,000 people in Mesa County and Colorado (2022)
| Sexually Transmitted Infection | Mesa County Count | Mesa County Rate | Colorado Count | Colorado Rate |
|---|---|---|---|---|
| Chlamydia | 569 | 377.0 | 26649 | 488.9 |
| Gonorrhea | 198 | 134.4 | 8784 | 159.8 |
| Syphilis | 33 | 22.6 | 3069 | 54.9 |
| HIV | 6 | 3.9 | 436 | 7.8 |
Source: CDPHE Colorado Electronic Disease Reporting System
Chlamydia Crude Rates
| Region | 2019 | 2020 | 2021 | 2022 | 2023 |
|---|---|---|---|---|---|
| Colorado | 520.0 | 451.8 | 460.3 | 456.4 | NA |
| Mesa | 474.5 | 384.0 | 351.3 | 358.9 | 372.2 |
Gonorrhea Crude Rates
| Region | 2019 | 2020 | 2021 | 2022 | 2023 |
|---|---|---|---|---|---|
| Colorado | 166.9 | 167.4 | 182.3 | 150.4 | NA |
| Mesa | 88.3 | 153.9 | 125.1 | 124.9 | 85.2 |
Syphilis Crude Rates
| Region | 2019 | 2020 | 2021 | 2022 | 2023 |
|---|---|---|---|---|---|
| Colorado | 24.8 | 30.3 | 39.1 | 52.6 | NA |
| Mesa | 10.3 | 12.8 | 10.2 | 20.8 | 43.5 |
HIV Crude Rates
| Region | 2019 | 2020 | 2021 | 2022 | 2023 |
|---|---|---|---|---|---|
| Colorado | 8.1 | 5.6 | 7.0 | 7.5 | NA |
| Mesa | 3.9 | 3.2 | 1.9 | 3.8 | 2.5 |
Source: Colorado Department of Public Health - Data Request
Mortality
Overall causes of death and years of potential life lost are two tools that give us different views of mortality in Mesa County. Cause of death reports the most frequent causes of death across the whole community, regardless of the age at which a person died. Years of potential life lost highlights causes of death that occur most often among young people.
Mesa County has higher mortality rates than the state, and many leading causes of death are preventable and influenced strongly by health behaviors.
Rates of suicide death, death by firearm, and accidental death are higher in Mesa County than the state and nation, while rates of overdose death are lower.
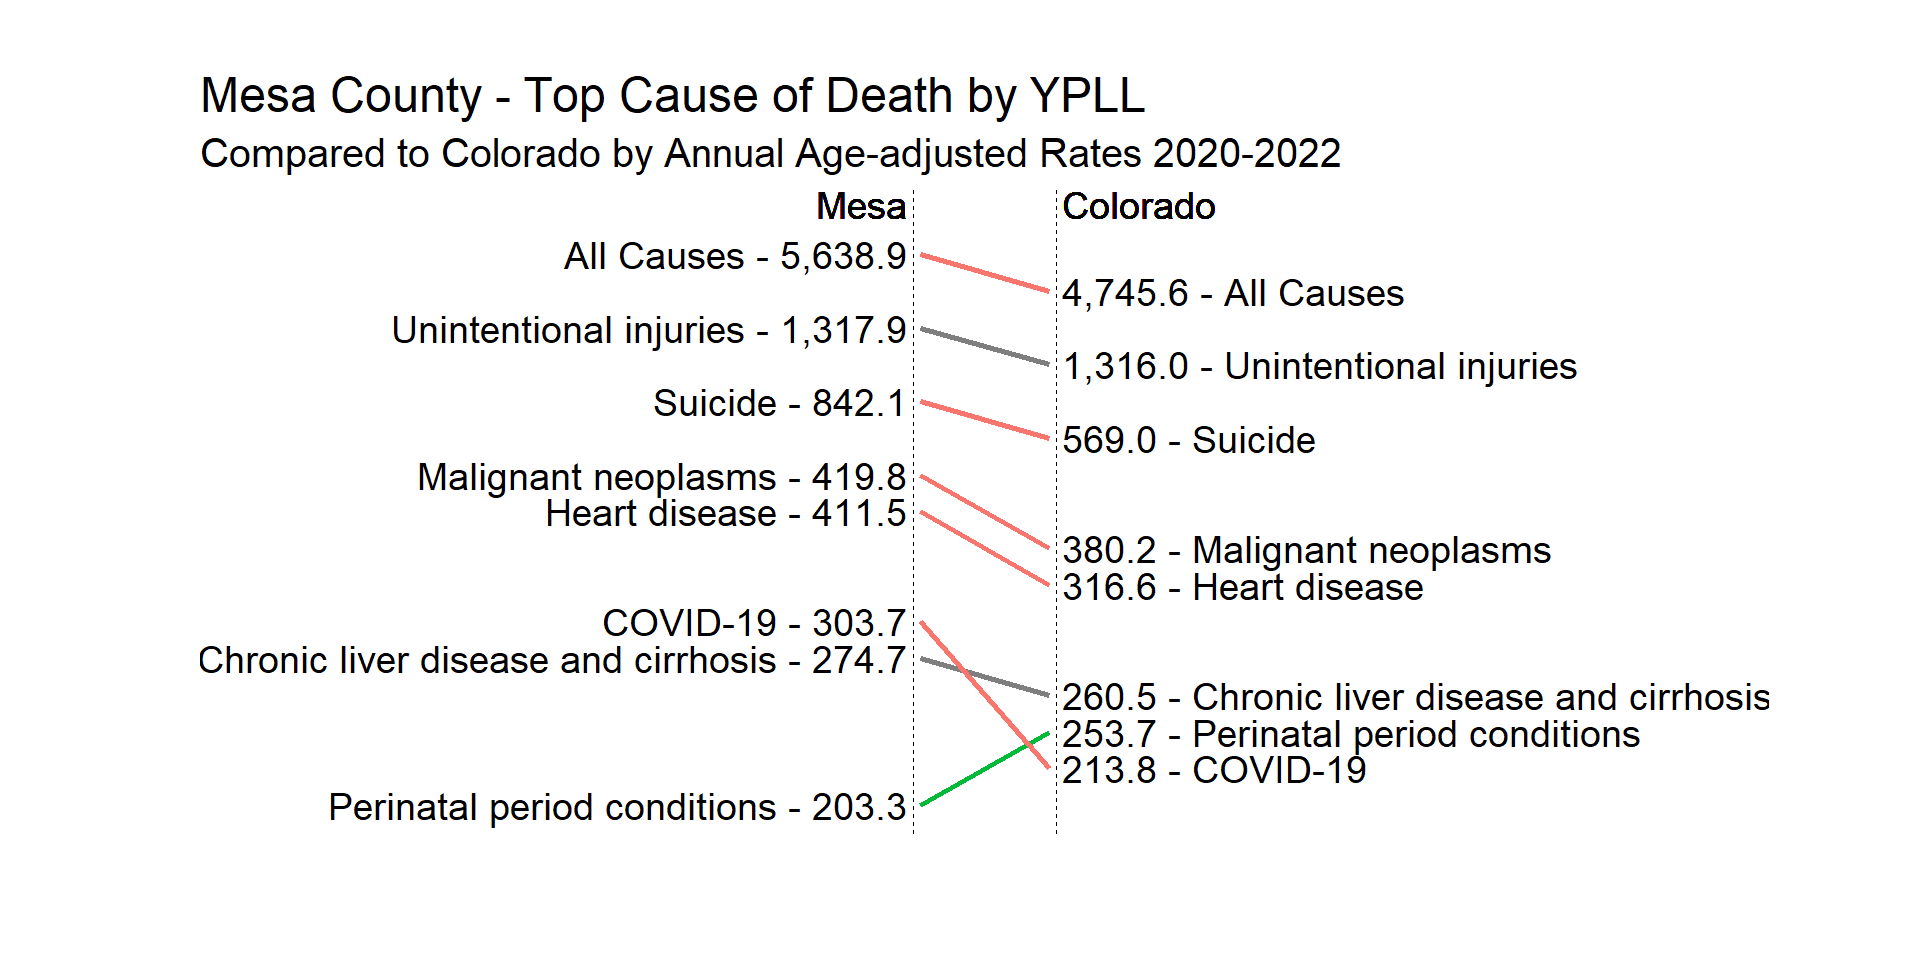
Years of Potential Life Lost
Years of potential life lost (YPLL) focuses on causes of death for the population under age 65. YPLL weights each cause of death by the age of the person at their death. A death of a very young person increases the rate more than the death of an older person, since the younger person had more years of potential life left.
YPLL helps illuminate the causes of death of youth and working age adults.
Source: Colorado Vital Records - Data Request
YPLL Rates
YPLL rates are given in years of lost life per 100,000 age-adjusted years.
Age-adjusted rates allow regions with different age populations to be compared.
Top YPLL causes of death in Mesa County (2020-2022)
| Cause | Crude Incident Rates (per 100,000 per year) |
|---|---|
| All Causes | 5482.87 |
| Unintentional injuries | 1259.05 |
| Suicide | 813.45 |
| Malignant neoplasms | 449.62 |
| Heart disease | 441.58 |
| COVID-19 | 306.72 |
| Chronic liver disease and cirrhosis | 262.21 |
| Perinatal period conditions | 156.84 |
Source: Colorado Vital Records - Data Request
Between 2020 and 2022, Mesa County had higher rates of YPLL than Colorado for suicide, cancer, heart disease, and COVID-19. Mesa County had lower YPLL for perinatal period conditions, which are conditions that are present before birth.
All of the causes of death where Mesa County had higher rates of YPLL than Colorado are strongly and directly influenced by health behaviors:
- suicide is influenced by mental health care access and firearm culture,
- chronic liver disease and cirrhosis are influenced by alcohol consumption, and
- type 2 diabetes and heart disease have a strong correlation with diet and exercise.
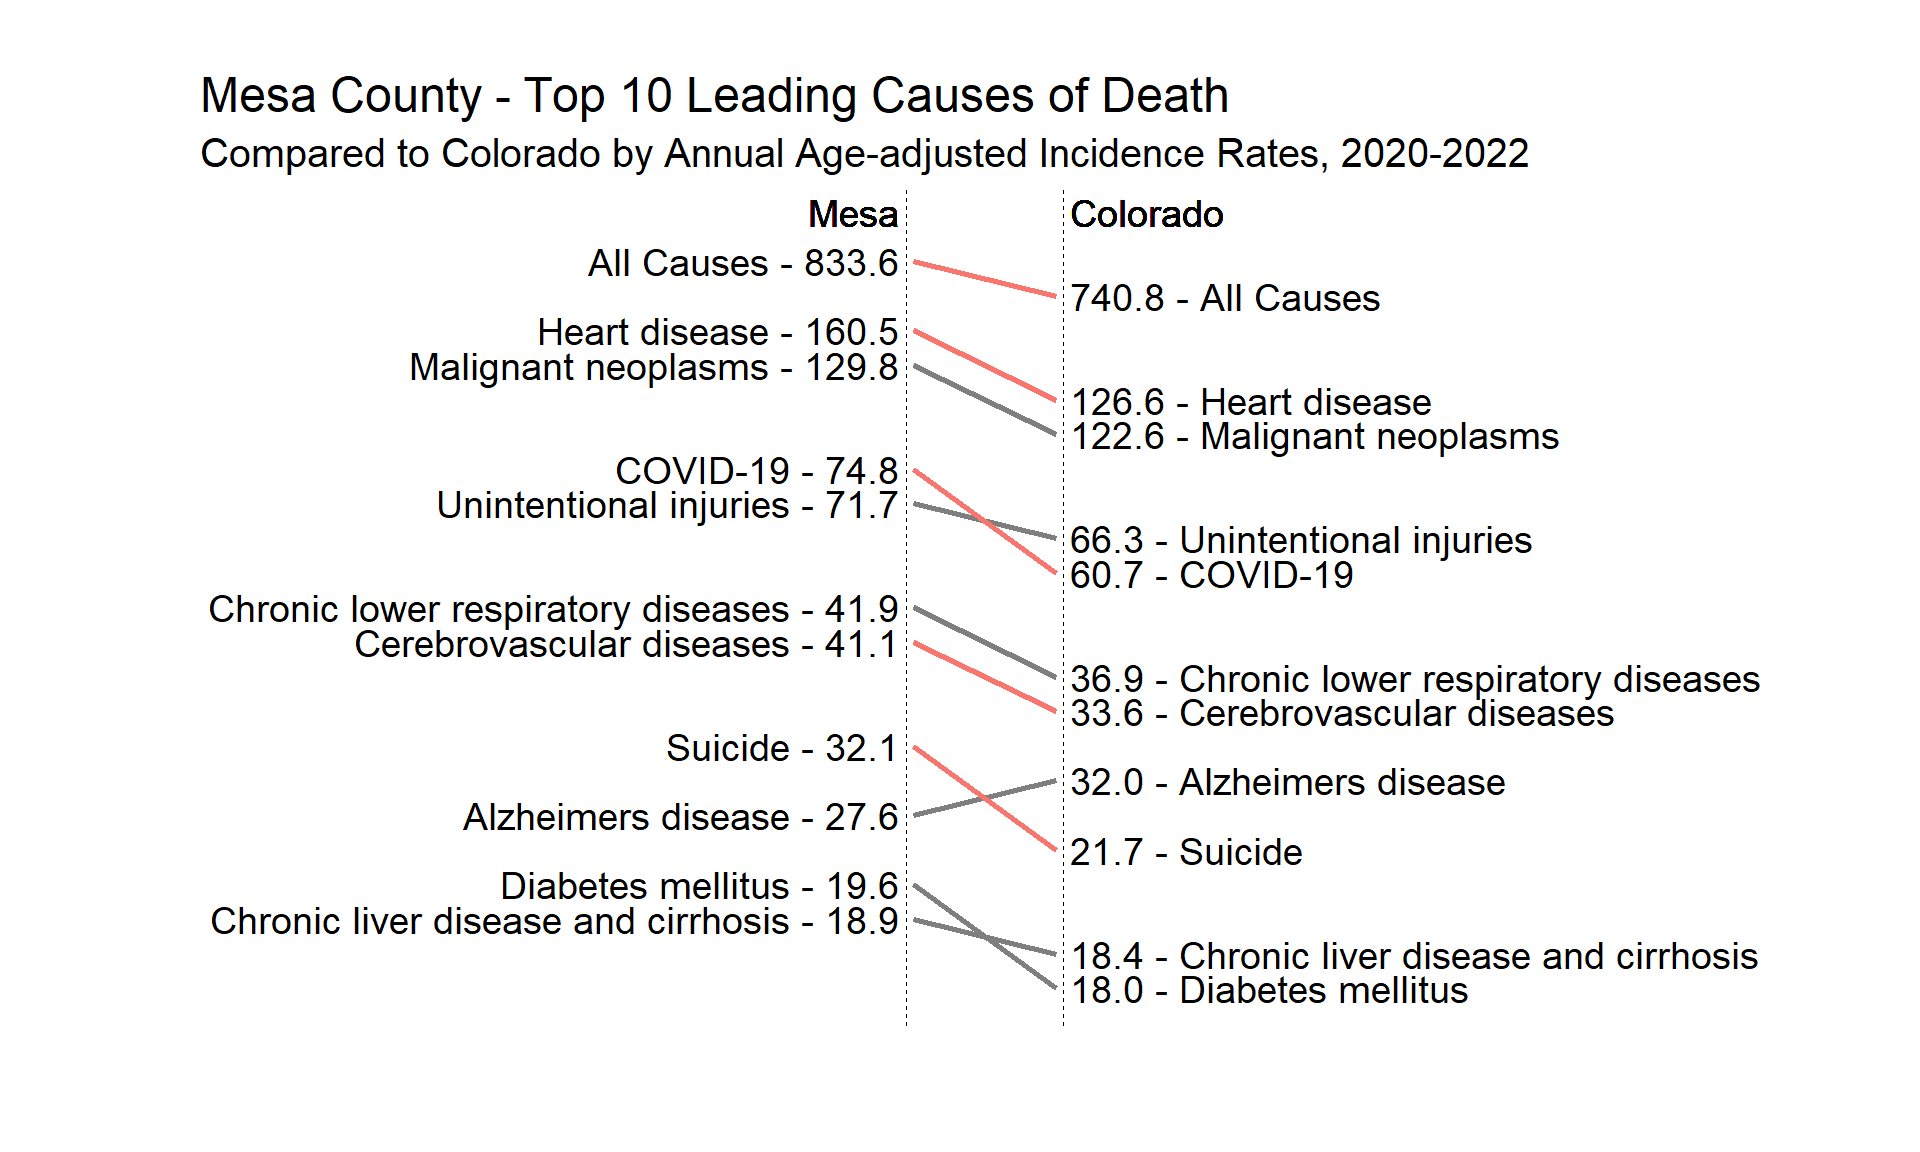
Leading Causes of Death
Mesa County has a higher age-adjusted death rate than Colorado. Because these rates are already age-adjusted, this difference is a result of factors other than the higher median age in Mesa County.
Top 10 leading causes of death in Mesa County (2020-2022)
| Cause | Crude Incident Rates (per 100,000 per year) |
|---|---|
| All Causes | 1193.42 |
| Heart disease | 245.59 |
| Malignant neoplasms | 195.16 |
| COVID-19 | 109.34 |
| Unintentional injuries | 85.18 |
| Chronic lower respiratory diseases | 64.84 |
| Cerebrovascular diseases | 64.42 |
| Alzheimers disease | 44.92 |
| Suicide | 32.63 |
| Diabetes mellitus | 28.82 |
| Chronic liver disease and cirrhosis | 21.61 |
Source: Colorado Vital Records - Data Request
Top Three
Between 2020 and 2022, Heart disease, Cancer (Malignant neoplasms) and COVID-19 were the top three leading causes of death in Mesa County as well as in Colorado.
Four of Mesa County’s top 10 leading causes of death had higher age-adjusted rates than Colorado:
- heart disease,
- COVID-19,
- cerebrovascular diseases, and
- suicide
Top 10 leading Causes of death among Hispanics in Mesa County (2020-2022)
| Cause | Crude Incident Rates (per 100,000 per year) |
|---|---|
| All Causes | 291.34 |
| COVID-19 | 48.21 |
| Heart disease | 45.46 |
| Malignant neoplasms | 37.19 |
| Unintentional injuries | 22.04 |
| Cerebrovascular diseases | 11.71 |
| Suicide | 11.02 |
| Chronic lower respiratory diseases | 9.64 |
| Diabetes mellitus | 9.64 |
| Chronic liver disease and cirrhosis | 9.64 |
| Alzheimers disease | 5.51 |
Source: Colorado Vital Records - Data Request
Between 2020 and 2022, four of Mesa County’s top 10 leading causes of death (heart disease, COVID-19, cerebrovascular diseases, and suicide) had statistically higher age-adjusted rates than Colorado.
The leading causes of death in Mesa County are consistent across both the general population and the Hispanic or Latino community, although their rankings vary.
Notably, the Hispanic or Latino population experiences lower overall mortality rates, which is largely attributed to their younger age distribution. With a lower proportion of older adults, there are fewer deaths within the Hispanic or Latino community.
This demographic difference underscores the importance of considering age distribution when assessing health outcomes and planning interventions to address community health needs.
COVID-19 was the number one cause of death for Hispanic or Latino residents between 2020 and 2022. Health access for the Hispanic or Latino community emerged as an increasing priority throughout the pandemic response. More information is available here WEB LINK
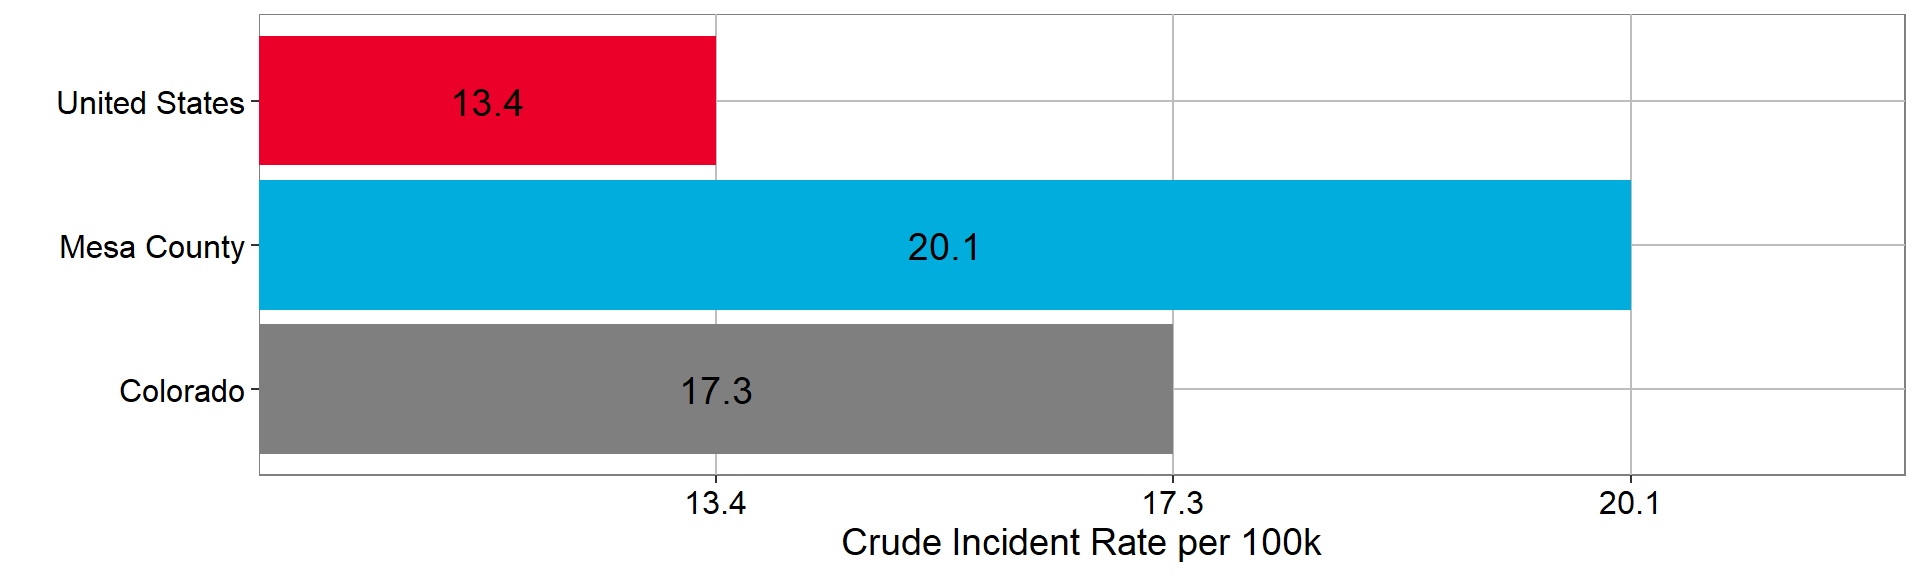
Firearms Deaths
Firearm Deaths
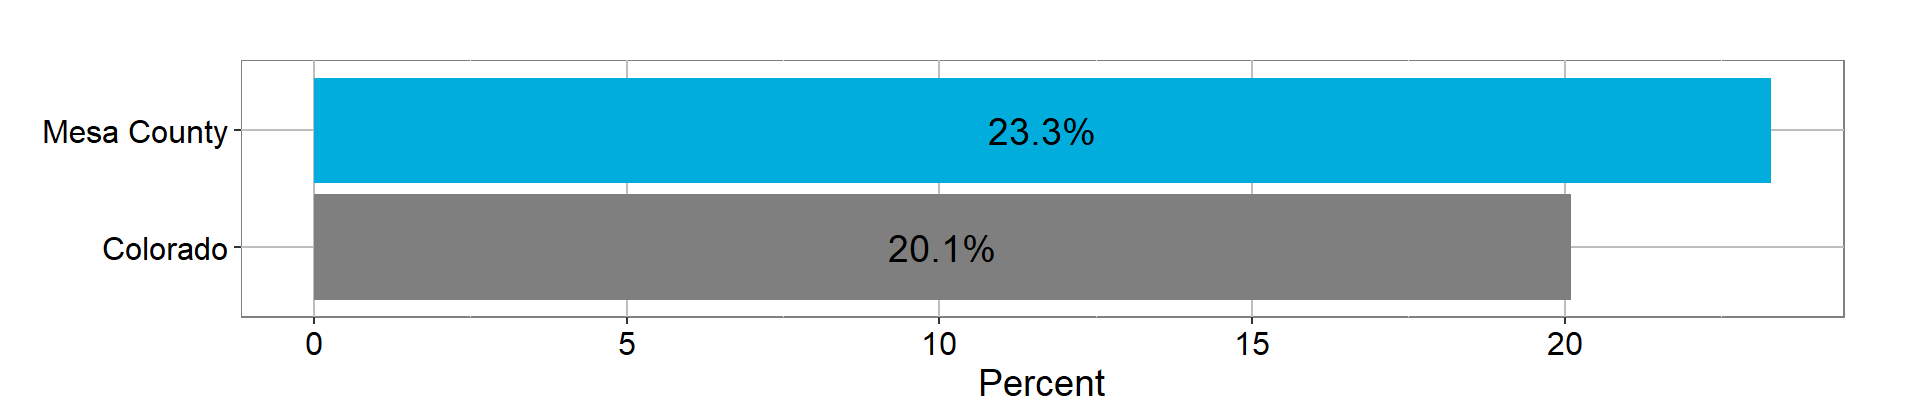
There were 95 deaths by firearms from 2020 to 2022. Nearly 9 out of 10 were suicides.
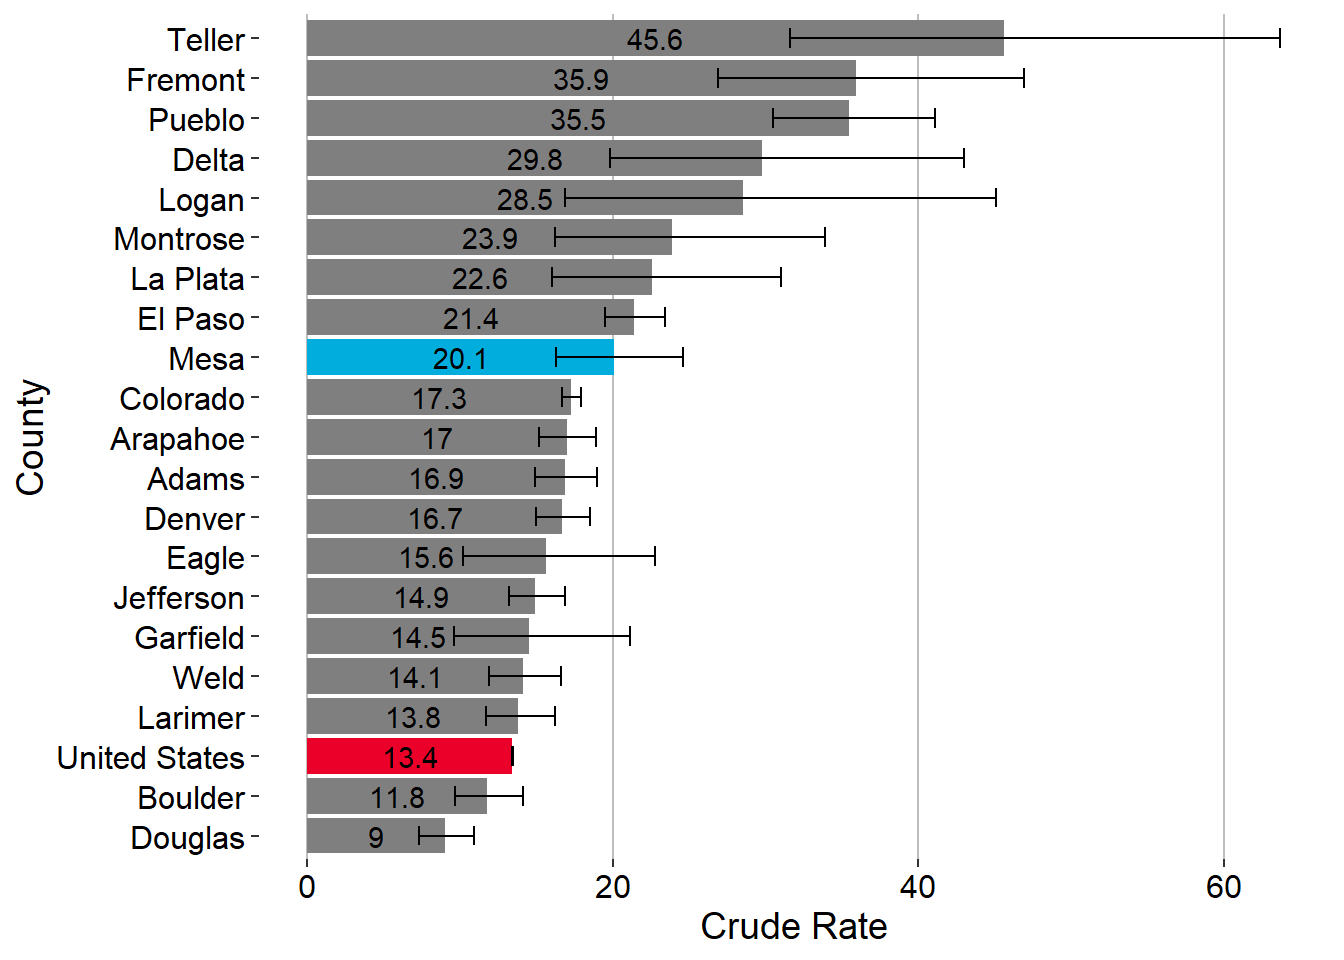
Mesa County has a higher rate of firearm death than Colorado or the United States. 87% of the firearm deaths in Mesa County between 2020 and 2022 were suicide deaths.
For more information about firearms in Mesa County, see WEB LINK.
FIREARM DEATH RATE PER 100,000 PEOPLE(2020-2022)
FIREARM DEATH RATE PER 100,000 PEOPLE(2020-2022)
| Region | Crude Incidence Rate per 100,000 |
|---|---|
| Mesa County | 20.1 |
| Colorado | 17.3 |
| United States | 13.4 |
FIREARM DEATH RATE PER 100,000 PEOPLE, COLORADO COUNTIES (2020-2022)
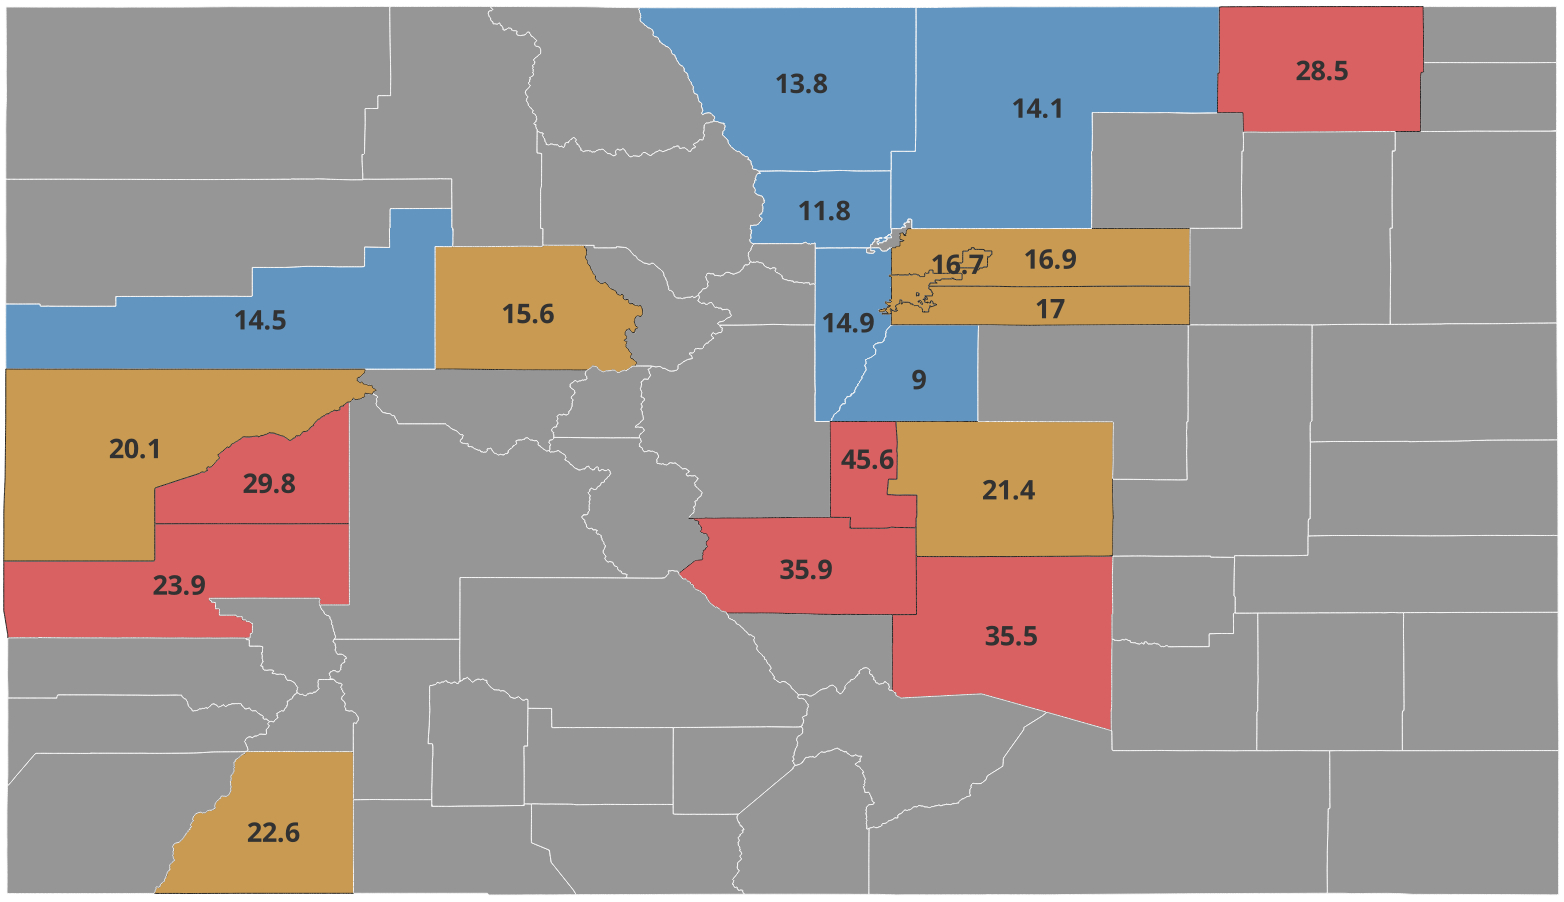
FIREARM DEATH RATE PER 100,000 PEOPLE, COLORADO COUNTIES (2020-2022)
Reliable Estimates Only
FIREARM DEATH RATE PER 100,000 PEOPLE, COLORADO COUNTIES (2020-2022)
All Estimates
| Region | Crude Rate | LCL95 | UCL95 |
|---|---|---|---|
| Broomfield | 7.5 | 4.4 | 12.0 |
| Summit | 7.6 | 3.0 | 15.6 |
| Gunnison | 7.8 | 2.1 | 19.9 |
| Douglas | 9.0 | 7.3 | 10.9 |
| Yuma | 10.1 | 2.1 | 29.4 |
| Pitkin | 11.6 | 4.3 | 25.3 |
| Boulder | 11.8 | 9.7 | 14.1 |
| Conejos | 13.3 | 2.7 | 38.8 |
| United States | 13.4 | 13.4 | 13.5 |
| Larimer | 13.8 | 11.7 | 16.2 |
| Prowers | 13.9 | 4.5 | 32.5 |
| Alamosa | 14.1 | 5.7 | 29.1 |
| Weld | 14.1 | 11.9 | 16.6 |
| Clear Creek | 14.2 | 3.9 | 36.3 |
| Garfield | 14.5 | 9.6 | 21.1 |
| Jefferson | 14.9 | 13.2 | 16.9 |
| Saguache | 15.4 | 3.2 | 44.9 |
| Eagle | 15.6 | 10.2 | 22.8 |
| Denver | 16.7 | 15.0 | 18.5 |
| Adams | 16.9 | 14.9 | 19.0 |
| Arapahoe | 17.0 | 15.2 | 18.9 |
| Archuleta | 17.0 | 6.8 | 35.0 |
| Morgan | 17.2 | 9.6 | 28.3 |
| Colorado | 17.3 | 16.7 | 17.9 |
| Moffat | 17.7 | 7.1 | 36.4 |
| Elbert | 18.5 | 10.3 | 30.5 |
| Grand | 19.0 | 8.7 | 36.1 |
| Custer | 19.8 | 4.1 | 57.9 |
| Mesa | 20.1 | 16.3 | 24.6 |
| San Miguel | 20.7 | 6.7 | 48.3 |
| El Paso | 21.4 | 19.5 | 23.4 |
| Montezuma | 21.6 | 12.6 | 34.6 |
| Phillips | 22.3 | 4.6 | 65.2 |
| Lake | 22.6 | 7.3 | 52.6 |
| La Plata | 22.6 | 16.0 | 31.0 |
| Routt | 22.7 | 13.2 | 36.3 |
| Rio Grande | 23.3 | 10.1 | 46.0 |
| Montrose | 23.9 | 16.2 | 33.9 |
| Chaffee | 25.2 | 14.1 | 41.6 |
| Las Animas | 25.5 | 12.7 | 45.6 |
| Gilpin | 28.4 | 9.2 | 66.2 |
| Logan | 28.5 | 16.9 | 45.1 |
| Huerfano | 28.7 | 10.5 | 62.5 |
| Baca | 28.9 | 6.0 | 84.5 |
| Delta | 29.8 | 19.8 | 43.0 |
| Otero | 30.6 | 17.9 | 49.1 |
| Park | 32.0 | 18.7 | 51.3 |
| Washington | 34.4 | 11.2 | 80.3 |
| Pueblo | 35.5 | 30.5 | 41.1 |
| Fremont | 35.9 | 26.9 | 46.9 |
| Kit Carson | 38.2 | 16.5 | 75.2 |
| Teller | 45.6 | 31.6 | 63.7 |
| Crowley | 46.9 | 20.2 | 92.4 |
| Costilla | 74.3 | 32.1 | 146.4 |
Source: Colorado Health Information Dataset
Suicide Deaths
More Info
More information on Suicides in Mesa County can be found in 2022 Annual Suicide report
Rates of suicide in Mesa County are consistently higher than both Colorado and the U.S, making this a critical public health issue. From 2020 to 2022, Mesa County’s suicide rate was more than double the national rate.
More than half of Mesa County residents who died by suicide from 2020 to 2022 used a firearm. Nearly a quarter died by hanging, and a sixth by overdose or poisoning.
Differences in suicide rates between states are better explained by levels of household gun ownership than by mental health problems, suicide ideation, or suicide attempt. Half of Mesa County adults report having a firearm in their home, which increases the risk of suicide death by more than three times due to increased access to lethal means.
Firearm Deaths and Suicide
From 2018 to 2022, more than half of all suicide deaths in Mesa County were a result of firearm injury.
Veterans are a population at risk for suicide death. Although the 65 and over age group has the lowest rate of suicide ideations, attempts, and death, they account for nearly half of veteran suicides.
Age Adjusted Rates 2020-2022 per 100,000 and percent of suicides amoung males and ages 10-24, and selected methods
Region
|
Count
|
Rate/100,000
|
Incidence Rate
|
Method Incidence Rate
|
|||||
|---|---|---|---|---|---|---|---|---|---|
| Deaths | Overall | Males | Females | White Males | Ages 10-24 | Firearms | Hanging (Strangulation) | Overdose (Poisoning) | |
| Mesa County | 154 | 32.1 | 51.2 | 13.4 | 79.2% | 13.0% | 53.9% | 25.3% | 14.9% |
| Colorado | 3,951 | 21.7 | 34.1 | 9.6 | 78.0% | 14.6% | 52.6% | 25.6% | 12.6% |
| United States | 143,638 | 13.9 | 22.6 | 5.7 | 68.8% | 14.1% | 51.9% | 25.9% | 12.0% |
Source: CDPHE: Colorado Suicide Statistics and CDC
Suicides Among Veterans
The over 65 age group in the general population has the highest veteran representation. It is not surprising that most veteran suicide deaths fall into this age category.
Suicide: Percent with Veteran Status (2020-2022)
| Region | Age 25-44 | Age 45-64 | Age 65+ |
|---|---|---|---|
| Mesa County | 11.3% | 15.2% | 47.1% |
| Colorado | 12.2% | 15.1% | 36.6% |
PERCENT OF MESA COUNTY SUICIDE DEATHS BY METHOD (2020-2022)
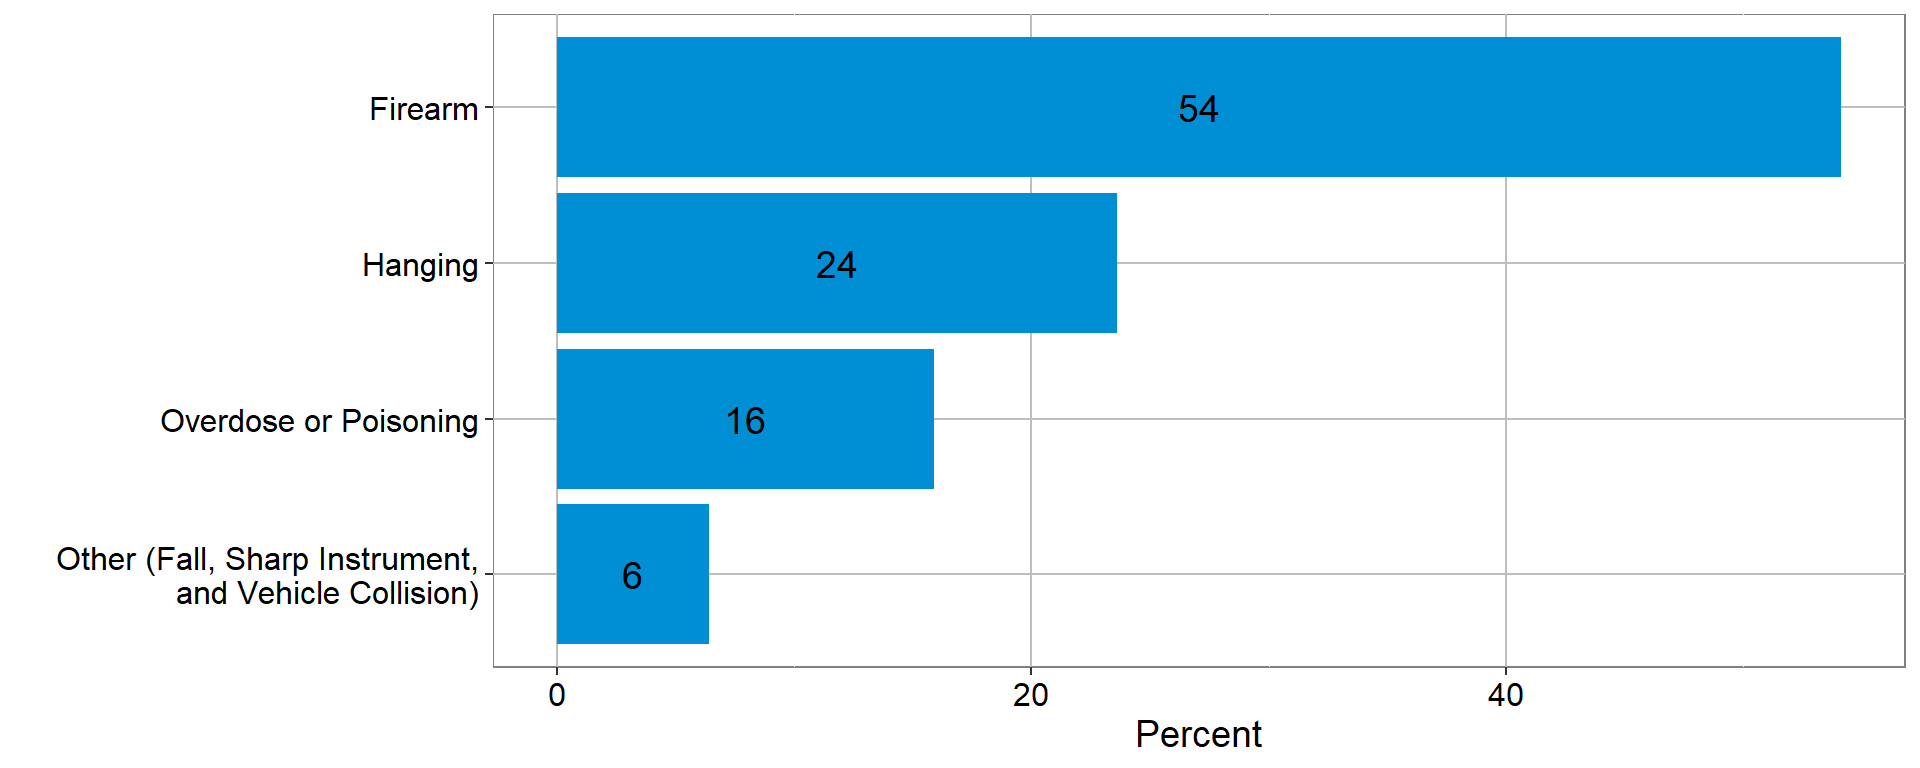
PERCENT OF MESA COUNTY SUICIDE DEATHS BY METHOD (2020-2022)
| Method | Percent |
|---|---|
| Firearm | 54.1 |
| Hanging | 23.6 |
| Overdose or Poisoning | 15.9 |
| Other (Fall, Sharp Instrument, and Vehicle Collision) | 6.4 |
Source: Colorado Health Information Dataset
Note: Percentatges in this table are from a different source than the table above. Small overall counts and slightly different classifiaction rules leads to the slight diffrences.
Age Adjusted Incidence Rates for Suicide Deaths by County (2020-2022)
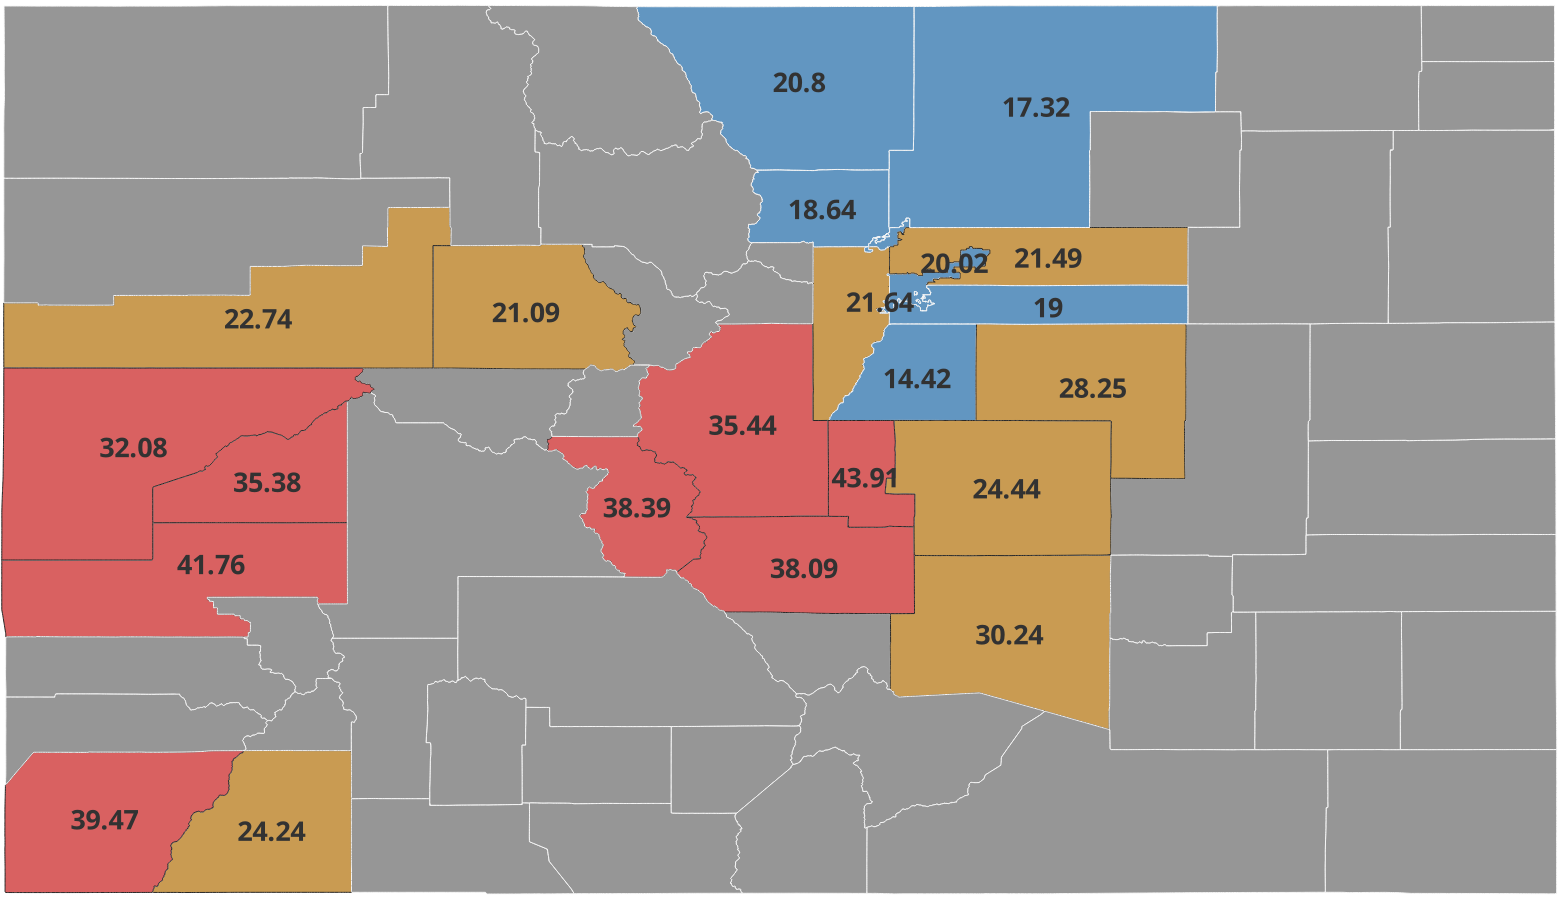
Lowest third of rates;
Middle third of rates;
Top third of rates;
Estimate is unreliable (error is \(\pm\) 50% or more)
Age Adjusted Incidence Rates for Suicide Deaths by County (2020-2022)
Reliable Estimates only
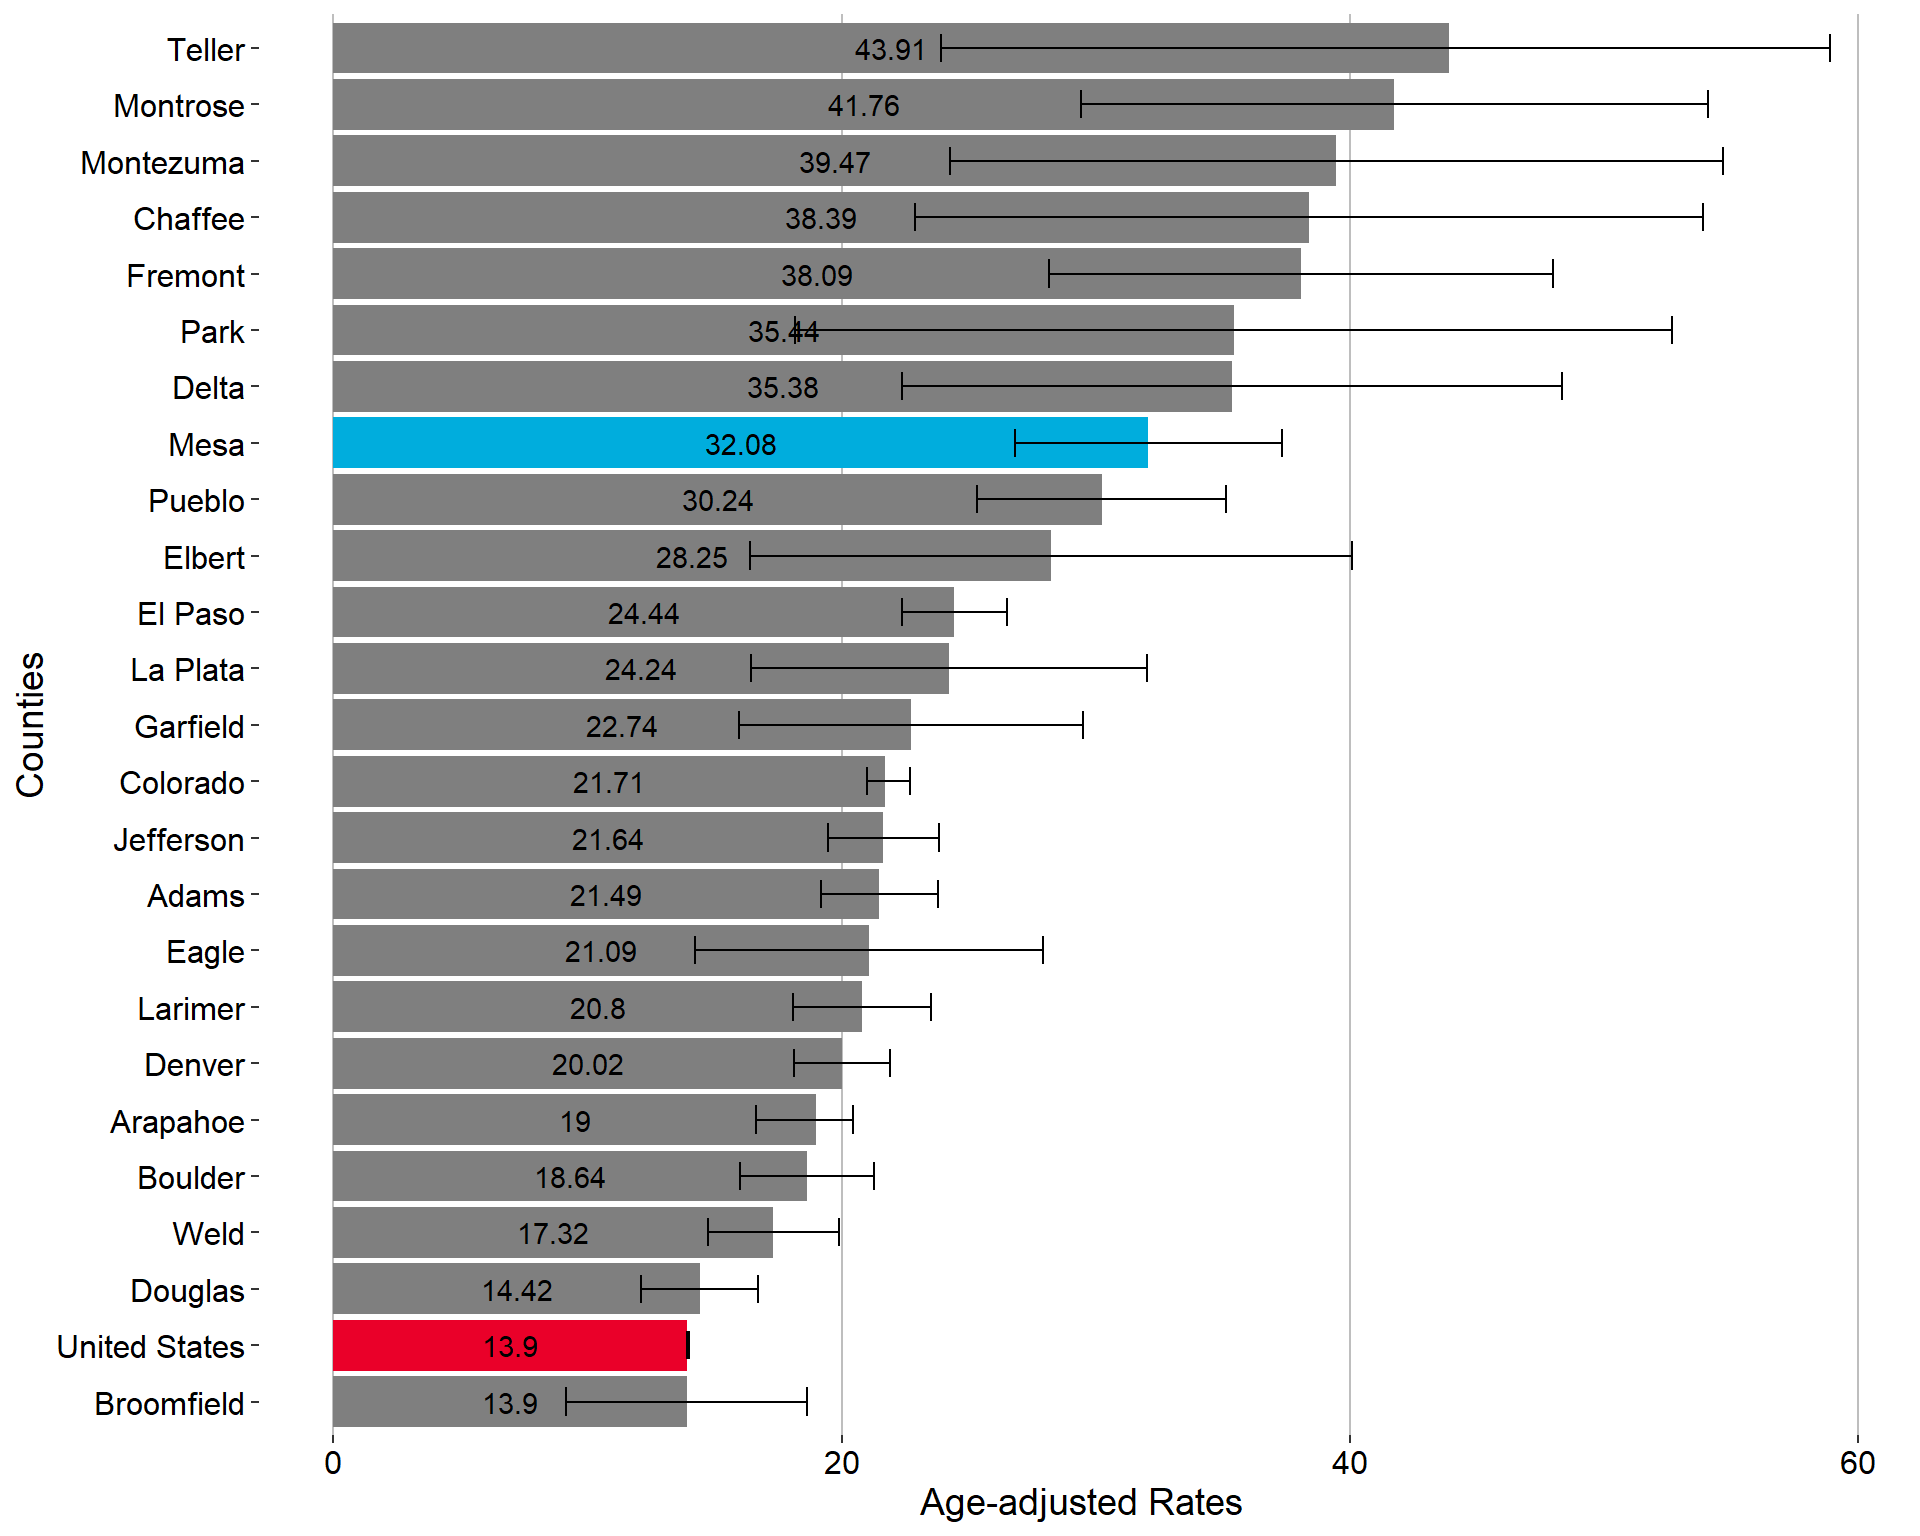
Age Adjusted Incidence Rates for Suicide Deaths by County (2020-2022)
Reliable Estimates only
| Region | Age Adjusted Rate | LCL95 | UCL95 |
|---|---|---|---|
| Teller | 43.91 | 23.91 | 58.91 |
| Montrose | 41.76 | 29.43 | 54.09 |
| Montezuma | 39.47 | 24.26 | 54.69 |
| Chaffee | 38.39 | 22.88 | 53.90 |
| Fremont | 38.09 | 28.18 | 48.00 |
| Park | 35.44 | 18.18 | 52.70 |
| Delta | 35.38 | 22.40 | 48.36 |
| Mesa | 32.08 | 26.82 | 37.34 |
| Pueblo | 30.24 | 25.34 | 35.14 |
| Elbert | 28.25 | 16.38 | 40.11 |
| El Paso | 24.44 | 22.38 | 26.51 |
| La Plata | 24.24 | 16.44 | 32.04 |
| Garfield | 22.74 | 15.96 | 29.52 |
| Colorado | 21.71 | 21.02 | 22.69 |
| Jefferson | 21.64 | 19.45 | 23.83 |
| Adams | 21.49 | 19.18 | 23.81 |
| Eagle | 21.09 | 14.22 | 27.95 |
| Larimer | 20.80 | 18.10 | 23.51 |
| Denver | 20.02 | 18.14 | 21.89 |
| Arapahoe | 19.00 | 16.63 | 20.45 |
| Boulder | 18.64 | 15.99 | 21.28 |
| Weld | 17.32 | 14.73 | 19.91 |
| Douglas | 14.42 | 12.12 | 16.72 |
| Broomfield | 13.90 | 9.17 | 18.64 |
| United States | 13.90 | 13.90 | 14.00 |
Source: Colorado Health Information Dataset
Increasing Trend
Mesa County shows an increasing trend in the incidence rate of suicide.
INCIDENCE RATES FOR SUICIDE DEATHS
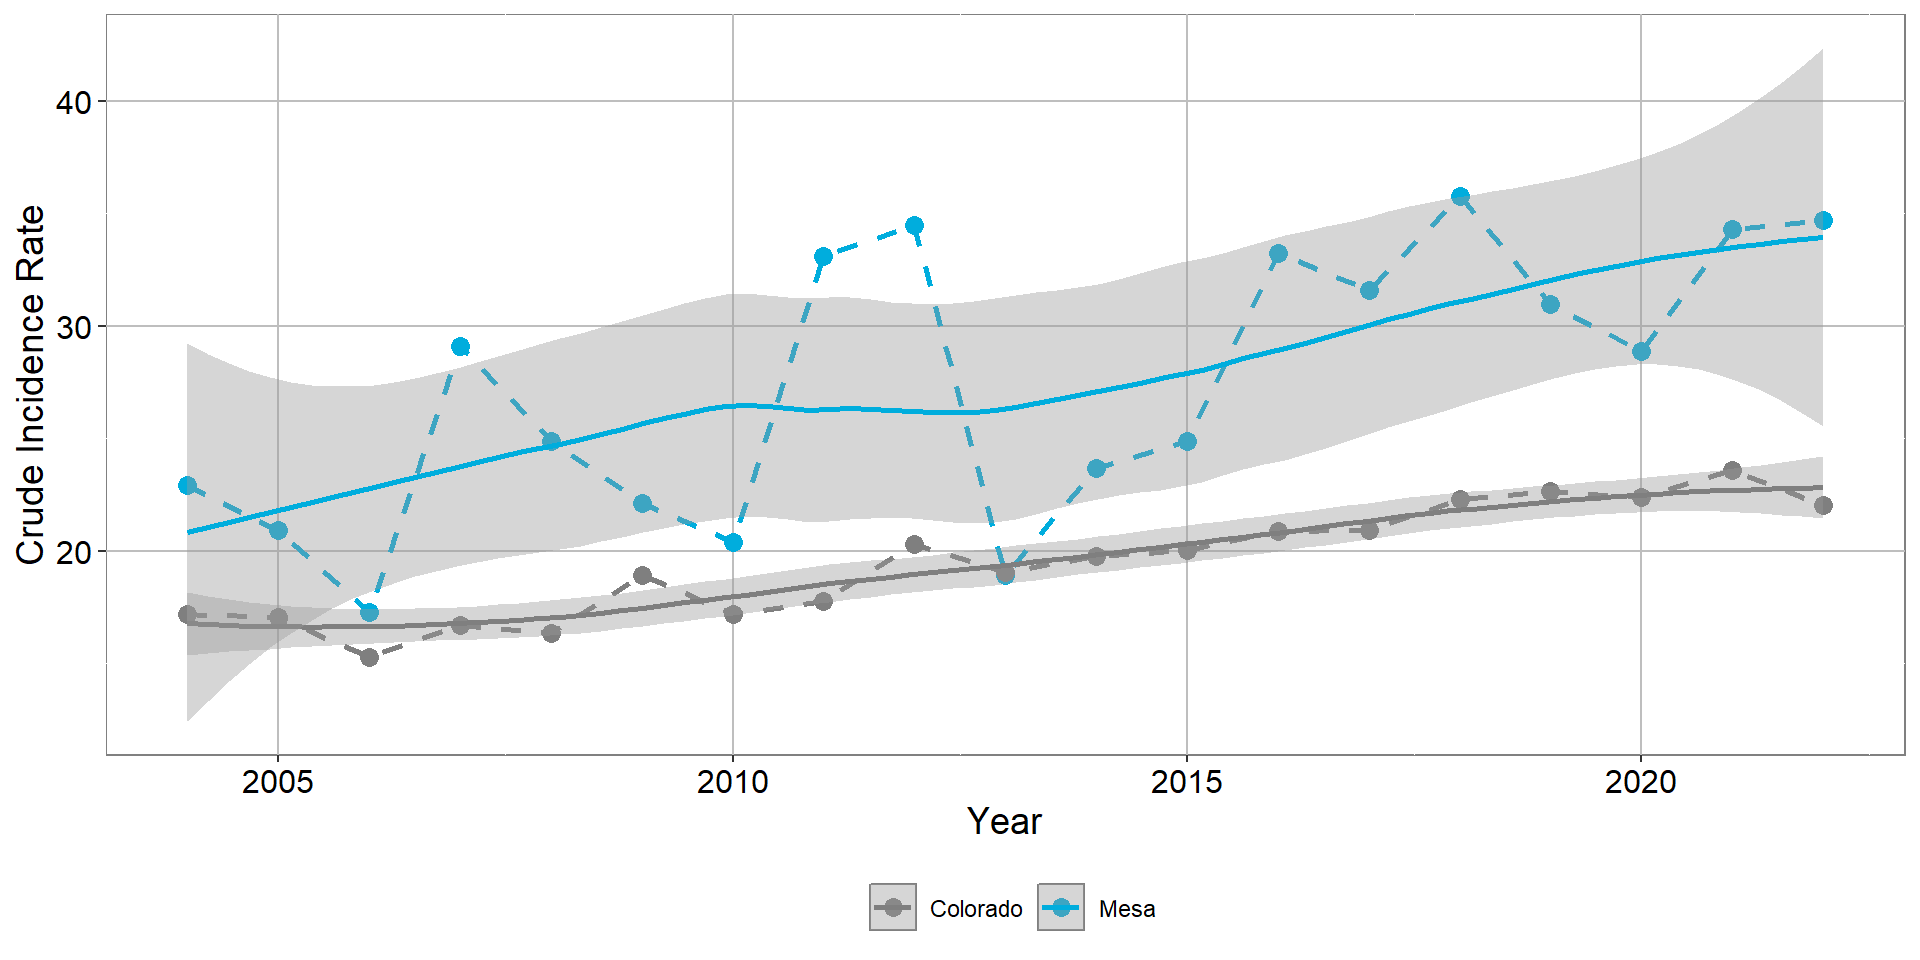
INCIDENCE RATES FOR SUICIDE DEATHS
| Region | 2004 | 2005 | 2006 | 2007 | 2008 | 2009 | 2010 | 2011 | 2012 | 2013 | 2014 | 2015 | 2016 | 2017 | 2018 | 2019 | 2020 | 2021 | 2022 |
|---|---|---|---|---|---|---|---|---|---|---|---|---|---|---|---|---|---|---|---|
| Mesa | 22.90 | 20.93 | 17.28 | 29.11 | 24.88 | 22.10 | 20.39 | 33.12 | 34.47 | 18.93 | 23.68 | 24.89 | 33.26 | 31.59 | 35.78 | 30.98 | 28.86 | 34.30 | 34.69 |
| Colorado | 17.18 | 17.05 | 15.26 | 16.70 | 16.34 | 18.89 | 17.17 | 17.76 | 20.27 | 19.04 | 19.77 | 20.04 | 20.86 | 20.92 | 22.31 | 22.66 | 22.37 | 23.58 | 22.04 |
Youth and Young Adults
Comparisons of the rate of youth (10-18) and young adult (19-24) suicide in Mesa County with other Colorado counties is difficult due to the low frequency of these deaths. From 2018 to 2022, 367 Colorado youth died by suicide and 13 Mesa County youth. In Colorado 622 young adults died by suicide and 17 Mesa County young adults.
For both age groups, Mesa County has a high rate, but it is comparable to other populous counties where rates can be reliably determined, and close to the state’s average rate.
Overdoses Deaths
From 2020 to 2022, Mesa County’s rate of overdose deaths was 26.1 per 100,000. Colorado’s rate was 29.6, and the U.S. rate was 32.1.
In Mesa County:
- Men died of overdose at nearly twice the rate of women, 34.6 compared to 17.7.
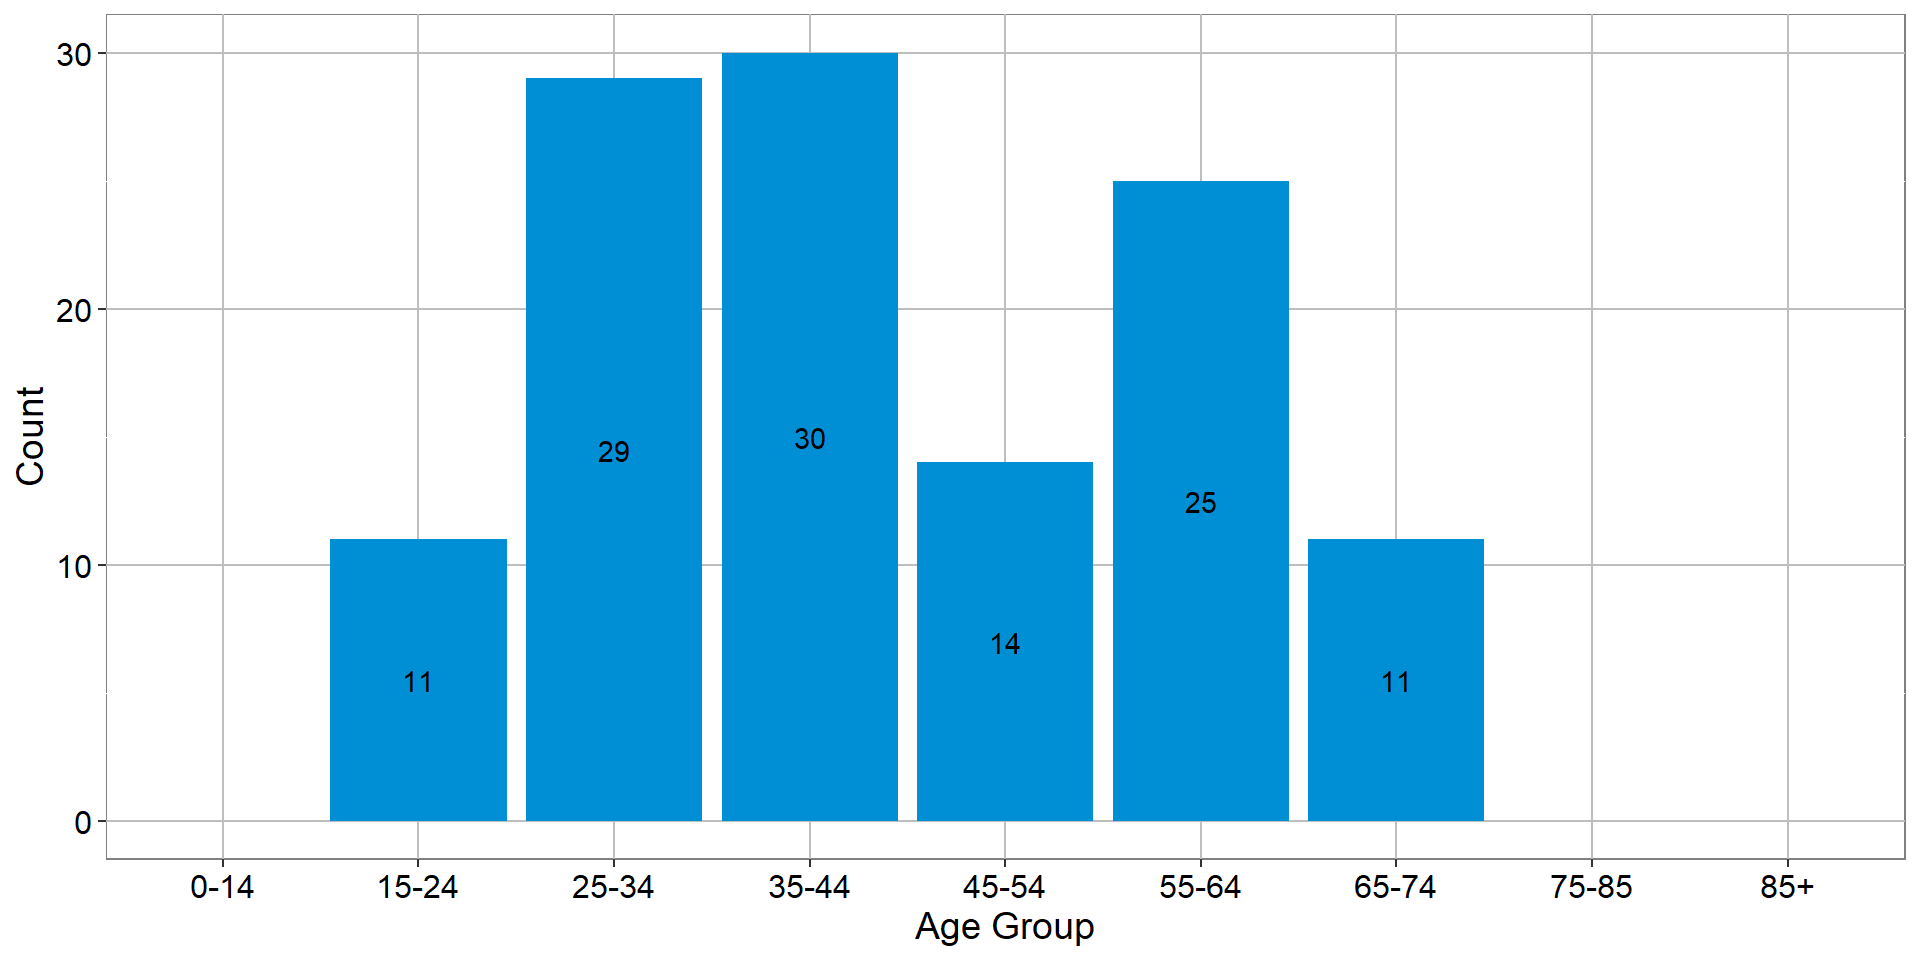
- The age groups with the highest counts for 2020-2022 were 25-34, 35-44, and 55-64
Unintentional Overdose
Between 2020 and 2022, 82% of overdose deaths in Mesa County were unintentional.
COUNT OF OVERDOSE DEATHS BY AGE GROUP, MESA COUNTY (2020-2022)
In age groups with three or fewer deaths the data has been suppressed.
COUNT OF OVERDOSE DEATHS BY AGE GROUP, MESA COUNTY (2020-2022)
| Age Group | 0-14 | 15-24 | 25-34 | 35-44 | 45-54 | 55-64 | 65-74 | 75-85 | 85+ |
| Count | NA | 11 | 29 | 30 | 14 | 25 | 11 | NA | NA |
OVERDOSE DEATHS BY DRUG TYPE, COUNTS, MESA COUNTY (2020-2022)
Total
|
Intent
|
Opioid
|
Heroin
|
Cocaine
|
Amphetamines
|
||
|---|---|---|---|---|---|---|---|
| Intentional | Unintentional | Total | Fentanyl | ||||
| 123 | 22 | 101 | 53 | 37 | 8 | 5 | 61 |
OVERDOSE DEATHS, RATE PER 100,000 PEOPLE, COLORADO COUNTIES (2020-2022)
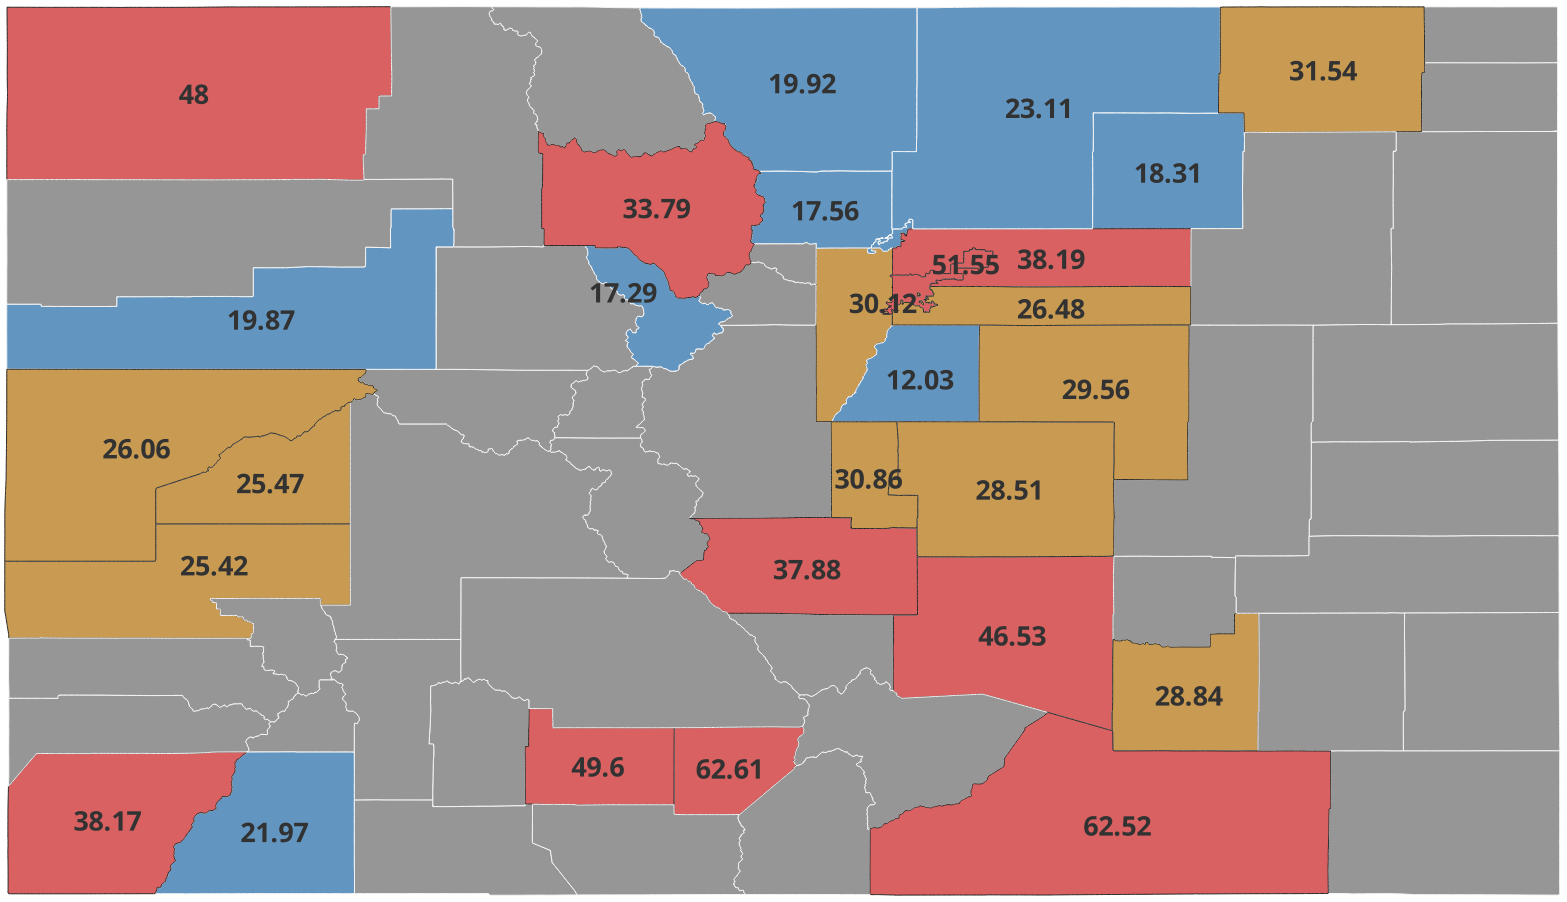
Lowest third of rates;
Middle third of rates;
Top third of rates;
Estimate is unreliable (error is \(\pm\) 50% or more)
OVERDOSE DEATHS, RATE PER 100,000 PEOPLE, COLORADO COUNTIES (2020-2022)
Unreliable extimates not shown
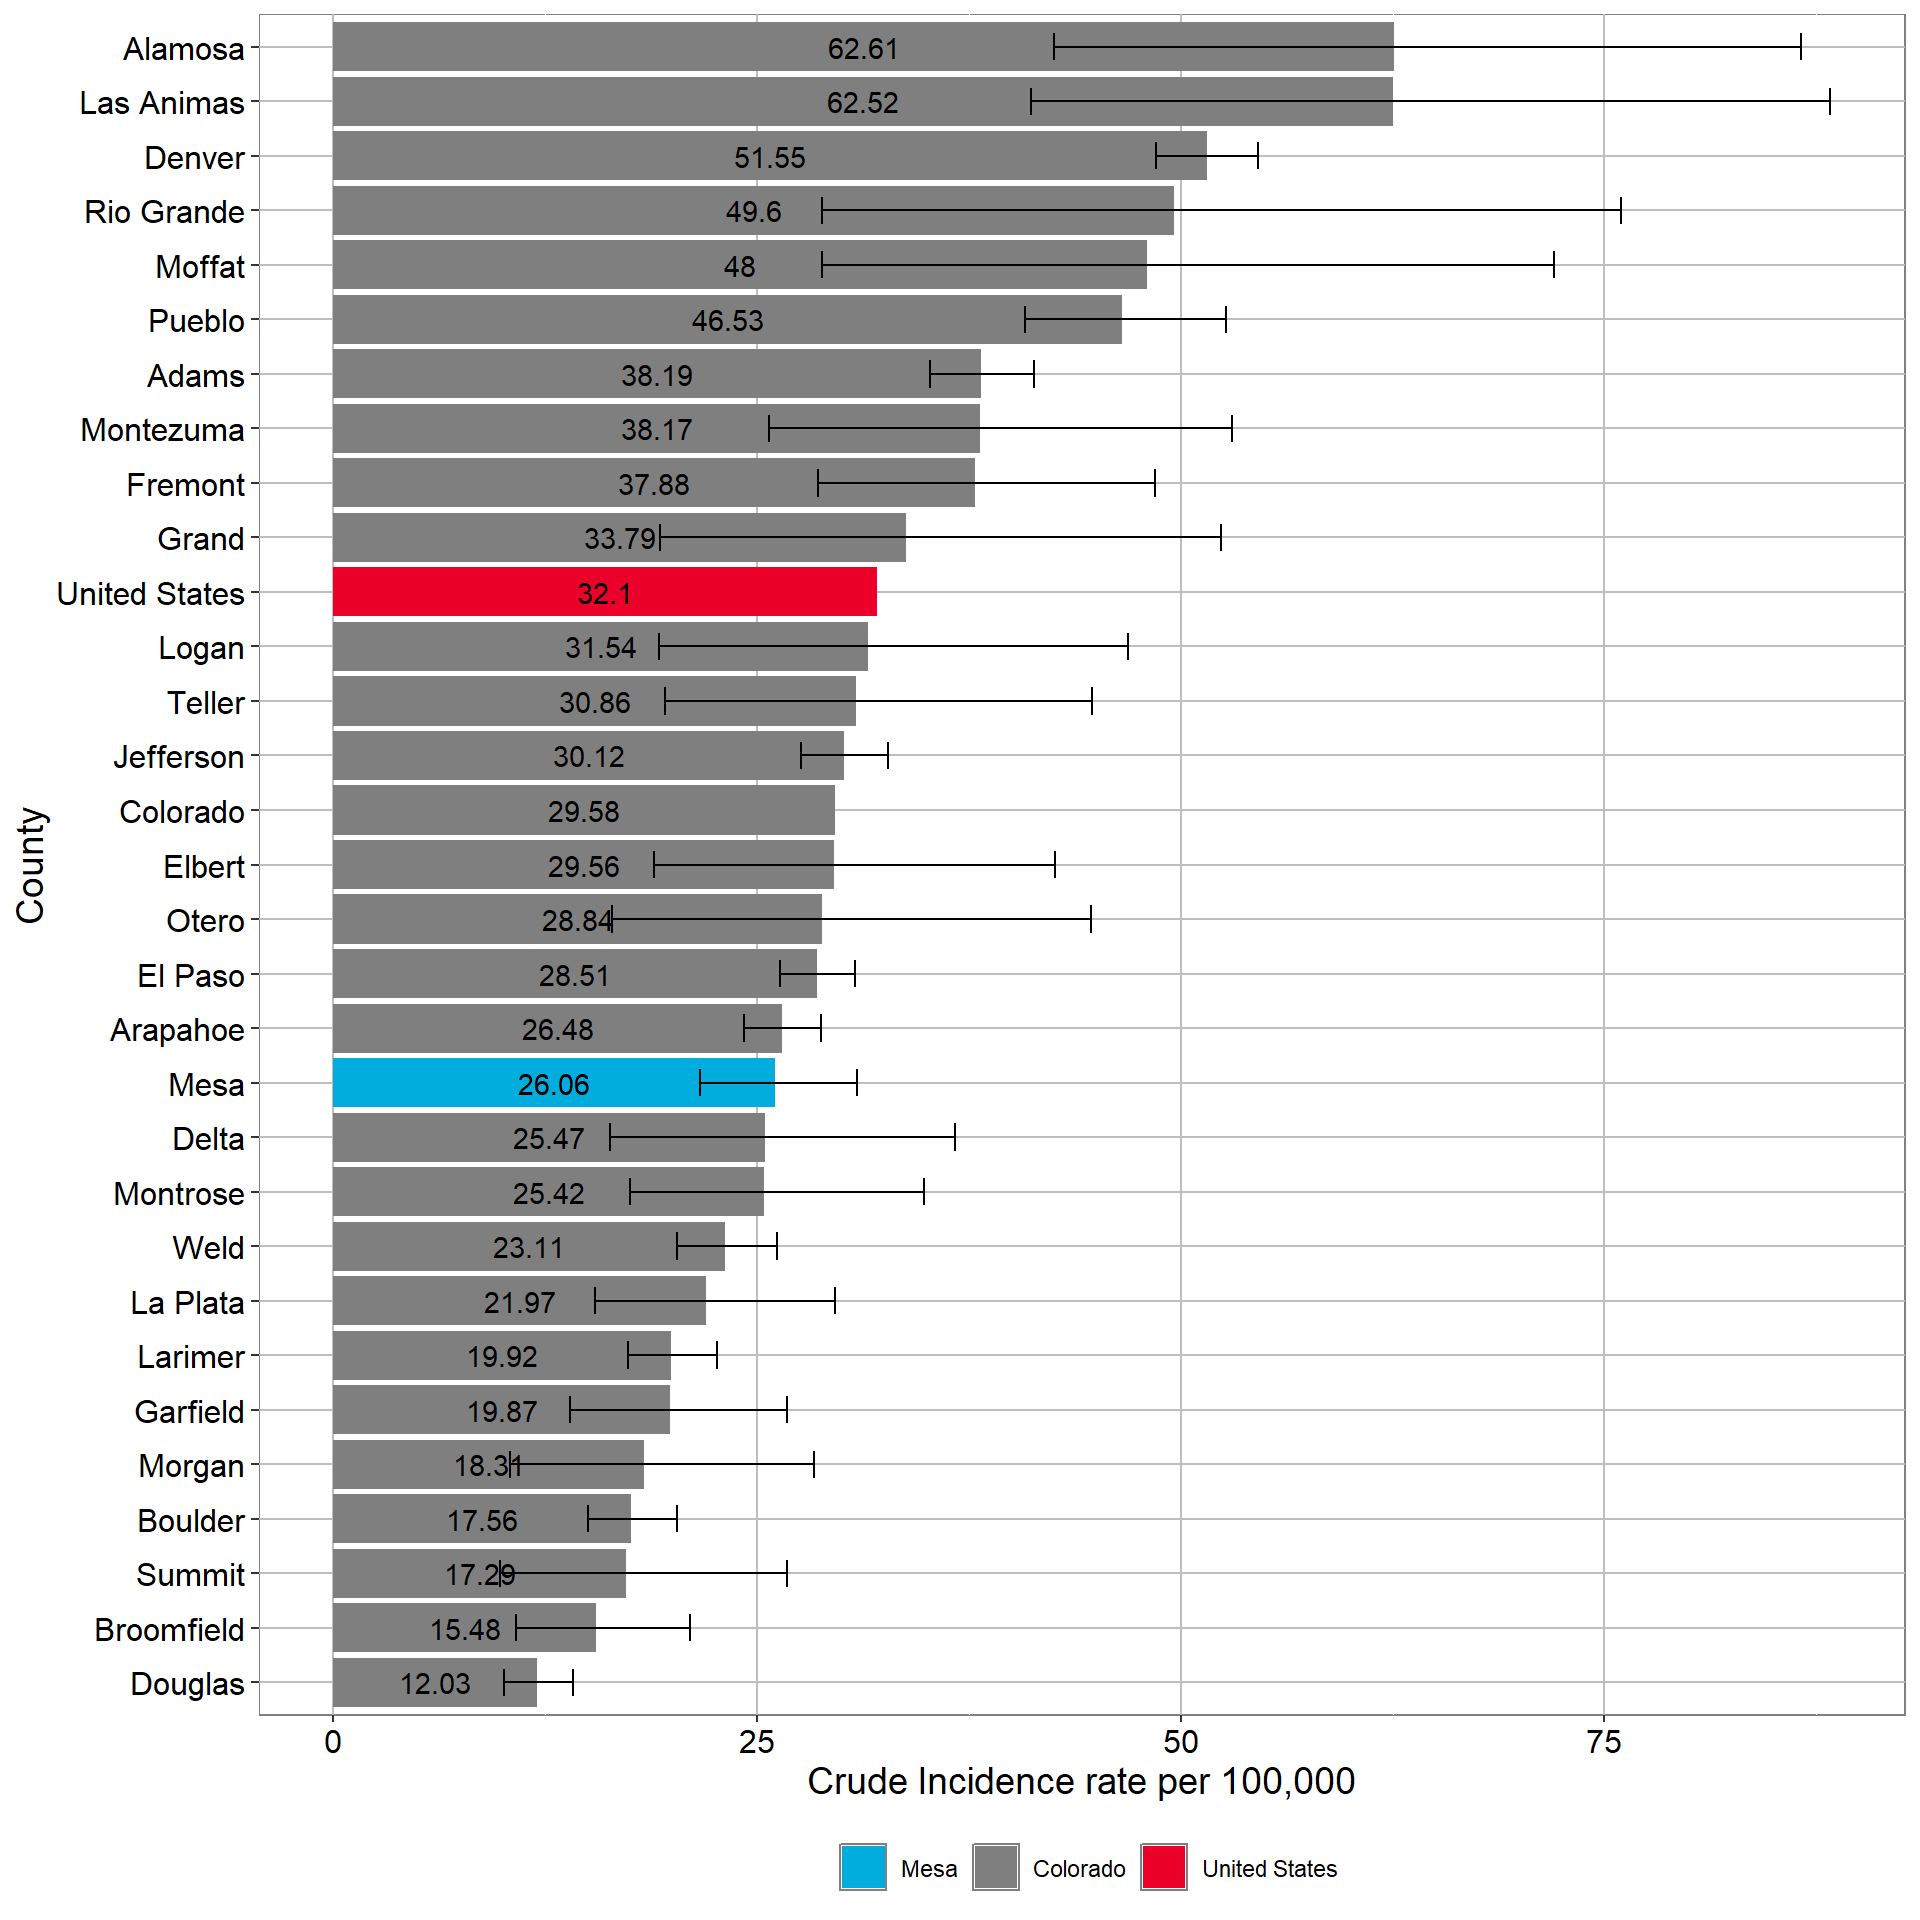
OVERDOSE DEATHS, RATE PER 100,000 PEOPLE, COLORADO COUNTIES (2020-2022)
All counties
| Region | Crude Rate | LCL95 | UCL95 | |
|---|---|---|---|---|
| 2 | Adams | 38.19 | 35.19 | 41.31 |
| 3 | Alamosa | 62.61 | 42.51 | 86.58 |
| 4 | Arapahoe | 26.48 | 24.25 | 28.80 |
| 5 | Archuleta | 19.41 | 8.29 | 35.18 |
| 6 | Baca | NA | NA | NA |
| 7 | Bent | 30.56 | 9.64 | 63.21 |
| 8 | Boulder | 17.56 | 15.04 | 20.27 |
| 9 | Broomfield | 15.48 | 10.78 | 21.04 |
| 10 | Chaffee | 21.83 | 11.58 | 35.31 |
| 11 | Cheyenne | NA | NA | NA |
| 12 | Clear Creek | 21.26 | 7.65 | 41.68 |
| 1 | Colorado | 29.58 | NA | NA |
| 13 | Conejos | 17.69 | 4.60 | 39.27 |
| 14 | Costilla | 37.27 | 9.27 | 82.72 |
| 15 | Crowley | 28.97 | 9.14 | 59.91 |
| 16 | Custer | 19.84 | 3.74 | 48.64 |
| 17 | Delta | 25.47 | 16.30 | 36.68 |
| 18 | Denver | 51.55 | 48.56 | 54.56 |
| 19 | Dolores | NA | NA | NA |
| 20 | Douglas | 12.03 | 10.07 | 14.16 |
| 21 | Eagle | 7.80 | 4.14 | 12.61 |
| 22 | El Paso | 28.51 | 26.33 | 30.78 |
| 23 | Elbert | 29.56 | 18.92 | 42.57 |
| 24 | Fremont | 37.88 | 28.61 | 48.45 |
| 25 | Garfield | 19.87 | 13.98 | 26.79 |
| 26 | Gilpin | 28.39 | 8.96 | 58.73 |
| 27 | Grand | 33.79 | 19.26 | 52.37 |
| 28 | Gunnison | 13.59 | 5.39 | 25.51 |
| 29 | Hinsdale | NA | NA | NA |
| 30 | Huerfano | 43.10 | 19.54 | 75.84 |
| 31 | Jackson | NA | NA | NA |
| 32 | Jefferson | 30.12 | 27.60 | 32.75 |
| 33 | Kiowa | NA | NA | NA |
| 34 | Kit Carson | 28.62 | 10.30 | 56.09 |
| 35 | La Plata | 21.97 | 15.46 | 29.62 |
| 36 | Lake | 49.66 | 24.65 | 83.34 |
| 37 | Larimer | 19.92 | 17.36 | 22.66 |
| 38 | Las Animas | 62.52 | 41.16 | 88.31 |
| 39 | Lincoln | 30.04 | 9.48 | 62.14 |
| 40 | Logan | 31.54 | 19.23 | 46.87 |
| 41 | Mesa | 26.06 | 21.66 | 30.87 |
| 42 | Mineral | NA | NA | NA |
| 43 | Moffat | 48.00 | 28.84 | 72.00 |
| 44 | Montezuma | 38.17 | 25.73 | 53.05 |
| 45 | Montrose | 25.42 | 17.49 | 34.83 |
| 46 | Morgan | 18.31 | 10.44 | 28.38 |
| 47 | Otero | 28.84 | 16.44 | 44.70 |
| 48 | Ouray | NA | NA | NA |
| 49 | Park | 16.97 | 7.69 | 29.86 |
| 50 | Phillips | 29.73 | 7.73 | 66.00 |
| 51 | Pitkin | 21.34 | 10.59 | 35.81 |
| 52 | Prowers | 25.11 | 11.39 | 44.19 |
| 53 | Pueblo | 46.53 | 40.79 | 52.66 |
| 54 | Rio Blanco | 25.61 | 8.08 | 52.97 |
| 55 | Rio Grande | 49.60 | 28.83 | 75.98 |
| 56 | Routt | 16.02 | 8.24 | 26.36 |
| 57 | Saguache | 56.38 | 27.99 | 94.60 |
| 58 | San Juan | NA | NA | NA |
| 59 | San Miguel | 24.87 | 9.85 | 48.75 |
| 60 | Sedgwick | NA | NA | NA |
| 61 | Summit | 17.29 | 9.85 | 26.79 |
| 62 | Teller | 30.86 | 19.54 | 44.75 |
| 66 | United States | 32.10 | NA | NA |
| 63 | Washington | 20.67 | 3.90 | 50.67 |
| 64 | Weld | 23.11 | 20.25 | 26.15 |
| 65 | Yuma | NA | NA | NA |
Accidental Deaths
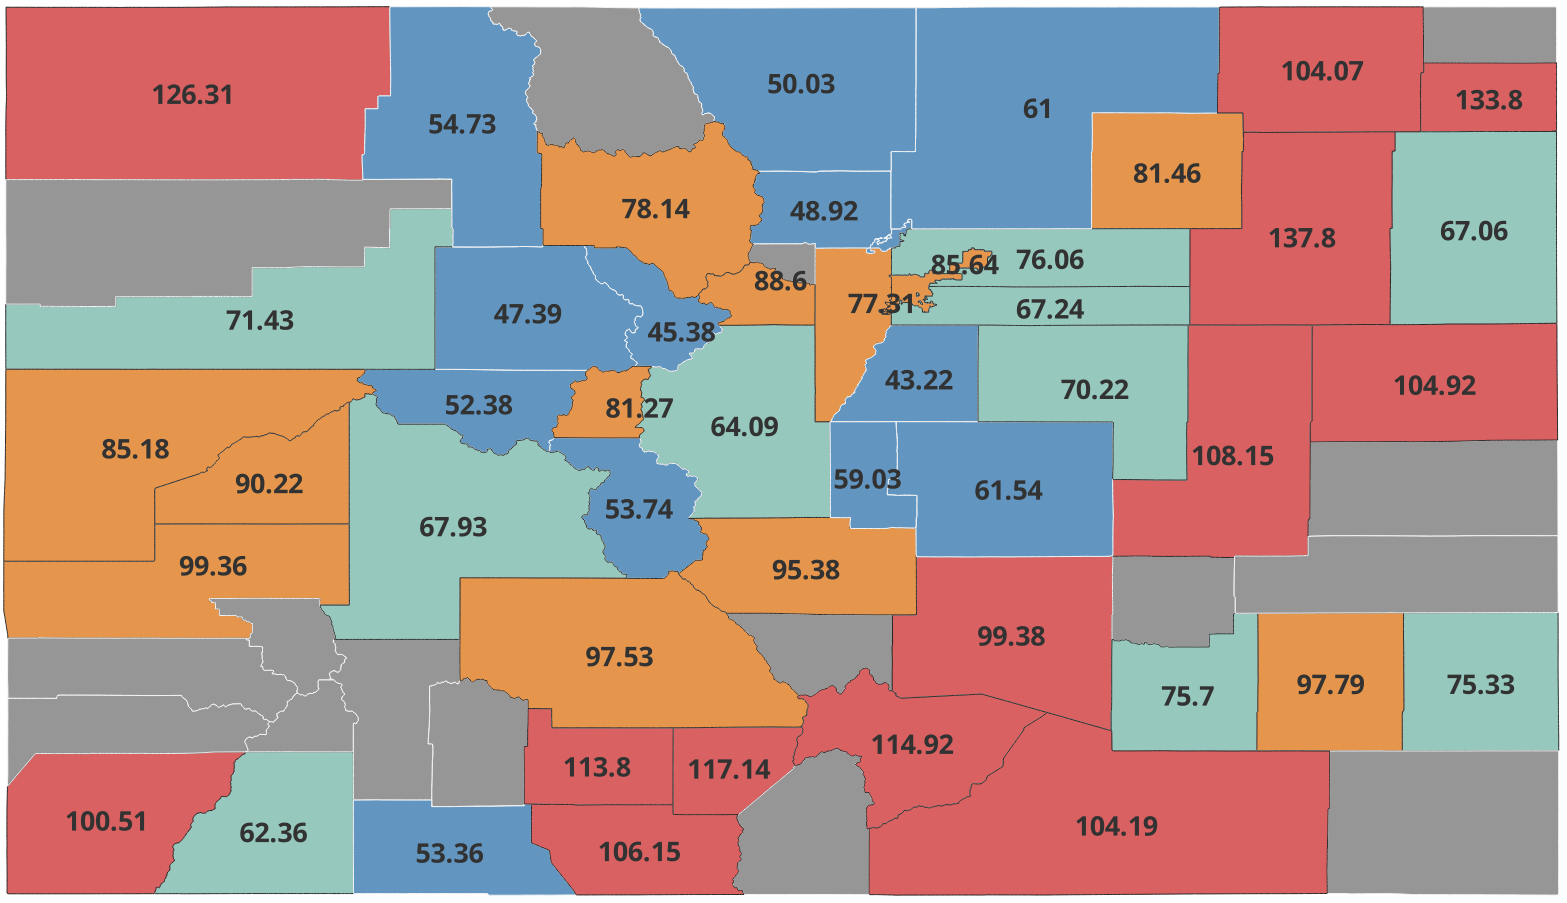
Accidental deaths are preventable. Mesa County has a higher rate than Colorado or the U.S.
ACCIDENTAL DEATHS, RATE PER 100,000 PEOPLE(2020-2022)
| Mesa County | Colorado | United States |
|---|---|---|
| 85.2 | 69.2 | 67.8 |
Between 2020 and 2022 in Mesa County, the rate for women was 65.6 per 100,000 women, and the rate for men was 105.3 per 100,000 men.
25% of accidental deaths were due to accidental poisoning and exposure to harmful substances. Another 23% were due to transportation accidents. Other causes in this category include falls, drowning, and accidental firearm discharge.
People age 85 and over accounted for over 25% of all accidental deaths, largely due to accidental falls.
Mesa County Age Distribution of Accidental Deaths 2020-2022
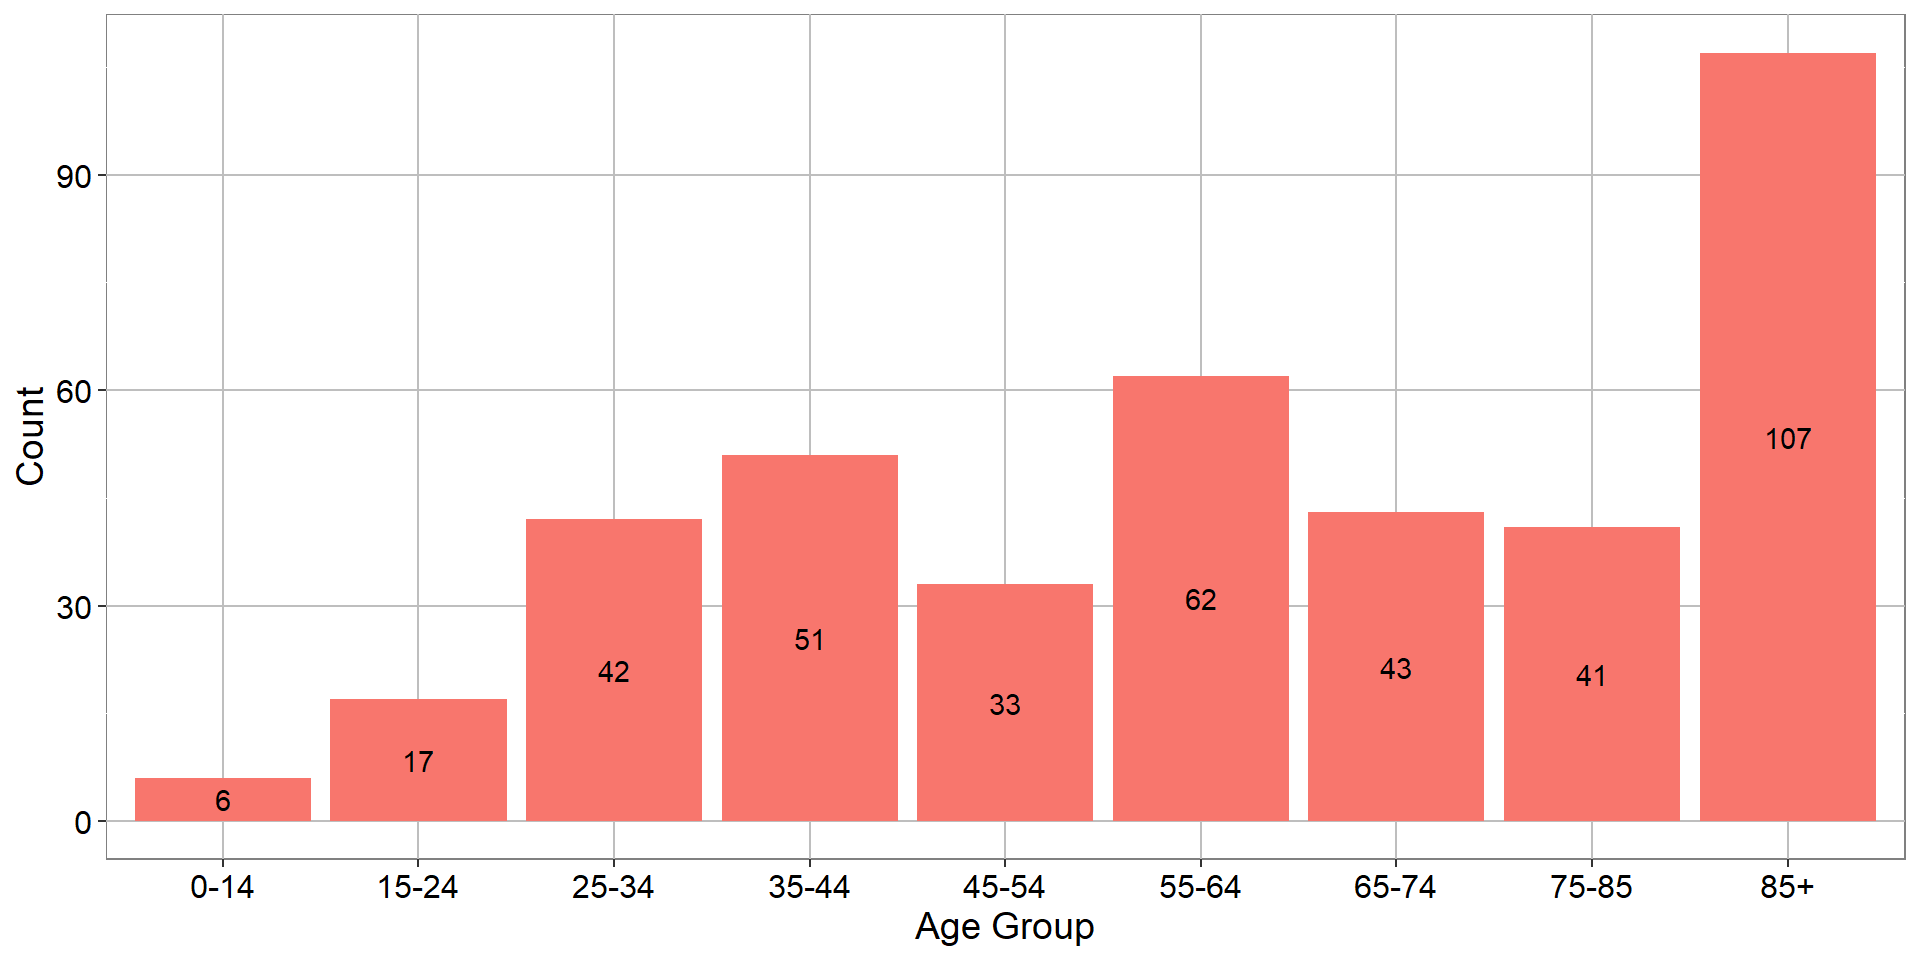
Mesa County Age Distribution of Accidental Deaths 2020-2022
| Age Group | 0-14 | 15-24 | 25-34 | 35-44 | 45-54 | 55-64 | 65-74 | 75-85 | 85+ |
| Count | 6 | 17 | 42 | 51 | 33 | 62 | 43 | 41 | 107 |
Accidental Deaths Counts in Mesa County by Classification 2020 - 2022
| Total | Accidental poisoning | ||
|---|---|---|---|
| 402 | 93 | 309 | 104 |
Source: Colorado Health Information Dataset
Crude Incidence Rates for Accidental Deaths
Lowest quarter of rates;
Second quarter of rates;
Third quarter of rates;
Top quarter of rates;
Estimate is unreliable (error is \(\pm\) 50% or more)
Crude Incidence Rates for Accidental Deaths
Unreliable estimates not shown
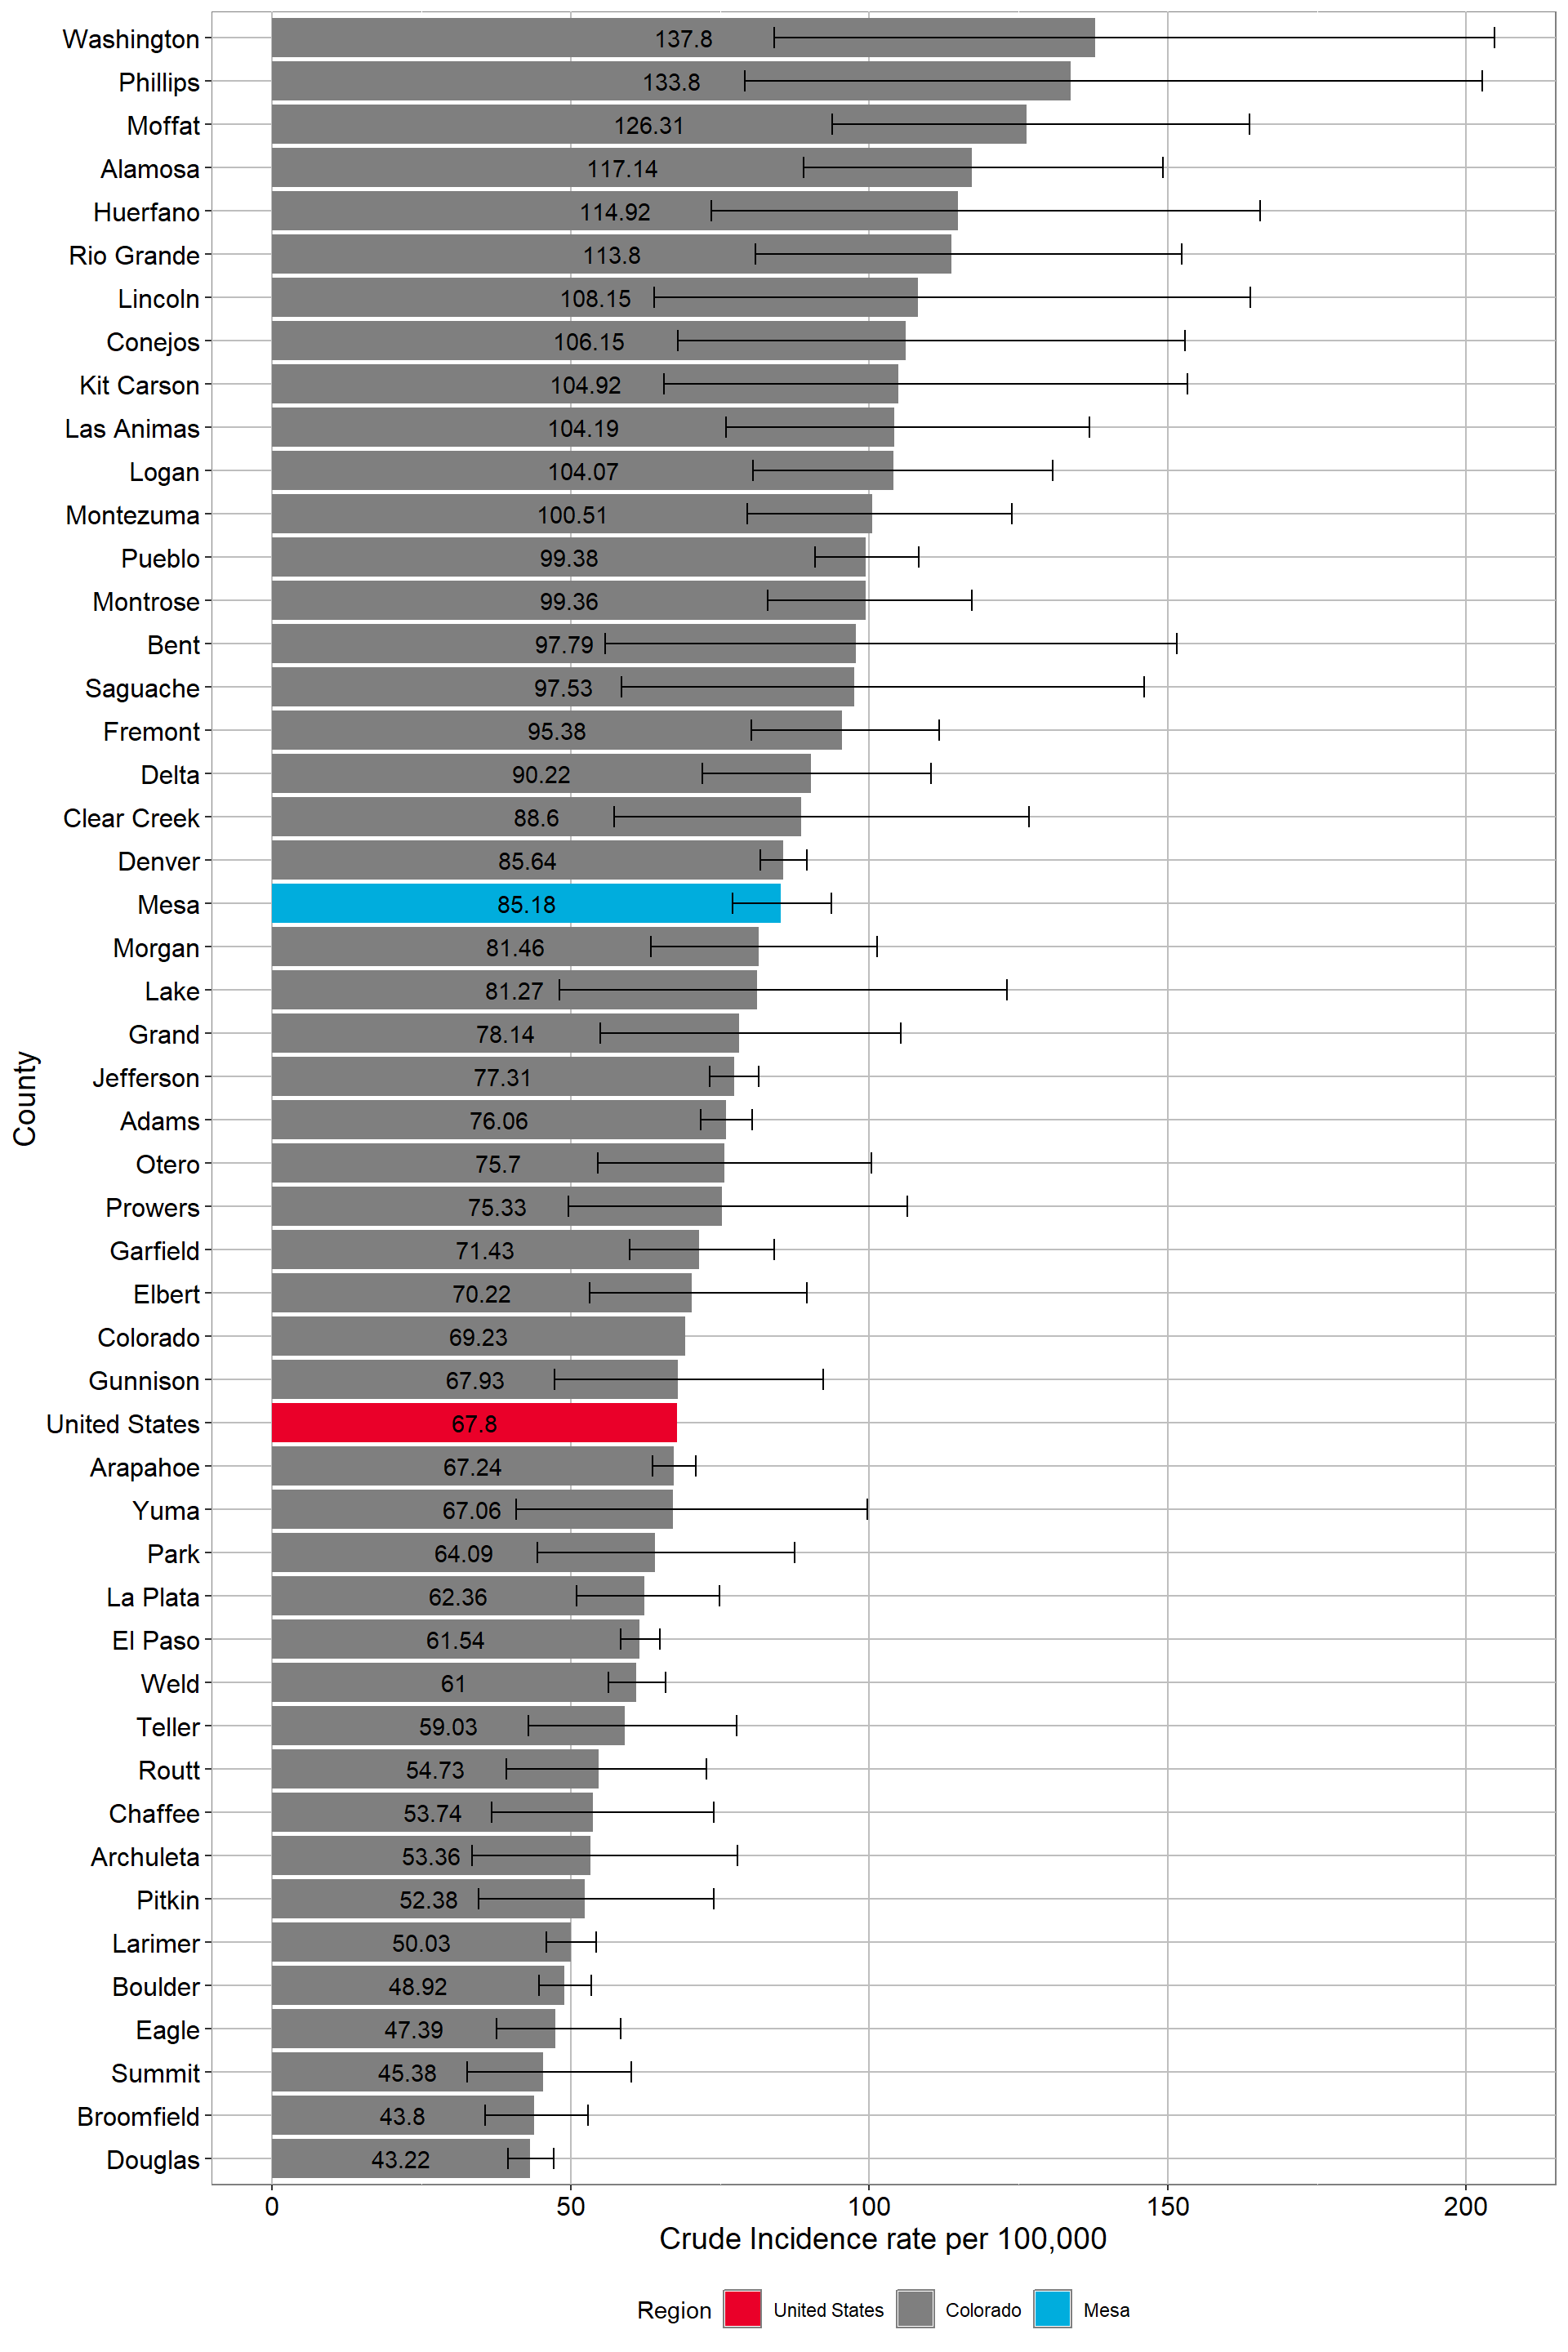
Crude Incidence Rates for Accidental Deaths
All Counties
| Region | Crude Rate | LCL95 | UCL95 | |
|---|---|---|---|---|
| 2 | Adams | 76.06 | 71.81 | 80.43 |
| 3 | Alamosa | 117.14 | 88.94 | 149.20 |
| 4 | Arapahoe | 67.24 | 63.66 | 70.91 |
| 5 | Archuleta | 53.36 | 33.40 | 77.98 |
| 6 | Baca | 125.01 | 66.31 | 202.13 |
| 7 | Bent | 97.79 | 55.76 | 151.55 |
| 8 | Boulder | 48.92 | 44.65 | 53.38 |
| 9 | Broomfield | 43.80 | 35.60 | 52.85 |
| 10 | Chaffee | 53.74 | 36.73 | 73.96 |
| 11 | Cheyenne | 77.19 | 20.09 | 171.30 |
| 12 | Clear Creek | 88.60 | 57.28 | 126.71 |
| 1 | Colorado | 69.23 | NA | NA |
| 13 | Conejos | 106.15 | 67.95 | 152.84 |
| 14 | Costilla | 121.12 | 64.25 | 195.85 |
| 15 | Crowley | 81.11 | 44.19 | 129.13 |
| 16 | Custer | 92.59 | 50.45 | 147.40 |
| 17 | Delta | 90.22 | 72.06 | 110.40 |
| 18 | Denver | 85.64 | 81.77 | 89.60 |
| 19 | Dolores | 109.31 | 43.35 | 205.19 |
| 20 | Douglas | 43.22 | 39.44 | 47.18 |
| 21 | Eagle | 47.39 | 37.52 | 58.41 |
| 22 | El Paso | 61.54 | 58.32 | 64.86 |
| 23 | Elbert | 70.22 | 53.18 | 89.62 |
| 24 | Fremont | 95.38 | 80.29 | 111.76 |
| 25 | Garfield | 71.43 | 59.81 | 84.08 |
| 26 | Gilpin | 51.11 | 23.18 | 89.94 |
| 27 | Grand | 78.14 | 54.99 | 105.33 |
| 28 | Gunnison | 67.93 | 47.30 | 92.29 |
| 29 | Hinsdale | 127.77 | 24.11 | 313.01 |
| 30 | Huerfano | 114.92 | 73.56 | 165.46 |
| 31 | Jackson | 74.09 | 13.98 | 181.57 |
| 32 | Jefferson | 77.31 | 73.24 | 81.50 |
| 33 | Kiowa | 115.37 | 36.45 | 238.52 |
| 34 | Kit Carson | 104.92 | 65.67 | 153.31 |
| 35 | La Plata | 62.36 | 51.00 | 74.85 |
| 36 | Lake | 81.27 | 48.07 | 123.12 |
| 37 | Larimer | 50.03 | 45.92 | 54.31 |
| 38 | Las Animas | 104.19 | 75.99 | 136.84 |
| 39 | Lincoln | 108.15 | 63.98 | 163.85 |
| 40 | Logan | 104.07 | 80.49 | 130.68 |
| 41 | Mesa | 85.18 | 77.06 | 93.71 |
| 42 | Mineral | NA | NA | NA |
| 43 | Moffat | 126.31 | 93.74 | 163.72 |
| 44 | Montezuma | 100.51 | 79.58 | 123.89 |
| 45 | Montrose | 99.36 | 82.96 | 117.23 |
| 46 | Morgan | 81.46 | 63.46 | 101.25 |
| 47 | Otero | 75.70 | 54.54 | 100.31 |
| 48 | Ouray | 79.93 | 41.11 | 131.51 |
| 49 | Park | 64.09 | 44.36 | 87.44 |
| 50 | Phillips | 133.80 | 79.15 | 202.69 |
| 51 | Pitkin | 52.38 | 34.49 | 73.99 |
| 52 | Prowers | 75.33 | 49.60 | 106.41 |
| 53 | Pueblo | 99.38 | 90.90 | 108.24 |
| 54 | Rio Blanco | 66.59 | 35.32 | 107.69 |
| 55 | Rio Grande | 113.80 | 80.90 | 152.29 |
| 56 | Routt | 54.73 | 39.26 | 72.76 |
| 57 | Saguache | 97.53 | 58.53 | 146.05 |
| 58 | San Juan | NA | NA | NA |
| 59 | San Miguel | 58.04 | 31.62 | 92.40 |
| 60 | Sedgwick | 71.25 | 22.49 | 147.33 |
| 61 | Summit | 45.38 | 32.69 | 60.13 |
| 62 | Teller | 59.03 | 42.88 | 77.76 |
| 66 | United States | 67.80 | NA | NA |
| 63 | Washington | 137.80 | 84.05 | 204.75 |
| 64 | Weld | 61.00 | 56.30 | 65.88 |
| 65 | Yuma | 67.06 | 40.89 | 99.65 |
References
1.
Colorado Department of Public Health and Environment, Healthy Kids Colorado Survey 2021
2.
Colorado Department of Public Health and Environment, Healthy Kids Colorado Survey 2015-2022
3.
Mesa County Valley School District 51, Panorama Student Wellness Survey, Data Request, 2023
4.
Colorado Department of Public Health and Environment: Behavioral Risk Factor Surveillance System, 2015-2022Data Request
6.
Colorado Department of Public Health and Environment, Overdose Prevention Data Dashboard, 2020-2022
7.
Colorado Department of Public Health and Environment, Colorado Health Information Dataset - Cancer Incidence, 2021
8.
Colorado Department of Public Health and Environment, Colorado Electronic Disease Reporting System (CEDRS), Data Request, 2019-2023
9.
Colorado Department of Public Health and Environment, Vital Statistics Program, Mortality Data, Data Request, 2020-2022
10.
Roerecke M, Vafaei A, Hasan OSM, Chrystoja BR, Cruz M, Lee R, Neuman MG, Rehm J. Alcohol Consumption and Risk of Liver Cirrhosis: A Systematic Review and Meta-Analysis. Am J Gastroenterol. 2019
11.
Cleveland Clinic News, 90 Percent of Heart Disease is Preventable through Healthier Diet, Regular Exercise, and Not Smoking, 2021
12.
Magkos, F, et al. Diet and exercise in the prevention and treatment of type 2 diabetes mellitus. Nat Rev Endocrinol. 2020
13.
Colorado Department of Public Health and Environment, Colorado Health Information Dataset - Death Statistics, 2020-2022
14.
U.S. Centers for Disease Control and Prevention, Health Disparities in Suicide, January 2024
15.
Mesa County Coroner’s Office, Suicide Death Investigation Data, Data Request, 2020-2022
16.
Miller M, et al. Suicide mortality in the United States: the importance of attending to method in understanding population-level disparities in the burden of suicide. Annu Rev Public Health. 2012
17.
Anglemyer A, et al. The accessibility of firearms and risk for suicide and homicide victimization among household members: a systematic review and meta-analysis. Ann Intern Med. 2014
18.
Colorado Department of Public Health and Environment, Suicide Statistics, 2004-2022
19.
Caves Sivaraman JJ, Naumann RB. Estimating the association between mental health disorders and suicide: a review of common sources of bias and challenges and opportunities for US-based research. Curr Epidemiol Rep. 2020