Economic Stability
Introduction
Economic stability “… allows families and individuals to purchase health insurance and medical care, but also provides options for healthy lifestyle choices. Poor families and individuals are most likely to live in unsafe homes and neighborhoods, often with limited access to healthy foods, employment options, and quality schools.”
County Health Rankings & Roadmaps
In Mesa County, Economic Stability is a key priority for dozens of local agencies and nonprofits who support employment, housing, food security, and more in an effort to create a stable financial base from which households can make healthy choices and thrive.
While many people enjoy financial stability in Mesa County, others struggle to reach economic self-sufficiency. Thousands of families and individuals live in poverty, and in addition, some find themselves fully employed and still without the economic means to meet their basic needs. Some groups are more likely to experience poverty, including people of color, female single parents, and children.
However, enrollment in benefit programs can help close the gap for eligible families, and childhood poverty has steadily decreased in the past decade
Household Economic Stability
Household economic stability is an important factor for health outcomes because healthy behaviors depend on adequate financial resources to meet basic needs, access health care and nutritious foods, and ensure safe and healthy environments.
 Your Voice
When asked to rank a list of 15 priorities for county leadership to focus on, Mesa County residents ranked family economic stability third overall. People of color and people with less than $35,000 in household income ranked it their top priority.
Source: Mesa County Tell Us Community Survey, 2022
In addition, many health outcomes improve as income and household economic stability increase.
In Mesa County, many households enjoy economic self-sufficiency and the flexibility and autonomy it provides in creating a healthy lifestyle. However, many households fall below this threshold, and support programs can be one way to help close the gap.
Economic self-sufficiency
Economic self-sufficiency refers to the level of income required by a working family to meet the expenses of basic necessities, while also allowing for a small savings.
The Self-Sufficiency Standard is a tool that helps us understand how these incomes vary for different types of families. This is based on the costs in a given community, the number of working adults, and the ages of any children.
We highlight the self-sufficiency standard for a various Mesa County household types. We also highlight their median income, which is how much an average household is earning.
These household types were selected because together they represent more than two-thirds of Mesa County residents, and highlight some households known to be most vulnerable to economic instability, such as female single parent families and older adults living alone.
Median income shows what a household in the middle is earning; 50% of households earn more, and 50% earn less. In every household category, even those where median income is high, some households will be struggling to reach self- sufficiency. In categories where the median household income is below self sufficiency, it indicates that more than half of households are struggling to reach stability.
Household profiles in stability
The Self Sufficiency Standard
The Self-Sufficiency Standard for households with children is based on caring for one preschooler and one school-age child.
Median Household Income
Median Household Income, as calculated by the census bureau, includes both earnings and benefits that function as cash equivalents, such as SNAP.
 Self-Sufficiency Resources & Data
Married Adults Self-Sufficiency Income
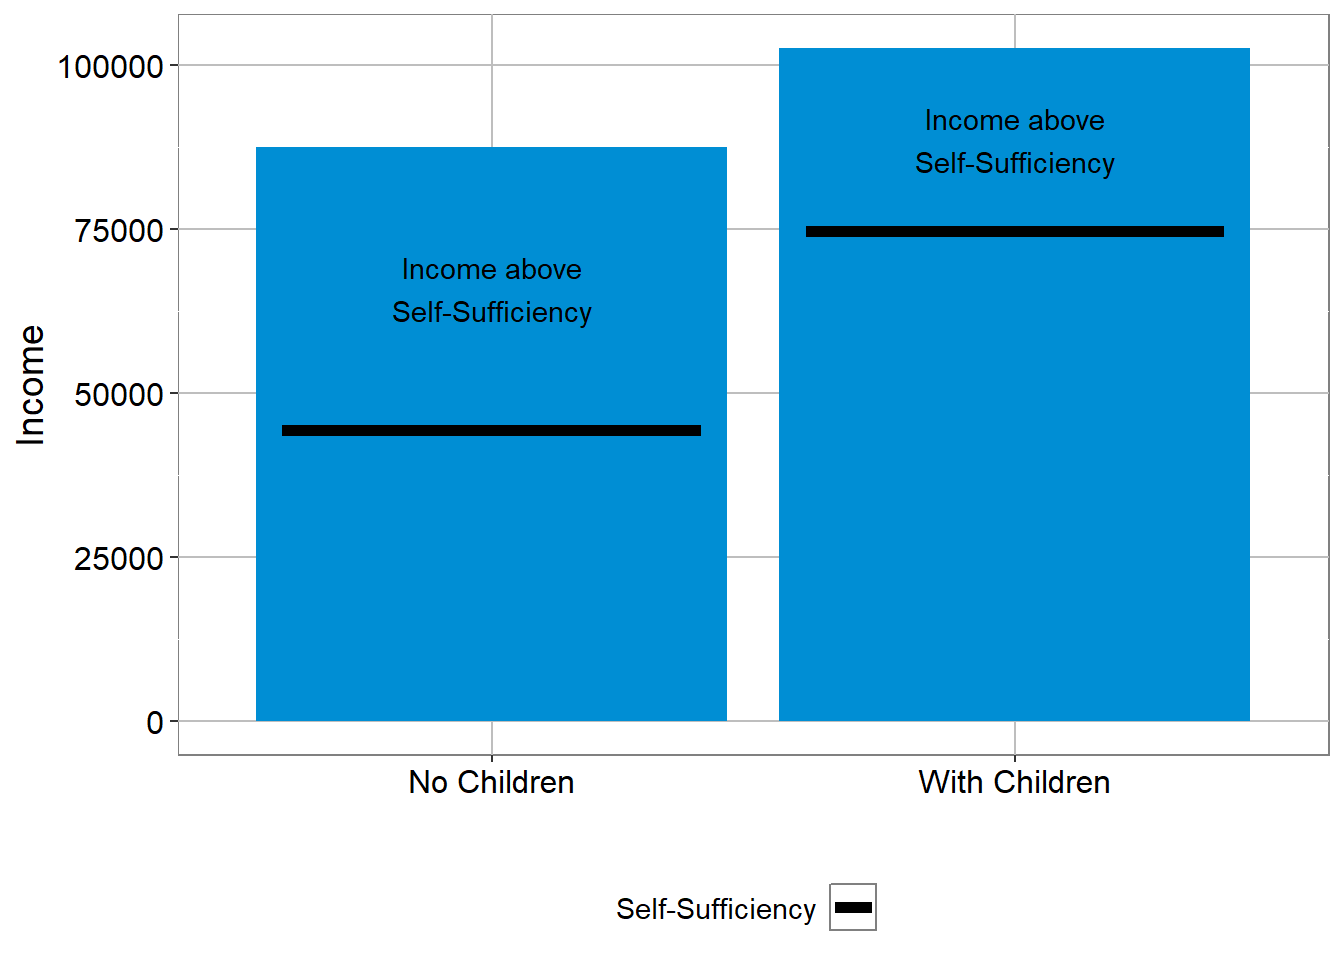
Households with married adults in Mesa County tend to earn more than the income needed for self-sufficiency.
MEDIAN INCOME & SELF-SUFFICIENCY
Married Adults
MEDIAN INCOME & SELF-SUFFICIENCY
Married Adults
| Married Adults | No Children | With Children |
|---|---|---|
| Median Household Income | ~87,500 | 102,562 |
| Self-Sufficiency Income | 44,289 | 74,658 |
| Income above Self-Sufficiency | ~43,211 | 27,904 |
Source: U.S. Census American Community Survey Microdata and The Self-Sufficiency Standard - Colorado 2022
Married Adults Data
Median income is for women only, due to limitations in Census reporting.
Female Single Parent Self-Sufficiency Income
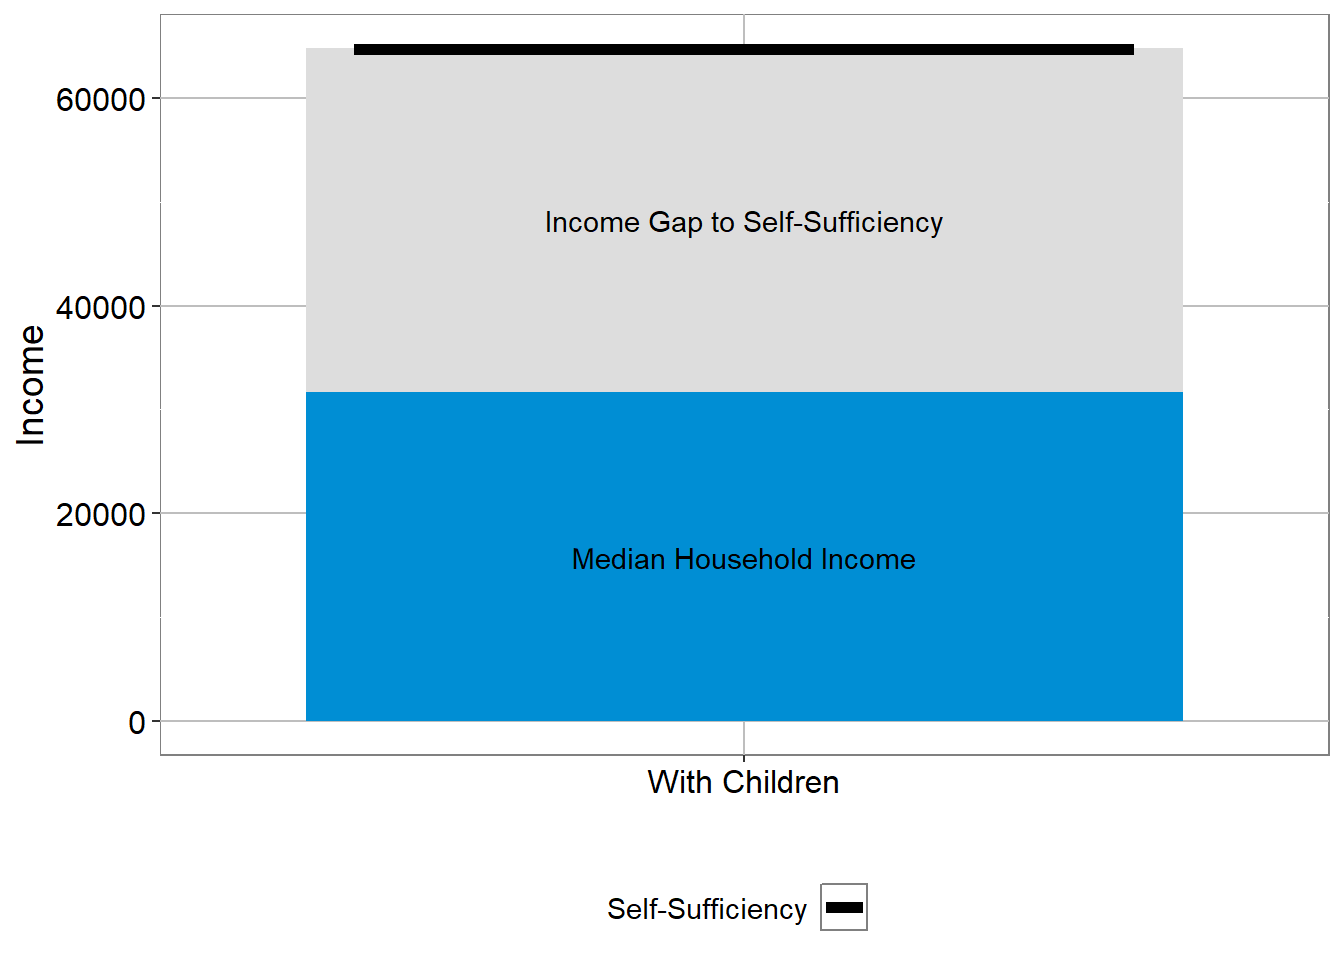
Female single parents earn less than half the income needed for self-sufficiency.
MEDIAN INCOME & SELF-SUFFICIENCY
Female Single Parent
MEDIAN INCOME & SELF-SUFFICIENCY
Female Single Parent
| Female Single Parent | With Children |
|---|---|
| Median Household Income | 31,661 |
| Self - Sufficiency Income | 64,730 |
| Gap to Self - Sufficiency | 33,138 |
Source: U.S. Census American Community Survey Microdata and The Self-Sufficiency Standard - Colorado 2022
Single Adult, over 65 years
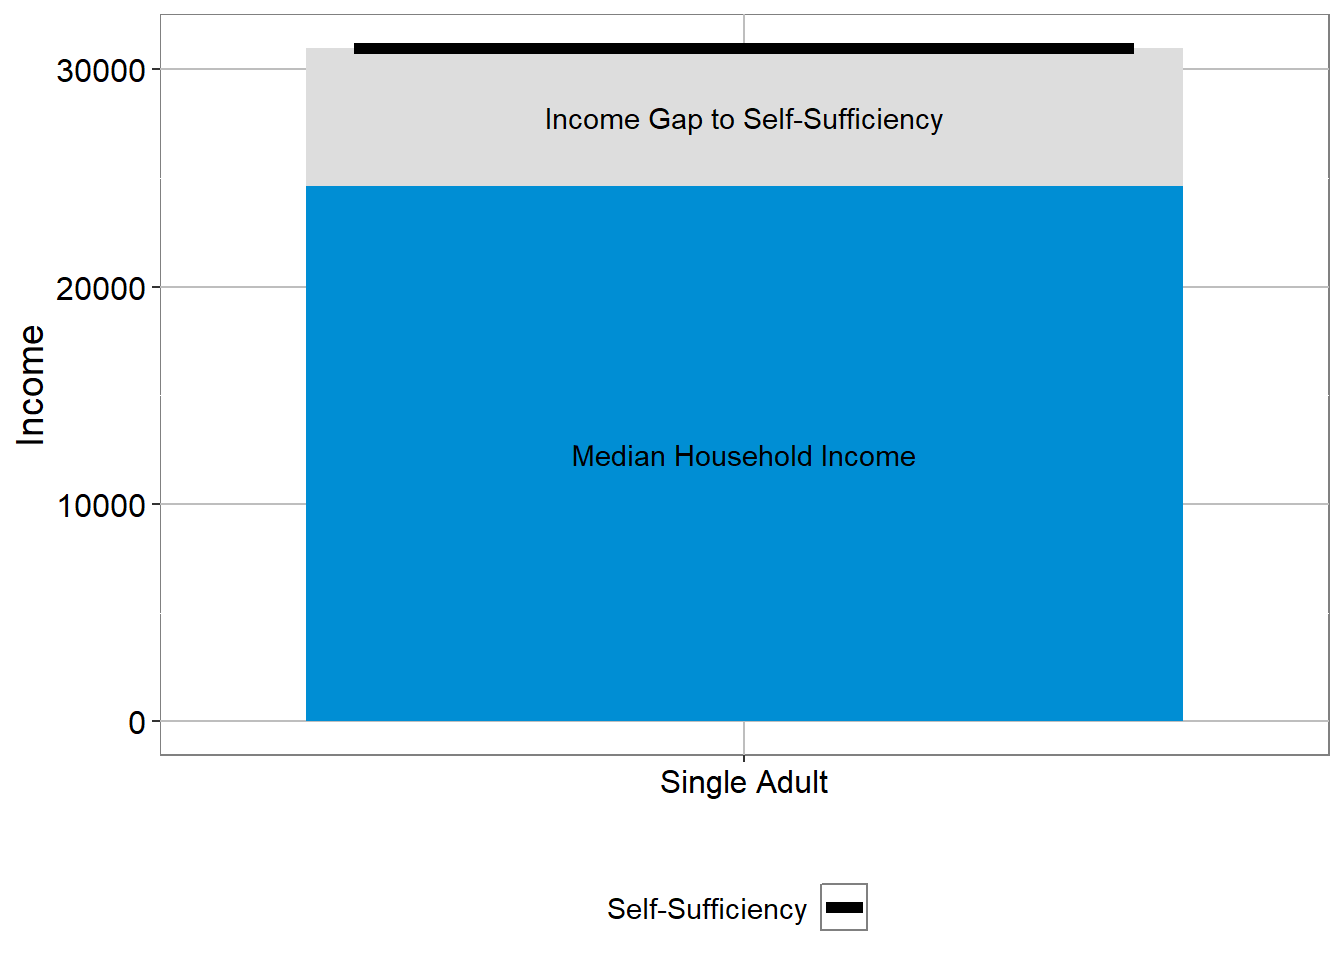
Single adults over 65 earn only 80% of the income needed for self-sufficiency. This is especially concerning given the prevalence of fixed incomes in this group.
MEDIAN INCOME & SELF-SUFFICIENCY
Single Adult over 65
MEDIAN INCOME & SELF-SUFFICIENCY
Single Adult over 65
| Single Adult over 65 years | |
|---|---|
| Median Household Income[^note_as65p] | 24,603 |
| Self - Sufficiency Income | 30,985 |
| Gap to Self - Sufficiency | 6,382 |
Source: U.S. Census American Community Survey Microdata and The Self-Sufficiency Standard - Colorado 2022
Hispanic and Latino Households
Data on household earnings and income for new moms suggests that Hispanic or Latino households in Mesa County earn approximately $10,000-15,000 less than their non-Hispanic counterparts. This suggests that Hispanic or Latino households are more likely to earn below the self-sufficiency income.
Closing the Gap to Self-Sufficiency
Female single parents in Mesa County have much lower incomes than their married counterparts.
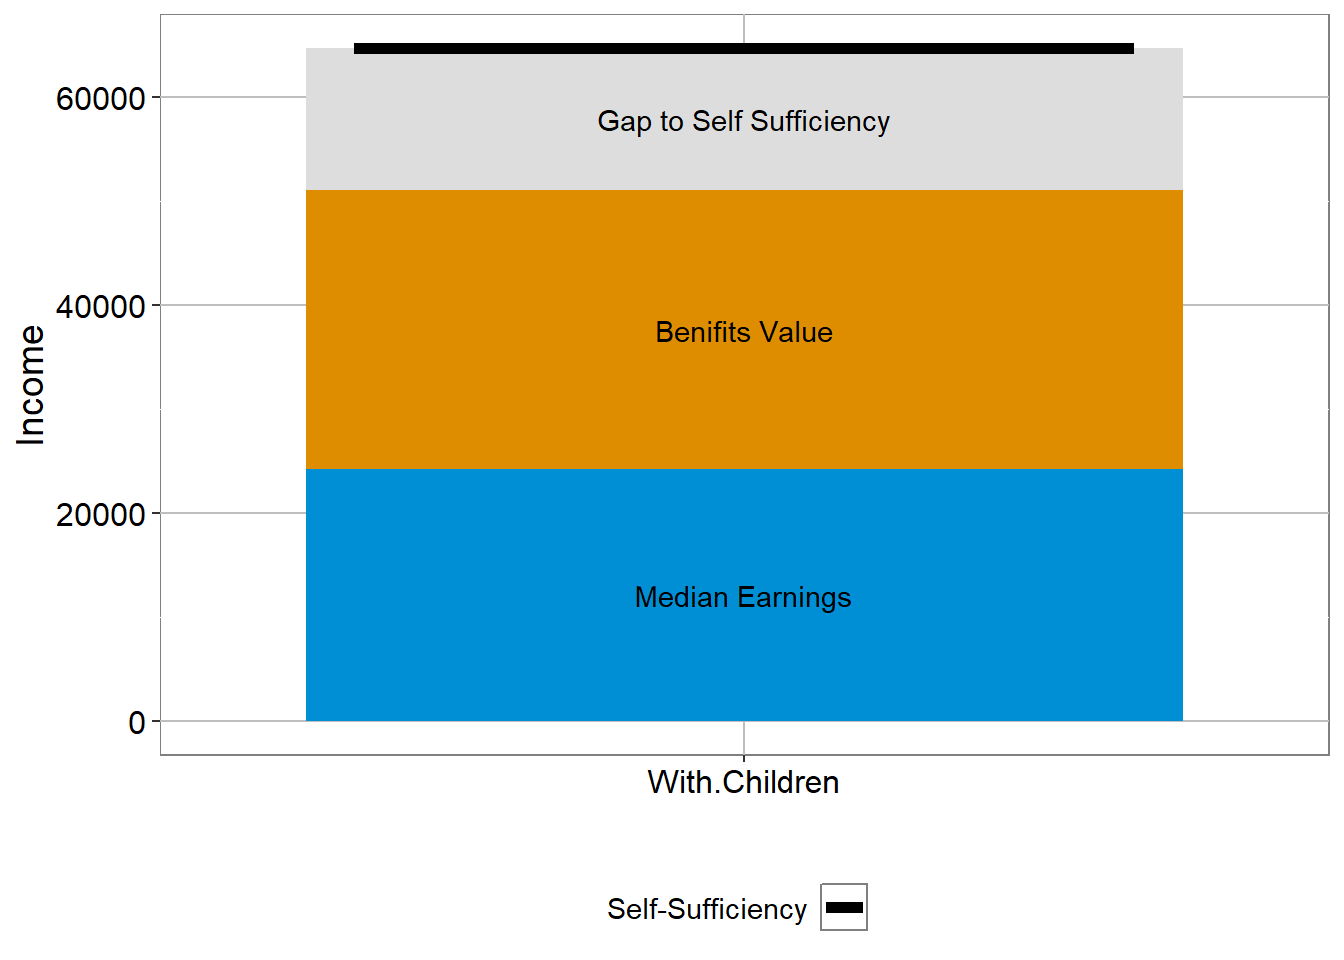
In this chart, we measure only job earnings and see that enrollment in benefits programs designed to build economic stability significantly reduces the gap.
This chart shows the impact of enrolling a female single parent household with one preschooler in SNAP, WIC, CCCAP, UPK, LEAP, and Medicaid. While the household isn’t quite self-sufficient, they move from 37% of the self sufficiency standard income to 79% of it.
GAP TO HOUSEHOLD STABILITY
Female Single Parent Households With Children
GAP TO HOUSEHOLD STABILITY
Female Single Parent Households With Children
| Female Single Parent | With Children |
|---|---|
| Median Earnings | 24,217 |
| Benifit value | 26,842 |
| Self-Sufficiency | 64,730 |
| Gap to Self Sufficiency | 13,671 |
Source: U.S. Census American Community Survey Microdata, The Self-Sufficiency Standard - Colorado 2022, AND Department of Human Services benefit amounts
Poverty
Child Poverty
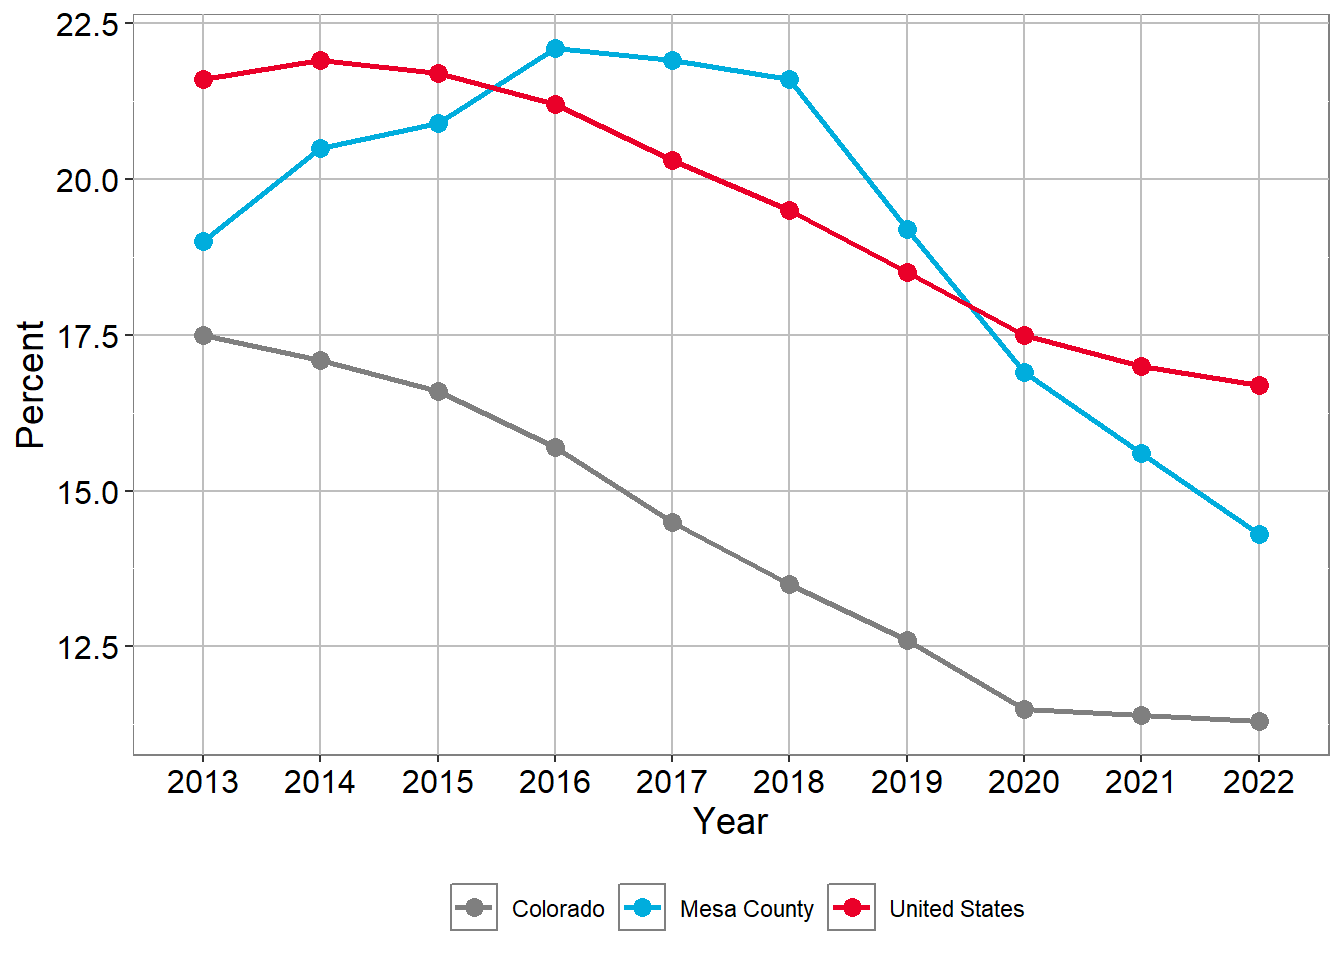
Childhood poverty has decreased over time in Mesa County, Colorado, and the U.S. Since 2019, Mesa County’s childhood poverty rate has been comparable to the U.S. rate, and higher than Colorado’s.
CHILDHOOD POVERTY RATES
CHILDHOOD POVERTY RATES
| Region | 2013 | 2014 | 2015 | 2016 | 2017 | 2018 | 2019 | 2020 | 2021 | 2022 | 2023 |
|---|---|---|---|---|---|---|---|---|---|---|---|
| Colorado | 17.5% | 17.1% | 16.6% | 15.7% | 14.5% | 13.5% | 12.6% | 11.5% | 11.4% | 11.3% | 10.9% |
| Mesa County | 19.0% | 20.5% | 20.9% | 22.1% | 21.9% | 21.6% | 19.2% | 16.9% | 15.6% | 14.3% | 13.3% |
| United States | 21.6% | 21.9% | 21.7% | 21.2% | 20.3% | 19.5% | 18.5% | 17.5% | 17.0% | 16.7% | 16.3% |
Source: U.S. Census Bureau, American Community Survey 5-year estimates, Table: A1701; POVERTY STATUS IN THE PAST 12 MONTHS 2023
Characteristics of people in poverty
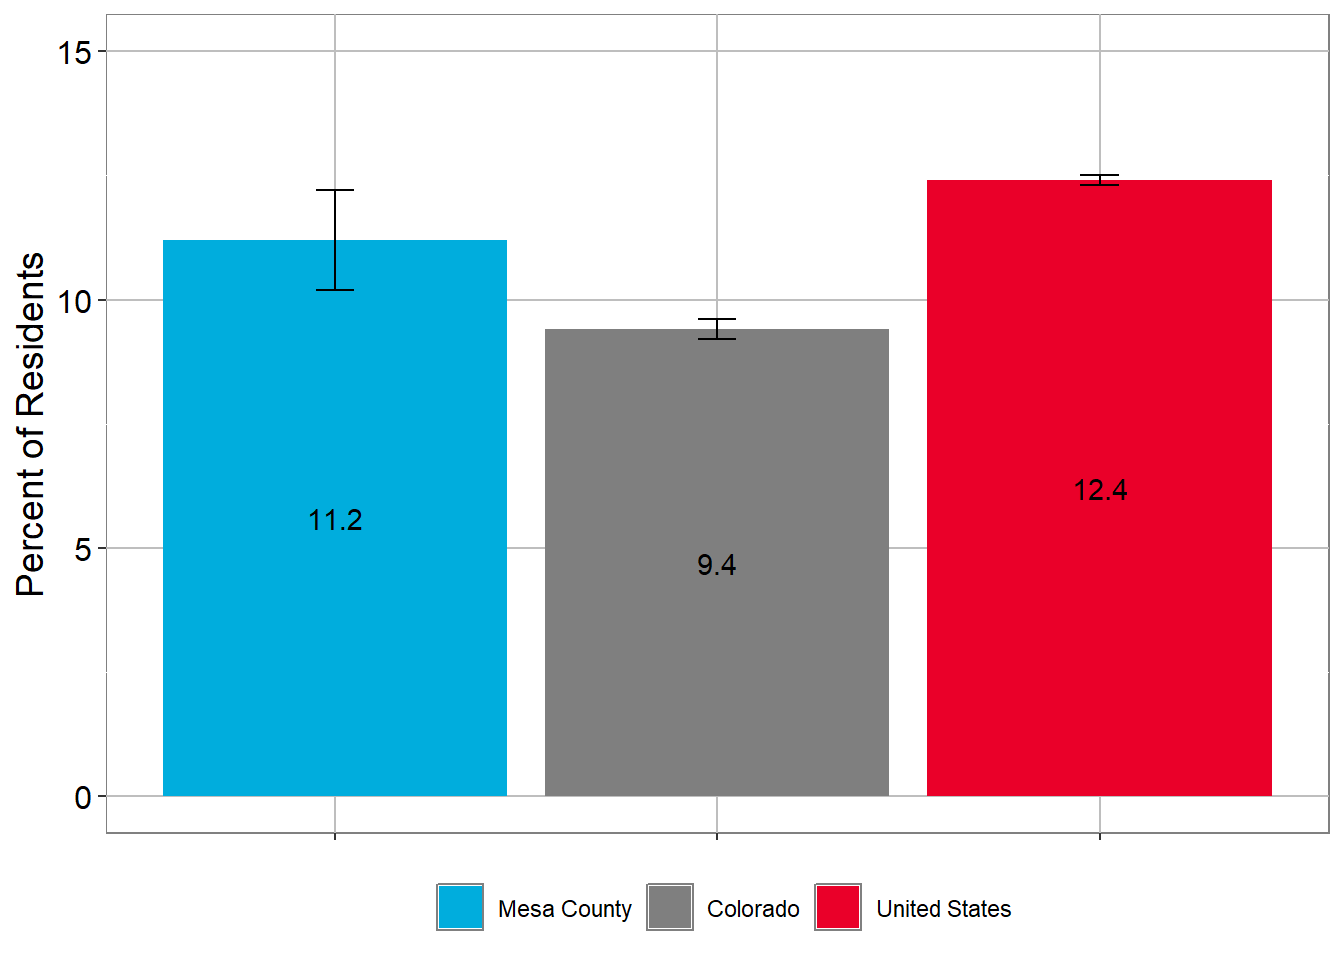
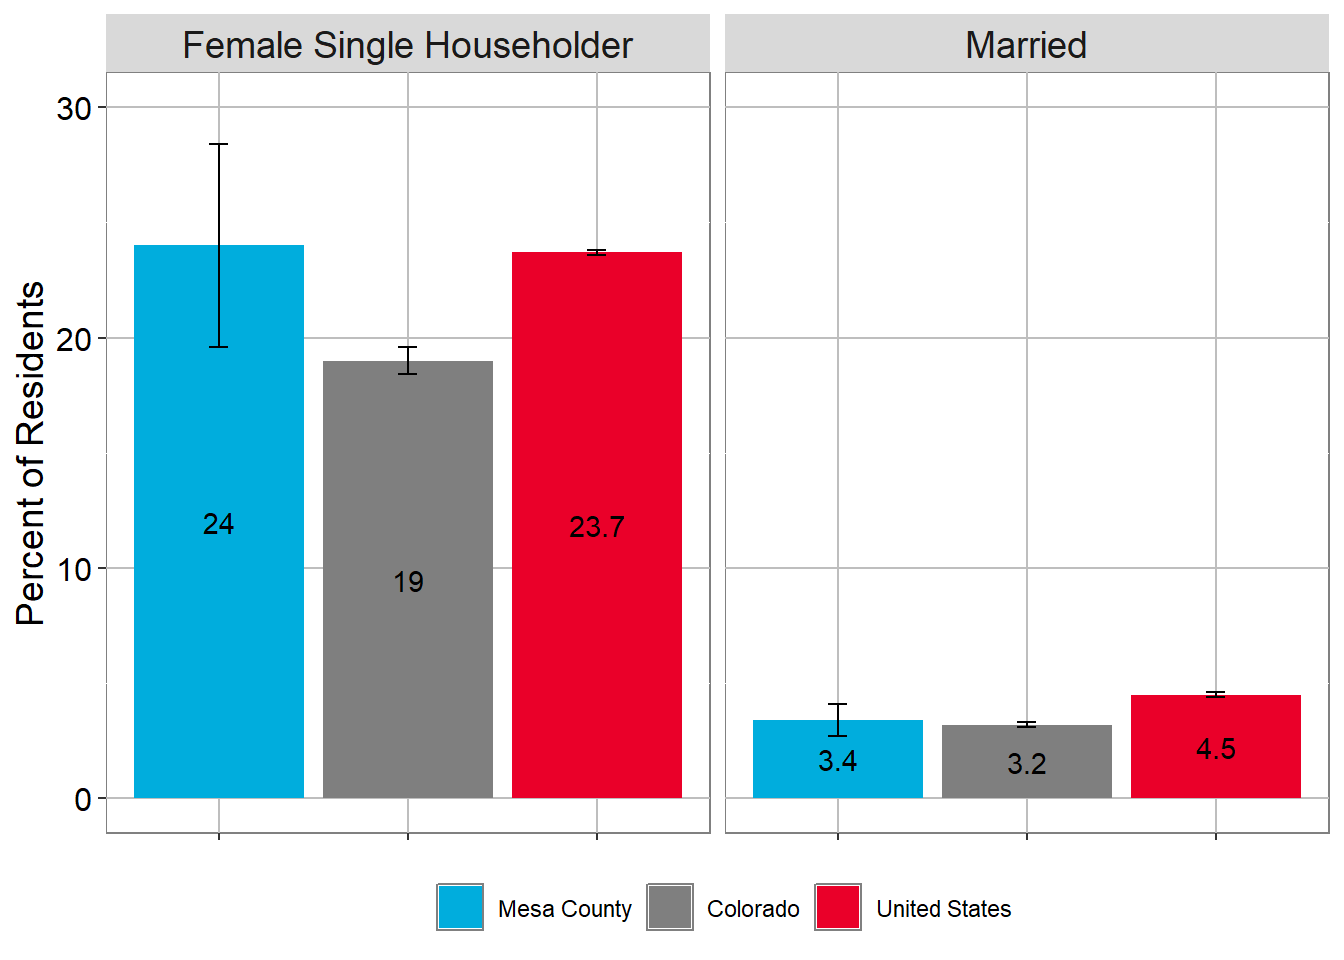
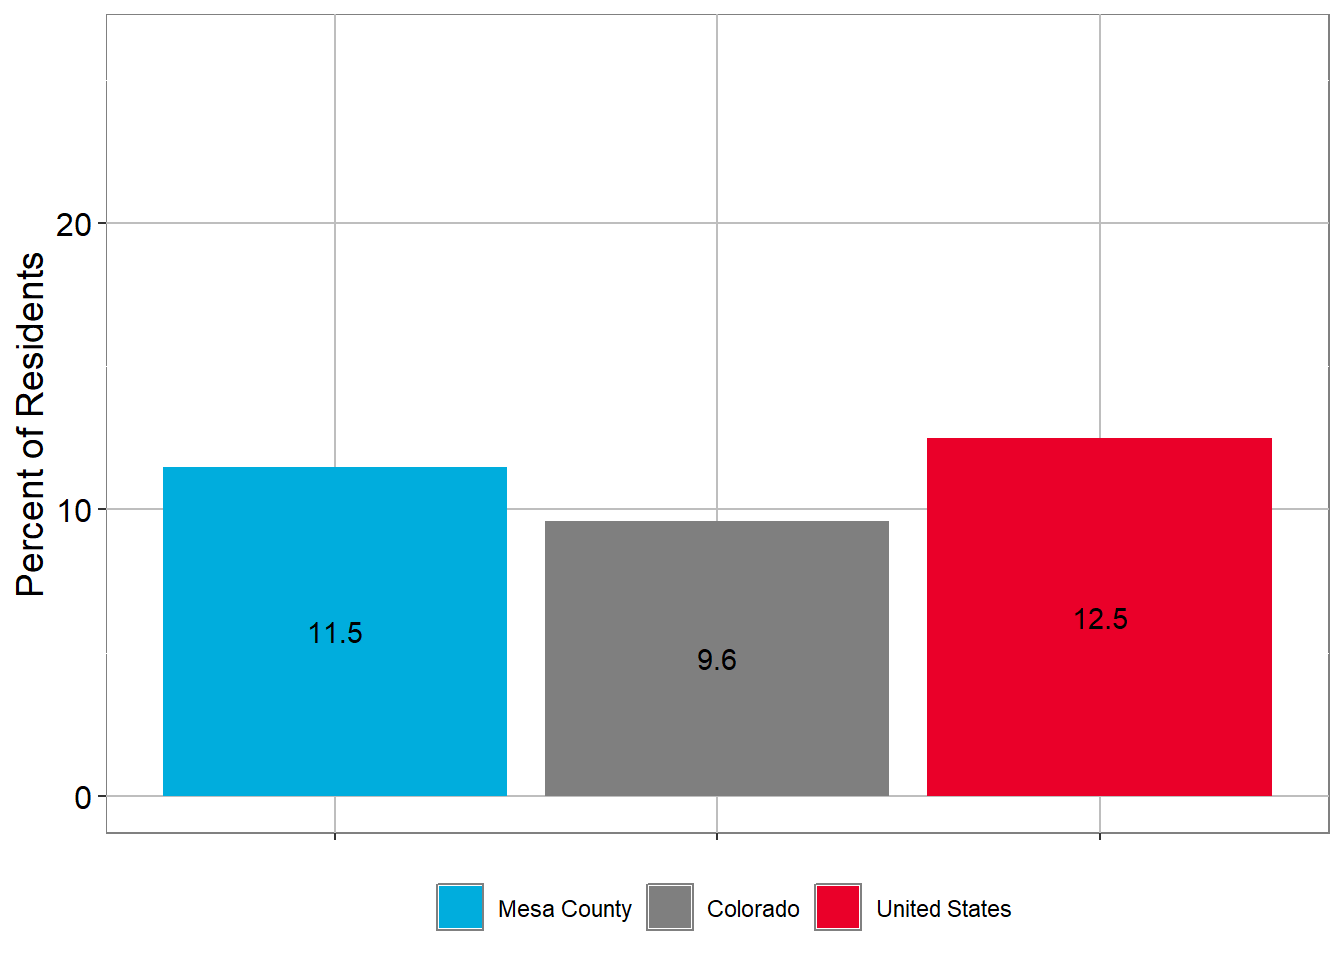
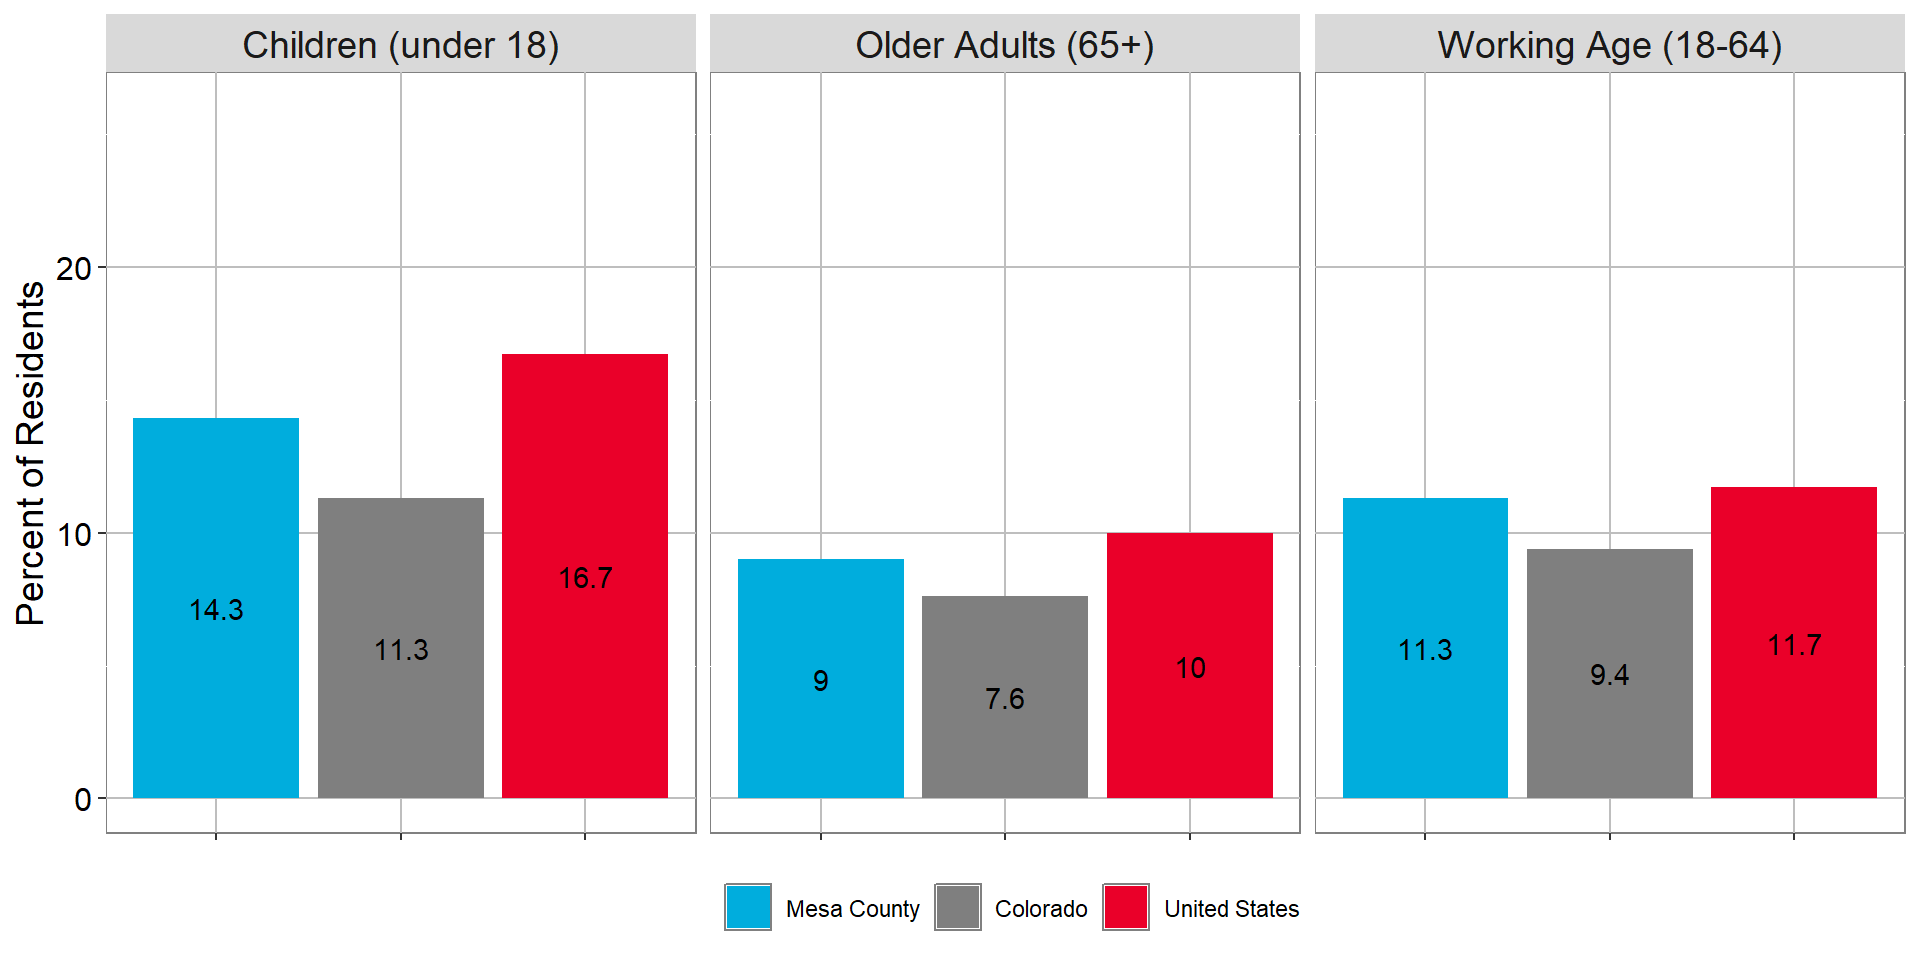
Poverty rates vary by age, gender, family type, and ethnicity in Mesa County. Mesa County poverty rates are higher than Colorado’s for all groups. When compared to the whole U.S., Mesa County is sometimes higher and sometimes lower.
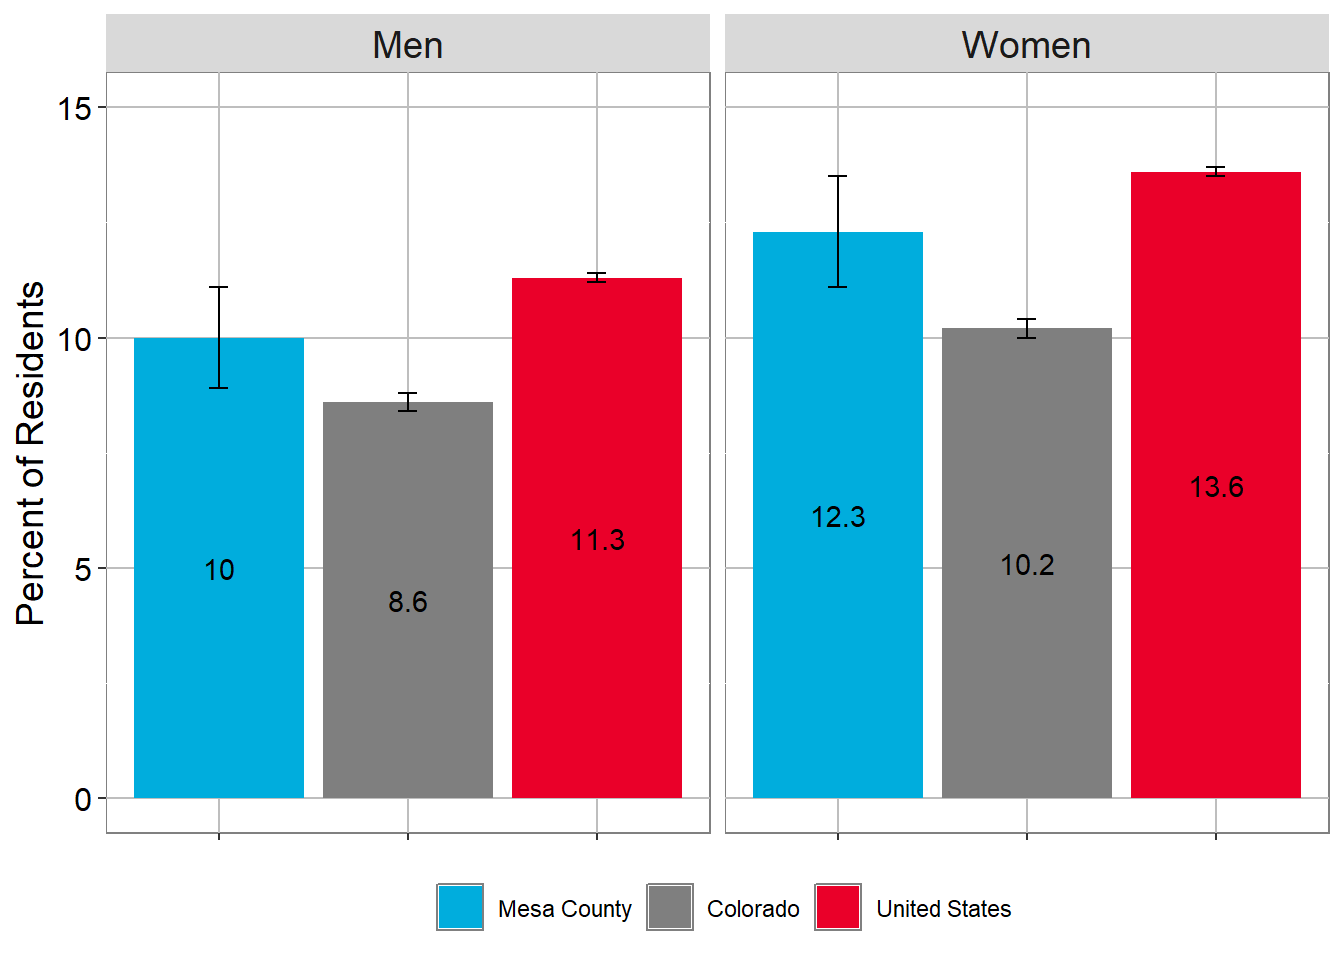
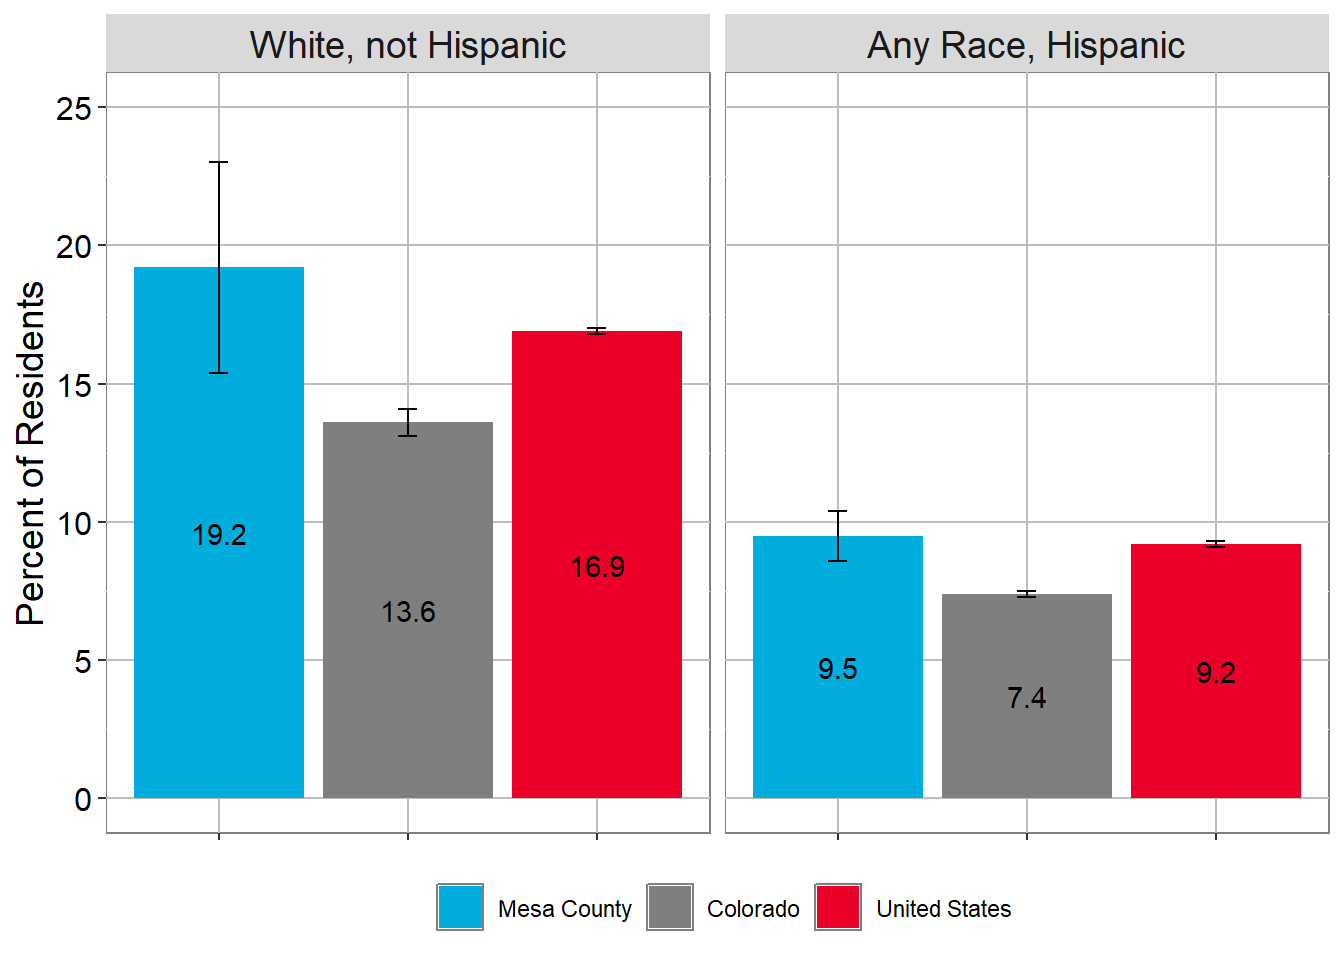
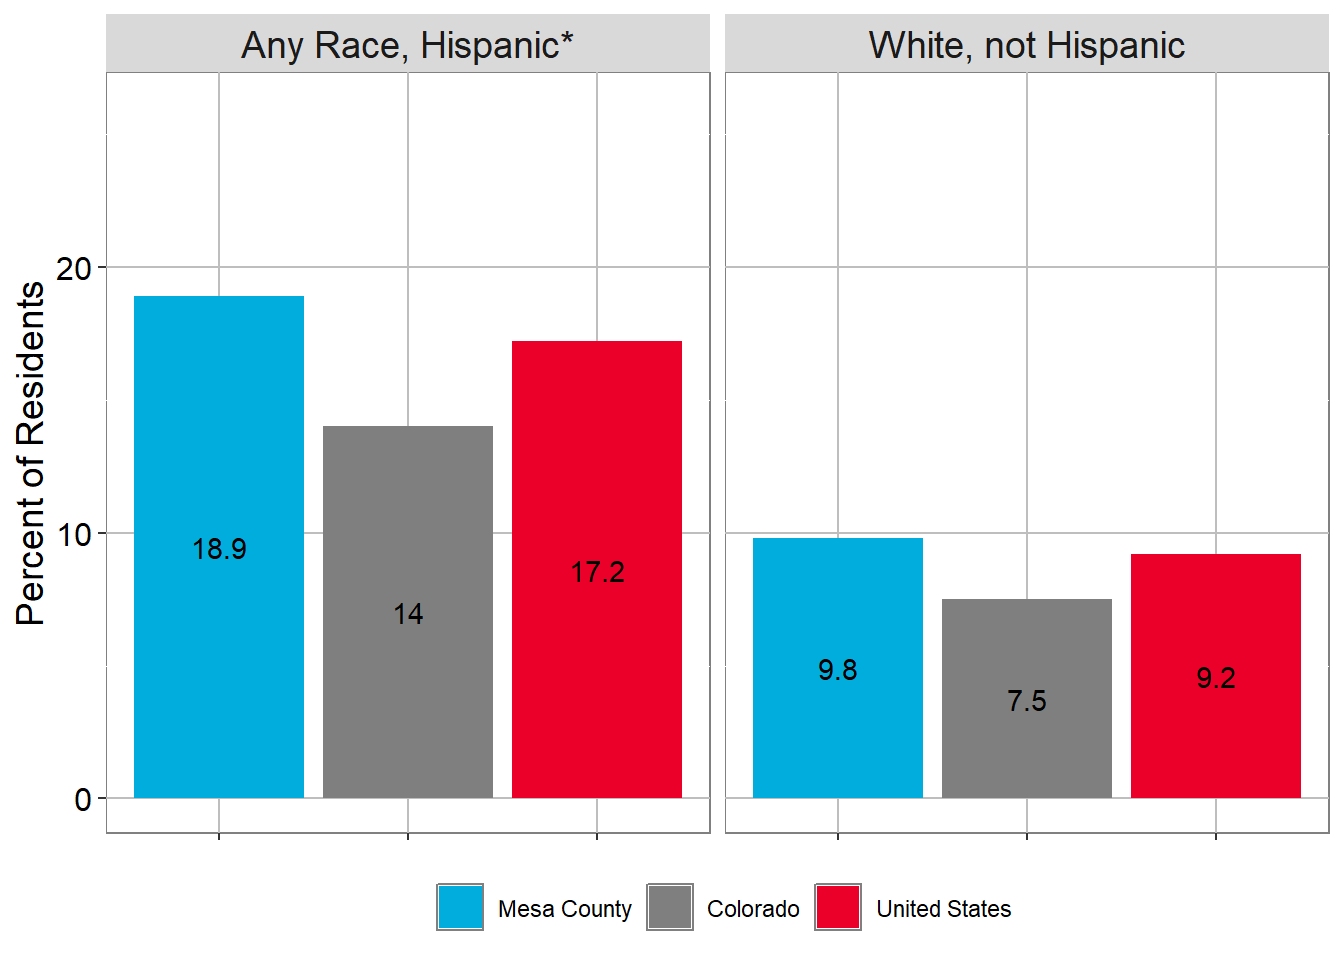
Among age groups, children are the most likely to experience poverty. Hispanic residents are more likely to experience poverty than white non-Hispanic residents, and women are more likely than men. Single female adults have higher rates than adult women in general, and notably higher rates than married households.
POVERTY RATE MESA COUNTY
POVERTY RATE BY GENDER, 2022
POVERTY RATE BY RACE
POVERTY RATE BY HOUSEHOLD TYPE, 2022
POVERTY RATE BY AGE, 2022
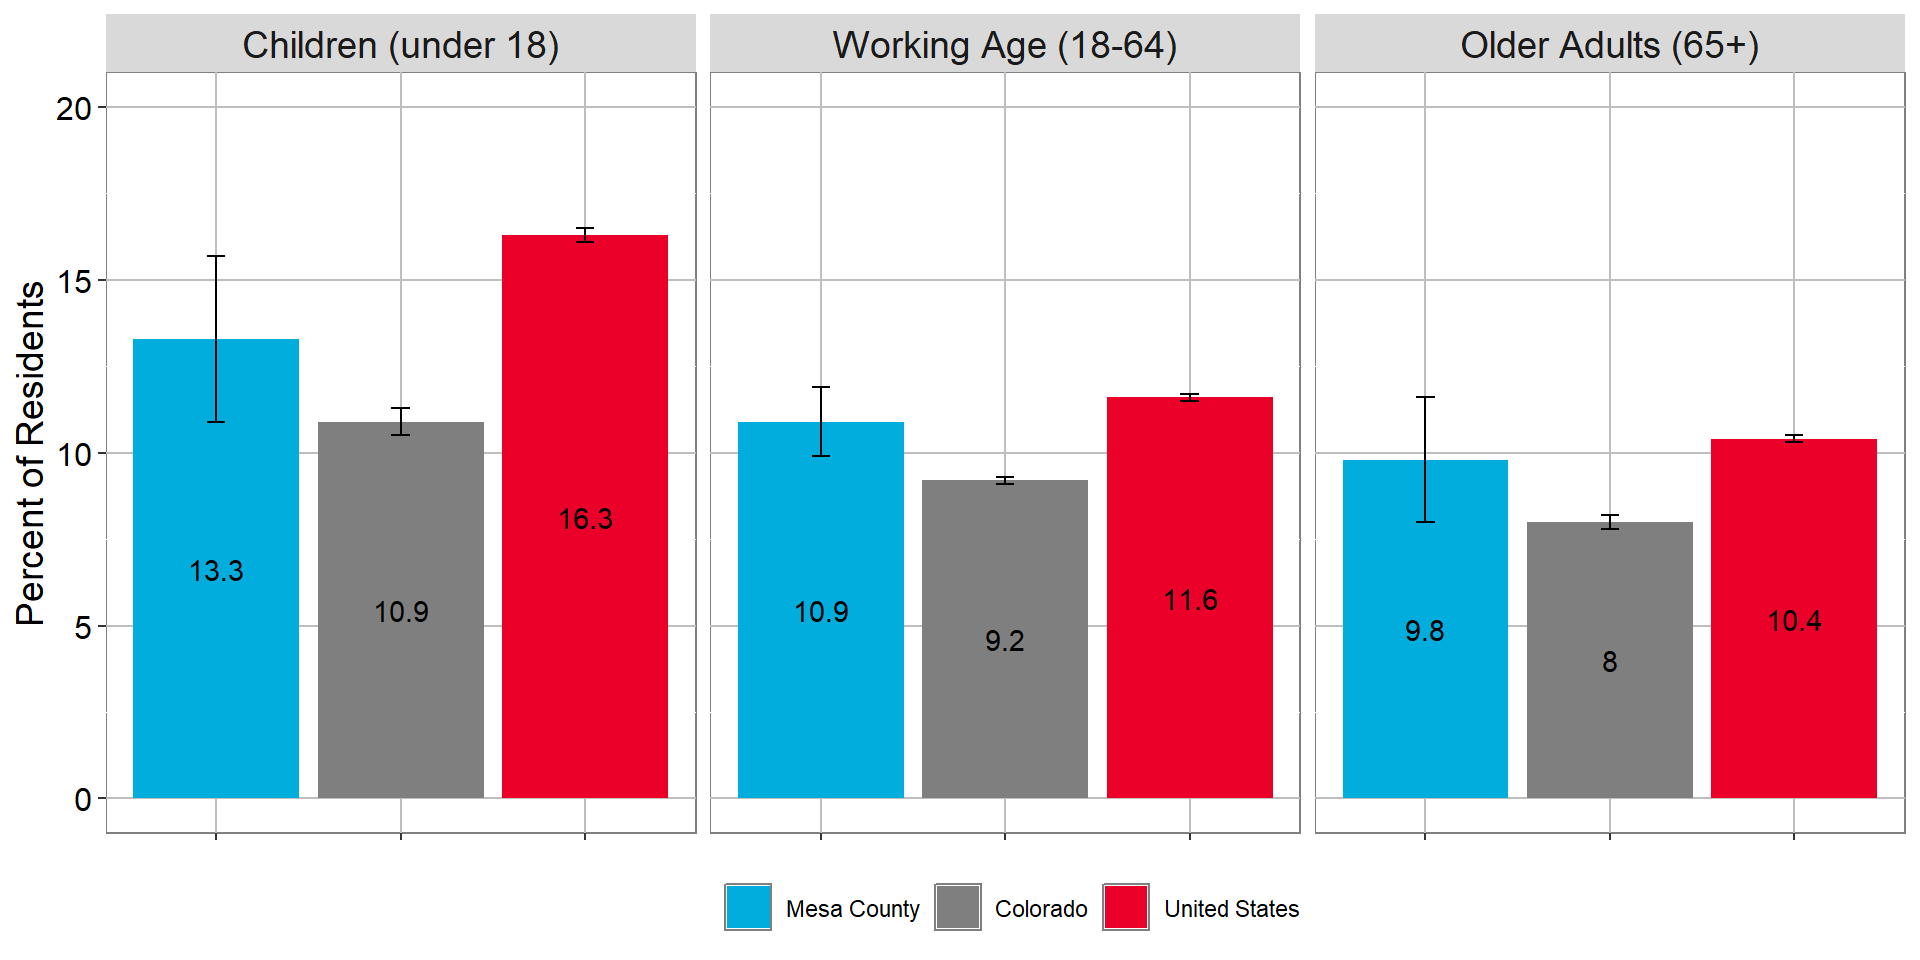
Error bars represent a 90% confidence interval.
POVERTY RATE WITHIN GROUP
| Mesa County | Colorado | United States | |
|---|---|---|---|
| All | 11.2 | 9.4 | 12.4 |
| Men | 10.0 | 8.6 | 11.3 |
| Women | 12.3 | 10.2 | 13.6 |
| White, not Hispanic | 19.2 | 13.6 | 16.9 |
| Any Race, Hispanic | 9.5 | 7.4 | 9.2 |
| Female Single Householder | 24.0 | 19.0 | 23.7 |
| Married | 3.4 | 3.2 | 4.5 |
| Children (under 18) | 13.3 | 10.9 | 16.3 |
| Working Age (18-64) | 10.9 | 9.2 | 11.6 |
| Older Adults (65+) | 9.8 | 8.0 | 10.4 |
Source: U.S. Census Bureau, American Community Survey 5-year estimates, Tables: S1701; POVERTY STATUS IN THE PAST 12 MONTHS, and S1702; POVERTY STATUS OF FAMILIES 2023
Poverty Needs Assessment
In 2024, the Community Services Block Grant Board and Mesa County Public Health conducted an assessment of Mesa County organizations to better understand their perspective on the characteristics, causes, and conditions of poverty in Mesa County.
Fifty-one respondents across seven sectors contributed to this assessment.
- Public Sector or Government,
- Community Based Organization or Non-Profit,
- Medical Health Organization,
- Early Childhood Organization,
- Educational Institution,
- Private Sector or Business,
- Faith Based Organization
Respondents rated how well Mesa County policies, resources, and organizations meet the needs of households experiencing poverty.
Top 5 Needs Met Well:
- Food Security
- Medical Care
- Basic Education
- Employment
- Transportation
Top 5 Needs Met Poorly:
- Housing
- Mental Health Care
- Transportation
- Food Security
- Employment
Connections Between Service
Recent community work has focused on facilitating connections between diverse service providers and people in need to improve awareness and accessibility of services, programs, and resources.
About half of survey respondents who indicated food security, transportation, or employment were met well, also indicated that they were met poorly. This may reflect the causes of poverty theme of “insufficient support networks and safety net gaps.” When we can meet the need, we do it well, but we can’t always meet it.
Most sectors gave similar responses. Some differences were:
- The business and faith community identified child care in their top 3 poorly-met needs
- Educational Institution representatives identified language services in their top three poorly-met needs
Several write-in comments indicated that a cause of poverty was a service provider being overwhelmed. In other words, they are working hard to meet the need well, but can’t meet all of the need.
Another explanation is that resources for these needs may be available, but not accessible, such as produced in multiple languages, or in an accessible location.
Causes of poverty
 Affordable Housing!
Half named a lack of affordable housing as a cause of poverty.
Partners described causes of poverty built on a foundation of lack of resources coupled with mental health challenges, substance use, and barriers to care. In many cases, a person with a strong social network might be able to address these needs and regain financial stability. However, partners noted generational poverty and ineffective support networks as common factors that led to or perpetuated poverty as well.
There was broad agreement about the top three causes of poverty, only three respondents did not include one of these three items in their response. Respondents often listed the overall cost of living in Mesa County as a cause of poverty, and then went on to name specific costs such as housing, food, and child care.
The top 10 causes of poverty identified by community partners:
- Lack of affordable housing
- Mental Health, Substance Use, and Barriers to Care
- Lack of employment opportunities and adequate wages
- Increasing/High cost of living
- Lack of educational opportunities and job skills
- Ineffective support networks and safety net gaps
- Affordable Childcare
- Generational Poverty / Financial Fragility
- Cost of food / medical care / transportation
- Lack of culturally appropriate services (for groups such as Spanish Speakers, Low Income Households, and the Unhoused community)
Conditions of poverty
Partners’ responses regarding the conditions of poverty reinforced the complex nature of poverty. Several of the conditions listed were also common causes of poverty, showing the cyclical nature of poverty.
The top 5 conditions of poverty identified by partners:
- Housing Insecurity
- Food Insecurity
- Family Instability and Cycle of Poverty
- Unmet Mental Health Needs
- Crime
Above, we reported respondents’ top 10 causes of poverty, but the pattern of responses was very different for conditions of poverty. While five topics had broad agreement, with only 4 out of 51 responses not including at least one of these conditions, the remaining conditions were many, varied, and dispersed.
Additional conditions could be categorized as follows. These categories are often not mutually exclusive, making it hard to count and rank them.
- Social Isolation
- Geographic concentration of poverty
- Substance use
- Poor health behaviors and outcomes
- Gaps and barriers in education and job training, leading to fewer job opportunities and lower health literacy
- Challenges for parents and children - Childcare, child abuse, parent health behaviors, unmet parent responsibilities.
- Burdens in the system - Overwhelmed health care system, criminal justice system, education system (trying to provide for children)
The 2022 Tell Us Community Survey conducted by Mesa County Public Health collected responses from over 1,200 Mesa County residents, including 156 from residents who indicated they had less than $35,000 in annual household income.
Low income Representation
Respondents with less than $35,000 of household income were representative of those impacted by poverty in Mesa County. This group included responses from all age groups, ethnicities, levels of education, and political affiliation.
Tell Us Community Survey 2022
Only 16% of low income residents agreed that they have a voice in identifying areas for improvement.
Depending on household size, these respondents may or may not fall below the federal poverty threshold, but regardless of size, these are households that likely struggle with financial stability.
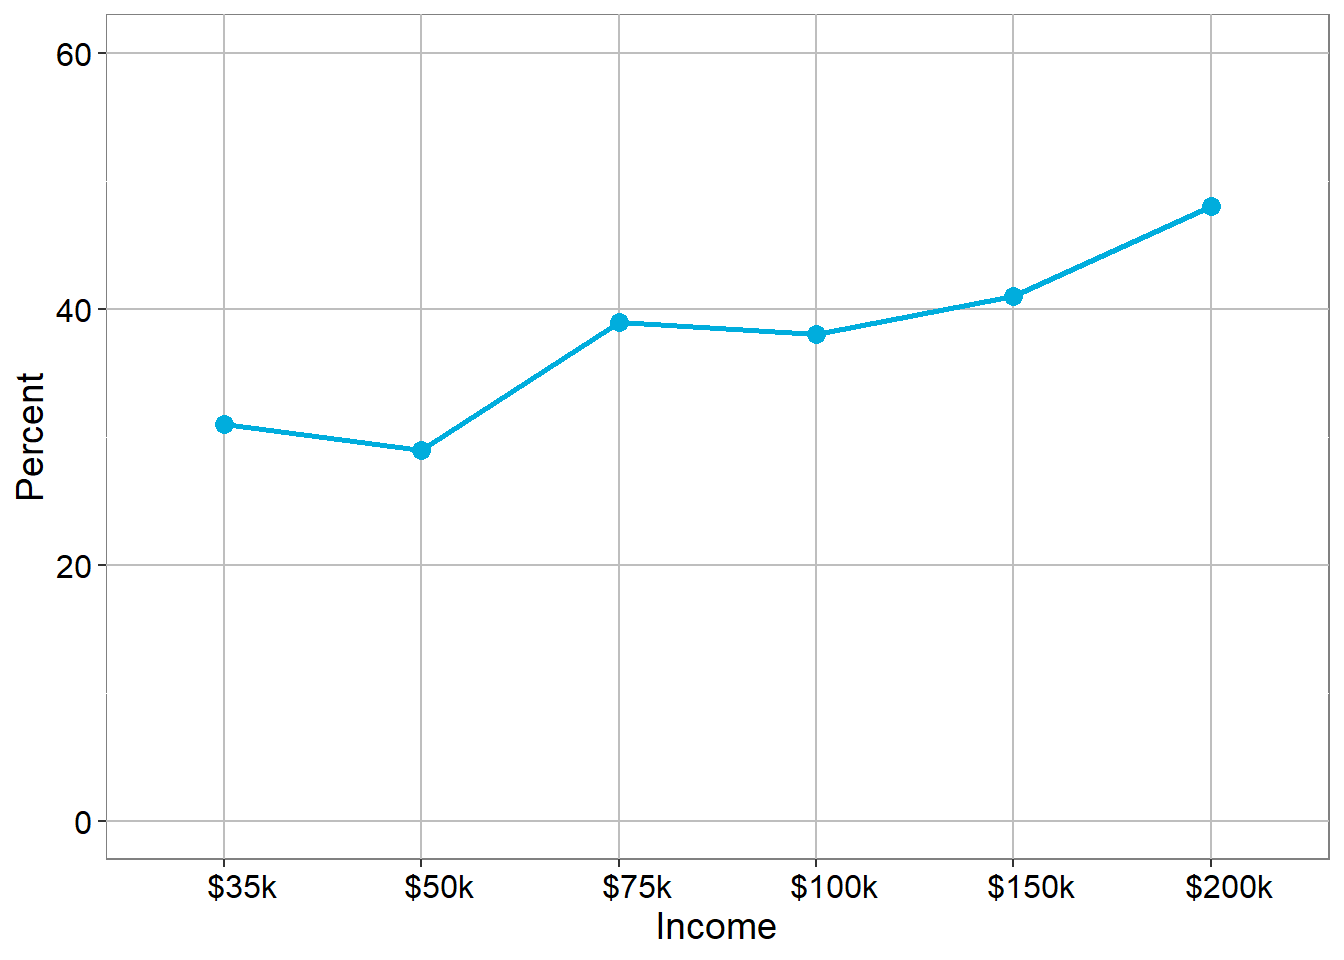
As income increased, satisfaction with basic conditions, including affordable housing, grocery store access, child care access, healthcare access, and safety and security increased as well.
Percent Satisfied with Basic Conditions by Income
Percent Satisfied with Basic Conditions by Income
| Income | Percent Satisfied with Basic Conditions by Income |
|---|---|
| $35k | 31% |
| $50k | 29% |
| $75k | 39% |
| $100k | 38% |
| $150k | 41% |
| $200k | 48% |
Source: Mesa County Tell Us Community Survey, 2022
Income affects residents’ experience with accessing services. Notably, residents who are already experiencing difficulty with their conditions and quality of life have the added struggle of difficulty accessing services.
Percent Agreement with Easy Access to County Services
Percent Agreement with Easy Access to County Services
| Income | Percent Agreement with Easy Access to County Services |
|---|---|
| $35k | 36% |
| $50k | 33% |
| $75k | 42% |
| $100k | 35% |
| $150k | 49% |
| $200k | 52% |
Source: Mesa County Tell Us Community Survey, 2022
Low income respondents indicated lower levels of satisfaction with overall quality of life in Mesa County.
Percent Satisfied with Basic Conditions by Income
Percent Satisfied with Basic Conditions by Income
| Income | Percent Satisfied with basic conditions by Income |
|---|---|
| $35k | 53% |
| $50k | 52% |
| $75k | 59% |
| $100k | 64% |
| $150k | 68% |
| $200k | 74% |
Source: Mesa County Tell Us Community Survey, 2022
Working in Mesa County
Employment and Income
Unemployment
Mesa County, like Colorado and the US, saw a spike in the unemployment rate during the COVID-19 pandemic response. Since then, unemployment has returned to pre-pandemic levels. Mesa County generally has a higher unemployment rate than Colorado, and fairly similar to the U.S.
Mesa County Unemployment Rate
Mesa County Unemployment Rate
| Mesa County | Colorado | United States | |
|---|---|---|---|
| 2018 | 3.9 | 3.1 | 3.9 |
| 2019 | 3.5 | 2.7 | 3.7 |
| 2020 | 7.1 | 6.8 | 8.1 |
| 2021 | 6.1 | 5.5 | 5.4 |
| 2022 | 3.7 | 3.0 | 3.6 |
| 2023 | 3.4 | 3.0 | 3.6 |
Source: U.S. Bureau of Labor Statistics
COVID-19
The unemployment rate has returned to pre-covid levels
Making Percents Real!
In 2023, an unemployment rate of 3.4% in Mesa County represented an average of 2,621 unemployed individuals each month.
According to Healthy People 2030, people who are unemployed experience negative mental and physical health outcomes such as increased rates of anxiety and depression, as well as stress-related illnesses such as heart attack, stroke, and arthritis.
Essential Incomes
In the 2021 Community Health Needs Assessment, we introduced the concept of an Essential Income. While discussing household stability, we showed that different household types have different income requirements in order to be economically self-sufficient. However, the Essential Income represents a wage which would notably raise economic stability across many households and reduce dependence on benefit enrollment to reach self-sufficiency.
In 2021, the Essential Income was $36,400 per year, or $17.50 per hour. This is still a worthwhile target, and many in our community earn below this amount. However, in 2024 this wage has less buying power than it did just three years ago, given increases in the cost of living. Therefore, in 2024, the Essential Income for Mesa County is $20.45 per hour or $42,552 annually, a 16.9% increase that reflects the 16.9% inflation in the consumer price index since 2021.
Essential Income
The 2024 Essential Income for Mesa County is $20.45 per hour or $42,552 annually.
Essential Income Jobs
56% of workers in Mesa County work in occupations with a median income below the 2024 Essential Income. These workers hold roles such as office and administrative support, sales, and food preparation.
Learn More
To learn more about industry and occupation in Mesa County, check out the Grand Junction Economic Partnership’s Data Center.
While many factors go into setting wages, at the community health level, there are clear correlations between increased economic stability and better health outcomes. Often the cost of lower wages is paid by the community in impact to health, educational outcomes, housing stability, and more.
Impact of demographic shifts on jobs
Population demographic changes in Mesa County will continue to affect the labor force as retirees leaving the workforce outnumber new workers entering to replace them. See Population Growth and Age Distribution for an in depth analysis of population trends in Mesa County.
According to the Colorado Department of Local Affairs, both Mesa County and the state of Colorado must attract more workers in order to continue economic growth.
The Bureau of Labor Statistics reports that in the third quarter of 2023, there were 0.8 job seekers for every job listing in Mesa County, compared to 0.7 for the state of Colorado. Demographic shifts may continue to drive this number down as aging workers retire and the cohort of younger workers is too small to replace them.
One important strategy for effectively maintaining a robust workforce is to continue to develop a robust affordable child care system to allow all parents who desire to work to enter the workforce. See the section on childcare and early childhood education in Mesa County for more information.
Attracting workers from other areas will be an important piece of any strategy for economic growth and a dependable labor force, but the impact will be limited by the fact that these shifts and shortages are happening nationwide - meaning every state and region is competing for a smaller workforce.
References
1.
2.
Colorado Center for Law and Policy & University of Washington School of Social Work, The Self Sufficiency Standard for Colorado 2022, November 2022
3.
U.S. Census Bureau, American Community Survey 5-year estimates, Table: DP03; SELECTED ECONOMIC CHARACTERISTICS 2023
4.
U.S. Census Bureau, American Community Survey 5-year estimates, Table: S1101; HOUSEHOLDS AND FAMILIES 2023
5.
U.S. Census Bureau, American Community Survey 5-year estimates, Table: S1903; MEDIAN INCOME IN THE PAST 12 MONTHS, 2023
6.
U.S. Census Bureau, American Community Survey 5-year estimates, Table: S1701; POVERTY STATUS IN THE PAST 12 MONTHS 2023
7.
U.S. Census Bureau, American Community Survey 5-year estimates, Table: B19131; FAMILY TYPE BY PRESENCE OF OWN CHILDREN 2023
8.
U.S. Census Bureau, American Community Survey 5-year estimates, Table: B19215; MEDIAN NONFAMILY HOUSEHOLD INCOME 2023
9.
Mesa County Partnership for Children and Families, Universal Preschool Data, Personal Communication, February 2023
10.
Mesa County Workforce Center, Colorado Child Care Assistance Program for Families Data, Personal Communication, March 2023
11.
Mesa County Women, Infants, and Children (WIC), Benefit Data, Personal Communication, February 2023
12.
Mesa County Department of Human Services, Supplemental Nutrition Assistance Program Data, Personal Communication, March 2023
13.
Colorado Department of Human Services, Colorado’s Low-income Energy Assistance Program (LEAP) sees record number of applications for 2022 heating season, December 2022
14.
U.S. Census Bureau, [Small Area Income and Poverty Estimates(https://www.census.gov/data-tools/demo/saipe/#/)], 2022
15.
Mesa County Master Plan Survey. Mesa County. 2022
16.
Mesa County Workforce Center, Workforce Center Dashboard Statistics, Personal Communication, 2008-2023
17.
Office of Disease Prevention and Health Promotion, Healthy People 2030, Employment, 2023
18.
Colorado Labor Market Information Database, Occupational Employment and Wage Estimates, 2023
19.
Mesa County Workforce Center, Mesa County and Colorado Occupation Data Table, JobsEQ, Data Request, 2024
20.
Colorado Department of Public Health and Environment, Colorado Health Information Dataset - Live Birth Statistics, 2000-2022
21.
Colorado Department of Local Affairs, State Demography Office, Population Resources, 2023
22.
Colorado Department of Local Affairs, State Demography Office, Population Resources, 2023 U.S. Bureau of Labor Statistics, Consumer Price Index, Calendar Year Historical, 2019-2023